
Eハウス市場:産業動向・世界の予測 (~2035年):Eハウスタイプ・コンポーネント・電圧タイプ・用途・Eハウス規模・材料タイプ・地域別
E-House Market, Till 2035: Distribution by Type of E-House, Type of Component, Type of Voltage, Applications, E-house size, Type of Material and Geographical Regions: Industry Trends and Global Forecasts- 発行日
- ページ情報
- 英文 188 Pages
- 納期
- 7~10営業日
- 商品コード
- 1771417
- カスタマイズ可能 お客様のご希望に応じて、既存データの加工や未掲載情報(例:国別セグメント)の追加などの対応が可能です。詳細はお問い合わせください。
- 翻訳ツール提供対象 PDF対応AI翻訳ツールの無料貸し出しサービスのご利用が可能です
- 医薬品関連専門 医薬品関連専門を専門とする市場調査会社です。
概要
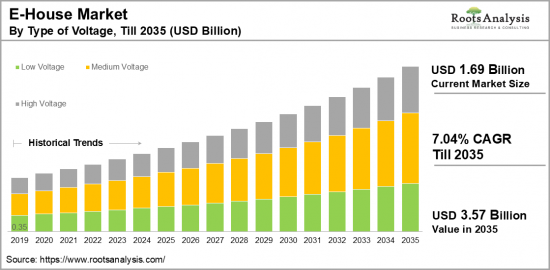
世界のEハウスの市場規模は、2035年までの予測期間中にCAGR 7.04%で推移し、現在の16億9,000万米ドルから、2035年には35億7,000万米ドルに成長すると予測されています。
Eハウスの市場機会:セグメント別
Eハウスタイプ別
- 固定式Eハウス
- 移動式変電所
コンポーネント別
- バスウェイ
- 制御盤
- HVACシステム(暖房、換気、空調)
- 開閉装置
- 変圧器
- UPS(無停電電源装置)
- その他
電圧タイプ別
- 低圧(1KV未満)
- 中圧(1KV-35KV)
- 高圧(35KV超)
用途別
- ユーティリティ
- 産業用
- 化学
- 鉱業・鉱物
- 石油・ガス
- その他
Eハウス規模別
- 小規模
- 中規模
- 大規模
材料タイプ別
- コンポジット
- コンクリート
- スチール
特徴タイプ別
- カスタマイズ型
- モジュール型
- スマート型
地域別
- 北米
- 米国
- カナダ
- メキシコ
- その他の北米諸国
- 欧州
- オーストリア
- ベルギー
- デンマーク
- フランス
- ドイツ
- アイルランド
- イタリア
- オランダ
- ノルウェー
- ロシア
- スペイン
- スウェーデン
- スイス
- 英国
- その他の欧州諸国
- アジア
- 中国
- インド
- 日本
- シンガポール
- 韓国
- その他のアジア諸国
- ラテンアメリカ
- ブラジル
- チリ
- コロンビア
- ベネズエラ
- その他のラテンアメリカ諸国
- 中東・北アフリカ
- エジプト
- イラン
- イラク
- イスラエル
- クウェート
- サウジアラビア
- アラブ首長国連邦
- その他の中東・北アフリカ諸国
- 世界のその他の地域
- オーストラリア
- ニュージーランド
- その他の国
e-house市場:成長と動向
持続可能でエネルギー効率の高い電力ソリューションへの需要の高まりにより、Eハウス市場には新たな可能性が生まれています。Eハウスは、最先端技術、再生可能エネルギー、省エネシステムをシームレスに統合し、環境にやさしい生活環境を実現する構造物です。これらの構造は、コンパクトなモジュール型から、ライフスタイルや個別のニーズに合わせて設計可能な大規模なカスタマイズ型まで、さまざまな形態があります。
Eハウスは通常、再生可能エネルギーと従来の電力網との接続を組み合わせて活用することで、安定かつ持続可能な電力供給を確保し、場合によっては電力網に依存しない自立型の運用も可能にしています。さらに、Eハウスは迅速な導入が可能なプロジェクトソリューションとして機能し、多様な課題に対応しながら持続可能性の目標達成にも寄与します。
SiemensやABBといった企業は、さまざまな産業や用途の電力分配ニーズに対応する、モジュール型かつプラグアンドプレイ対応のソリューションを提供しており、より環境に配慮した先進的な未来への大きな一歩を示しています。さらに、太陽光や風力といった再生可能エネルギーの統合を含むEハウス分野での継続的な技術革新は、産業界に対してよりクリーンで持続可能な選択肢を提供しています。加えて、エネルギー消費の最適化や電力網の安定性向上を目的とした高度な監視・制御システムなどの機能も今後取り入れられると見られており、Eハウスの全体的な性能をさらに高めることが期待されています。こうした継続的な技術革新と導入の進展により、Eハウス市場は予測期間中に著しい成長を遂げると見込まれています。
当レポートでは、世界のEハウスの市場を調査し、 市場概要、背景、市場影響因子の分析、市場規模の推移・予測、各種区分・地域別の詳細分析、競合情勢、主要企業のプロファイルなどをまとめています。
目次
第1章 序文
第2章 調査手法
第3章 経済的およびその他のプロジェクト特有の考慮事項
第4章 マクロ経済指標
第5章 エグゼクティブサマリー
第6章 イントロダクション
第7章 競合情勢
第8章 企業プロファイル
- 章の概要
- Abb
- CR Technology Systems
- Delta Star
- Dijitalist Marketing
- Eaton
- EKOS Eclectic
- Electroinnova
- General Electric
- LS Electric
- Meidensha
- Powell Industries
- Schneider Electric
- Siemens
- TGOOD
- Unit Electrical Engineering
- WEG
第9章 バリューチェーン分析
第10章 SWOT分析
第11章 世界のEハウス市場
第12章 Eハウスタイプ別の市場機会
第13章 コンポーネント別の市場機会
第14章 電圧タイプ別の市場機会
第15章 用途別の市場機会
第16章 Eハウス規模別の市場機会
第17章 材料タイプ別の市場機会
第18章 機能タイプ別の市場機会
第19章 北米におけるEハウスの市場機会
第20章 欧州におけるEハウスの市場機会
第21章 アジアにおけるにおけるEハウスの市場機会
第22章 中東・北アフリカにおけるEハウスの市場機会
第23章 ラテンアメリカにおけるEハウスの市場機会
第24章 世界のその他の地域におけるEハウスの市場機会
第25章 表形式データ
第26章 企業・団体一覧
第27章 カスタマイズの機会
第28章 ROOTSサブスクリプションサービス
第29章 著者詳細
目次
E-House Market Overview
As per Roots Analysis, the global e-house market size is estimated to grow from USD 1.69 billion in the current year to USD 3.57 billion by 2035, at a CAGR of 7.04% during the forecast period, till 2035.
The opportunity for e-house market has been distributed across the following segments:
Type of E-House
- Fixed E-House
- Mobile Substation
Type of Component
- Busway
- Control Panel
- HVAC System (Heating, Ventilation, and Air Conditioning)
- Switchgear
- Transformer
- UPS
- Others
Type of Voltage
- Low (Less than 1KV)
- Medium (1KV- 35 KV)
- High (More than 35 KV)
Type of Applications
- Utilities
- Industrial
- Chemicals
- Mining & Minerals
- Oil & Gas
- Others
E-House Size
- Small
- Medium
- Large
Type of Material
- Composite
- Concrete
- Steel
Type of Feature
- Customized
- Modular
- Smart
Geographical Regions
- North America
- US
- Canada
- Mexico
- Other North American countries
- Europe
- Austria
- Belgium
- Denmark
- France
- Germany
- Ireland
- Italy
- Netherlands
- Norway
- Russia
- Spain
- Sweden
- Switzerland
- UK
- Other European countries
- Asia
- China
- India
- Japan
- Singapore
- South Korea
- Other Asian countries
- Latin America
- Brazil
- Chile
- Colombia
- Venezuela
- Other Latin American countries
- Middle East and North Africa
- Egypt
- Iran
- Iraq
- Israel
- Kuwait
- Saudi Arabia
- UAE
- Other MENA countries
- Rest of the World
- Australia
- New Zealand
- Other countries
E-HOUSE MARKET: GROWTH AND TRENDS
The increasing need for sustainable and energy-efficient power solutions has created new possibilities for the e-house market. E-Houses, commonly referred to as electronic houses, seamlessly integrate cutting-edge technology, renewable energy, and energy-efficient systems to foster an environmentally friendly living experience. These structures vary in form, from compact modular designs to larger fully customizable options, accommodating various lifestyles and preferences.
E-houses generally harness a blend of renewable energy sources and traditional grid connections, ensuring a dependable and sustainable power supply, often enabling them to function independently from the grid. In addition, E-Houses provide a quick project solution, facilitating rapid implementation and addressing diverse project challenges while promoting sustainability objectives.
Companies like Siemens and ABB offer these modular, plug-and-play solutions tailored to meet the specific power distribution requirements of various industries and applications, marking a significant move towards a more environmentally friendly and advanced future. Moreover, continuous technological advancements in the E-house sector, including the integration of renewable energy sources like solar and wind, present industries with the opportunity to adopt cleaner and more sustainable options. Further, features such as sophisticated monitoring and control systems aimed at optimizing energy consumption and improving grid stability are anticipated to be incorporated, enhancing the overall performance of E-houses. With continuous innovation and adoption, the e-houses market is projected to experience significant growth during the forecast period.
E-HOUSE MARKET: KEY SEGMENTS
Market Share by Type of E-House
Based on type of e-house, the global e-house market is segmented into fixed E-House and mobile substation. According to our estimates, currently, mobile substation segment captures the majority share of the market. Additionally, this segment is anticipated to witness a relatively higher CAGR during the forecast period, owing to its high flexibility in transportation and ease of installation.
Market Share by Type of Component
Based on type of component, the e-house market is segmented into busway, control panel, HVAC system, switchgear, transformer, ups and others. According to our estimates, currently, switchgear segment captures the majority of the market. This can be attributed to its essential function in e-house, which is to protect electrical infrastructure from damage caused by inconsistent power supply. However, UPS segment is projected to experience the highest growth rate among the various components due to its role in providing uninterrupted power supply for industrial applications.
Market Share by Type of Voltage
Based on type of voltage, the e-house market is segmented into low voltage, medium voltage and high voltage. According to our estimates, currently, medium voltage segment captures the majority share of the market. This growth can be attributed to the increasing use of e-house across various sectors, such as mining, oil and gas, renewable energy, and utilities. It is important to note that medium voltage e-houses are most commonly found in these industries and can significantly contribute to market growth.
Market Share by Applications
Based on applications, the e-house market is segmented into industrial and utilities (chemicals, mining & minerals, oil & gas and others). According to our estimates, currently, industrial segment captures the majority share of the market. This can be attributed to the significant need for a reliable power supply in several industries, including oil and gas, mining, and manufacturing.
Market Share by E-House Size
Based on e-house size, the e-house market is segmented into small, medium and large. According to our estimates, currently, medium e-house captures the majority share of the market. This can be attributed to the fact that medium e-houses are adaptable and commonly utilized, as they can serve a diverse array of utilities and industrial needs.
Market Share by Type of Material
Based on type of material, the e-house market is segmented into composite, concrete and steel. According to our estimates, currently, steel segment captures the majority share of the market and is projected to experience the highest compound annual growth rate (CAGR) during the forecast period. This trend is linked to its exceptional structural integrity and durability, which are crucial for e-houses to endure extreme environmental conditions and heavy loads. Additionally, the scalability of steel is noteworthy, allowing for easy adjustments in size and complexity of the e-house as needed.
Market Share by Type of Feature
Based on type of feature, the e-house market is segmented into customized, modular and smart. According to our estimates, currently, modular segment captures the majority share of the market. This can be attributed to the fact that modular solution provides multiple benefits, such as efficient space utilization, adaptability, shorter construction timelines, and cost efficiency.
Market Share by Geographical Regions
Based on geographical regions, the e-house market is segmented into North America, Europe, Asia, Latin America, Middle East and North Africa, and the rest of the world. According to our estimates, currently, Asia captures the majority share of the market. The key driver of growth in this region is attributed to the swift industrialization and urbanization occurring in countries like China and India. Additionally, the increasing demand for electricity is a significant contributing factor.
Example Players in E-house Market
- ABB
- CR Technology Systems
- Delta Star
- Dijitalist Marketing
- Eaton
- EKOS Eclectic
- Electroinnova
- General Electric
- LS Electric
- Meidensha
- Powell Industries
- Schneider Electric
- Siemens
- TGOOD
- Unit Electrical Engineering
- WEG
E-HOUSE MARKET: RESEARCH COVERAGE
The report on the e-house market features insights on various sections, including:
- Market Sizing and Opportunity Analysis: An in-depth analysis of the e-house market, focusing on key market segments, including [A] type of e-house, [B] type of component, [C] type of voltage, [D] applications, [E] E-house size, [F] type of material and [G] geographical regions.
- Competitive Landscape: A comprehensive analysis of the companies engaged in the e-house market, based on several relevant parameters, such as [A] year of establishment, [B] company size, [C] location of headquarters and [D] ownership structure.
- Company Profiles: Elaborate profiles of prominent players engaged in the e-house market, providing details on [A] location of headquarters, [B] company size, [C] company mission, [D] company footprint, [E] management team, [F] contact details, [G] financial information, [H] operating business segments, [I] service / product portfolio, [J] moat analysis, [K] recent developments, and an informed future outlook.
- SWOT Analysis: An insightful SWOT framework, highlighting the strengths, weaknesses, opportunities and threats in the domain. Additionally, it provides Harvey ball analysis, highlighting the relative impact of each SWOT parameter.
KEY QUESTIONS ANSWERED IN THIS REPORT
- How many companies are currently engaged in e-house market?
- Which are the leading companies in this market?
- What factors are likely to influence the evolution of this market?
- What is the current and future market size?
- What is the CAGR of this market?
- How is the current and future market opportunity likely to be distributed across key market segments?
REASONS TO BUY THIS REPORT
- The report provides a comprehensive market analysis, offering detailed revenue projections of the overall market and its specific sub-segments. This information is valuable to both established market leaders and emerging entrants.
- Stakeholders can leverage the report to gain a deeper understanding of the competitive dynamics within the market. By analyzing the competitive landscape, businesses can make informed decisions to optimize their market positioning and develop effective go-to-market strategies.
- The report offers stakeholders a comprehensive overview of the market, including key drivers, barriers, opportunities, and challenges. This information empowers stakeholders to stay abreast of market trends and make data-driven decisions to capitalize on growth prospects.
ADDITIONAL BENEFITS
- Complimentary Excel Data Packs for all Analytical Modules in the Report
- 15% Free Content Customization
- Detailed Report Walkthrough Session with Research Team
- Free Updated report if the report is 6-12 months old or older
TABLE OF CONTENTS
1. PREFACE
- 1.1. Introduction
- 1.2. Market Share Insights
- 1.3. Key Market Insights
- 1.4. Report Coverage
- 1.5. Key Questions Answered
- 1.6. Chapter Outlines
2. RESEARCH METHODOLOGY
- 2.1. Chapter Overview
- 2.2. Research Assumptions
- 2.3. Database Building
- 2.3.1. Data Collection
- 2.3.2. Data Validation
- 2.3.3. Data Analysis
- 2.4. Project Methodology
- 2.4.1. Secondary Research
- 2.4.1.1. Annual Reports
- 2.4.1.2. Academic Research Papers
- 2.4.1.3. Company Websites
- 2.4.1.4. Investor Presentations
- 2.4.1.5. Regulatory Filings
- 2.4.1.6. White Papers
- 2.4.1.7. Industry Publications
- 2.4.1.8. Conferences and Seminars
- 2.4.1.9. Government Portals
- 2.4.1.10. Media and Press Releases
- 2.4.1.11. Newsletters
- 2.4.1.12. Industry Databases
- 2.4.1.13. Roots Proprietary Databases
- 2.4.1.14. Paid Databases and Sources
- 2.4.1.15. Social Media Portals
- 2.4.1.16. Other Secondary Sources
- 2.4.2. Primary Research
- 2.4.2.1. Introduction
- 2.4.2.2. Types
- 2.4.2.2.1. Qualitative
- 2.4.2.2.2. Quantitative
- 2.4.2.3. Advantages
- 2.4.2.4. Techniques
- 2.4.2.4.1. Interviews
- 2.4.2.4.2. Surveys
- 2.4.2.4.3. Focus Groups
- 2.4.2.4.4. Observational Research
- 2.4.2.4.5. Social Media Interactions
- 2.4.2.5. Stakeholders
- 2.4.2.5.1. Company Executives (CXOs)
- 2.4.2.5.2. Board of Directors
- 2.4.2.5.3. Company Presidents and Vice Presidents
- 2.4.2.5.4. Key Opinion Leaders
- 2.4.2.5.5. Research and Development Heads
- 2.4.2.5.6. Technical Experts
- 2.4.2.5.7. Subject Matter Experts
- 2.4.2.5.8. Scientists
- 2.4.2.5.9. Doctors and Other Healthcare Providers
- 2.4.2.6. Ethics and Integrity
- 2.4.2.6.1. Research Ethics
- 2.4.2.6.2. Data Integrity
- 2.4.3. Analytical Tools and Databases
- 2.4.1. Secondary Research
3. ECONOMIC AND OTHER PROJECT SPECIFIC CONSIDERATIONS
- 3.1. Forecast Methodology
- 3.1.1. Top-Down Approach
- 3.1.2. Bottom-Up Approach
- 3.1.3. Hybrid Approach
- 3.2. Market Assessment Framework
- 3.2.1. Total Addressable Market (TAM)
- 3.2.2. Serviceable Addressable Market (SAM)
- 3.2.3. Serviceable Obtainable Market (SOM)
- 3.2.4. Currently Acquired Market (CAM)
- 3.3. Forecasting Tools and Techniques
- 3.3.1. Qualitative Forecasting
- 3.3.2. Correlation
- 3.2.3. Regression
- 3.3.4. Time Series Analysis
- 3.3.5. Extrapolation
- 3.3.6. Convergence
- 3.3.7. Forecast Error Analysis
- 3.3.8. Data Visualization
- 3.3.9. Scenario Planning
- 3.3.10. Sensitivity Analysis
- 3.4. Key Considerations
- 3.4.1. Demographics
- 3.4.2. Market Access
- 3.4.3. Reimbursement Scenarios
- 3.4.4. Industry Consolidation
- 3.5. Robust Quality Control
- 3.6. Key Market Segmentations
- 3.7 Limitations
4. MACRO-ECONOMIC INDICATORS
- 4.1. Chapter Overview
- 4.2. Market Dynamics
- 4.2.1. Time Period
- 4.2.1.1. Historical Trends
- 4.2.1.2. Current and Forecasted Estimates
- 4.2.2. Currency Coverage
- 4.2.2.1. Overview of Major Currencies Affecting the Market
- 4.2.2.2. Impact of Currency Fluctuations on the Industry
- 4.2.3. Foreign Exchange Impact
- 4.2.3.1. Evaluation of Foreign Exchange Rates and Their Impact on Market
- 4.2.3.2. Strategies for Mitigating Foreign Exchange Risk
- 4.2.4. Recession
- 4.2.4.1. Historical Analysis of Past Recessions and Lessons Learnt
- 4.2.4.2. Assessment of Current Economic Conditions and Potential Impact on the Market
- 4.2.5. Inflation
- 4.2.5.1. Measurement and Analysis of Inflationary Pressures in the Economy
- 4.2.5.2. Potential Impact of Inflation on the Market Evolution
- 4.2.6. Interest Rates
- 4.2.6.1. Overview of Interest Rates and Their Impact on the Market
- 4.2.6.2. Strategies for Managing Interest Rate Risk
- 4.2.7. Commodity Flow Analysis
- 4.2.7.1. Type of Commodity
- 4.2.7.2. Origins and Destinations
- 4.2.7.3. Values and Weights
- 4.2.7.4. Modes of Transportation
- 4.2.8. Global Trade Dynamics
- 4.2.8.1. Import Scenario
- 4.2.8.2. Export Scenario
- 4.2.9. War Impact Analysis
- 4.2.9.1. Russian-Ukraine War
- 4.2.9.2. Israel-Hamas War
- 4.2.10. COVID Impact / Related Factors
- 4.2.10.1. Global Economic Impact
- 4.2.10.2. Industry-specific Impact
- 4.2.10.3. Government Response and Stimulus Measures
- 4.2.10.4. Future Outlook and Adaptation Strategies
- 4.2.11. Other Indicators
- 4.2.11.1. Fiscal Policy
- 4.2.11.2. Consumer Spending
- 4.2.11.3. Gross Domestic Product (GDP)
- 4.2.11.4. Employment
- 4.2.11.5. Taxes
- 4.2.11.6. R&D Innovation
- 4.2.11.7. Stock Market Performance
- 4.2.11.8. Supply Chain
- 4.2.11.9. Cross-Border Dynamics
- 4.2.1. Time Period
5. EXECUTIVE SUMMARY
6. INTRODUCTION
- 6.1. Chapter Overview
- 6.2. Overview of E-House
- 6.2.1. E-House Size
- 6.2.2. Type of Component
- 6.2.3. Type of Voltage
- 6.2.4. Applications
- 6.2.5. Type of Materials
- 6.2.6. Type of Features
- 6.3. Future Perspective
7. COMPETITIVE LANDSCAPE
- 7.1. Chapter Overview
- 7.2. E-House: Overall Market Landscape
- 7.2.1. Analysis by Year of Establishment
- 7.2.2. Analysis by Company Size
- 7.2.3. Analysis by Location of Headquarters
- 7.2.4. Analysis by Ownership Structure
8. COMPANY PROFILES
- 8.1. Chapter Overview
- 8.1.1. Abb*
- 8.1.2. Company Overview
- 8.1.3. Company Mission
- 8.1.4. Company Footprint
- 8.1.5. Management Team
- 8.1.6. Contact Details
- 8.1.7. Financial Performance
- 8.1.8. Operating Business Segments
- 8.1.9. Service / Product Portfolio (project specific)
- 8.1.10. MOAT Analysis
- 8.1.11. Recent Developments and Future Outlook
information in the public domain
- 8.2. CR Technology Systems
- 8.3. Delta Star
- 8.4. Dijitalist Marketing
- 8.5. Eaton
- 8.6. EKOS Eclectic
- 8.7. Electroinnova
- 8.8. General Electric
- 8.9. LS Electric
- 8.10. Meidensha
- 8.11. Powell Industries
- 8.12. Schneider Electric
- 8.13. Siemens
- 8.14. TGOOD
- 8.15. Unit Electrical Engineering
- 8.16. WEG
9. VALUE CHAIN ANALYSIS
10. SWOT ANALYSIS
11. GLOBAL E-HOUSE MARKET
- 11.1. Chapter Overview
- 11.2. Key Assumptions and Methodology
- 11.3. Trends Disruption Impacting Market
- 11.4. Global E-House Market, Historical Trends (Since 2019) and Forecasted Estimates (Till 2035)
- 11.5. Multivariate Scenario Analysis
- 11.5.1. Conservative Scenario
- 11.5.2. Optimistic Scenario
- 11.6. Key Market Segmentations
12. MARKET OPPORTUNITIES BASED ON TYPE OF E-HOUSE
- 12.1. Chapter Overview
- 12.2. Key Assumptions and Methodology
- 12.3. Revenue Shift Analysis
- 12.4. Market Movement Analysis
- 12.5. Penetration-Growth (P-G) Matrix
- 12.6. E-House Market for Fixed E-House: Historical Trends (Since 2019) and Forecasted Estimates (Till 2035)
- 12.7. E-House Market for Mobile Substation: Historical Trends (Since 2019) and Forecasted Estimates (Till 2035)
- 12.8. Data Triangulation and Validation
13. MARKET OPPORTUNITIES BASED ON TYPE OF COMPONENT
- 13.1. Chapter Overview
- 13.2. Key Assumptions and Methodology
- 13.3. Revenue Shift Analysis
- 13.4. Market Movement Analysis
- 13.5. Penetration-Growth (P-G) Matrix
- 13.6. E-House Market for Busway: Historical Trends (Since 2019) and Forecasted Estimates (Till 2035)
- 13.7. E-House Market for Control Panel: Historical Trends (Since 2019) and Forecasted Estimates (Till 2035)
- 13.8. E-House Market for HVAC System: Historical Trends (Since 2019) and Forecasted Estimates (Till 2035)
- 13.9. E-House Market for Switchgear: Historical Trends (Since 2019) and Forecasted Estimates (Till 2035)
- 13.10. E-House Market for Transformer: Historical Trends (Since 2019) and Forecasted Estimates (Till 2035)
- 13.11. E-House Market for UPS: Historical Trends (Since 2019) and Forecasted Estimates (Till 2035)
- 13.12. E-House Market for Others: Historical Trends (Since 2019) and Forecasted Estimates (Till 2035)
- 13.13. Data Triangulation and Validation
14. MARKET OPPORTUNITIES BASED ON TYPE OF VOLTAGE
- 14.1. Chapter Overview
- 14.2. Key Assumptions and Methodology
- 14.3. Revenue Shift Analysis
- 14.4. Market Movement Analysis
- 14.5. Penetration-Growth (P-G) Matrix
- 14.6. E-House Market for Low: Historical Trends (Since 2019) and Forecasted Estimates (Till 2035)
- 14.7. E-House Market for Medium: Historical Trends (Since 2019) and Forecasted Estimates (Till 2035)
- 14.8. E-House Market for High: Historical Trends (Since 2019) and Forecasted Estimates (Till 2035)
- 14.9. Data Triangulation and Validation
15. MARKET OPPORTUNITIES BASED ON TYPE OF APPLICATIONS
- 15.1. Chapter Overview
- 15.2. Key Assumptions and Methodology
- 15.3. Revenue Shift Analysis
- 15.4. Market Movement Analysis
- 15.5. Penetration-Growth (P-G) Matrix
- 15.6. E-House Market for Utilities: Historical Trends (Since 2019) and Forecasted Estimates (Till 2035)
- 15.7. E-House Market for Industries: Historical Trends (Since 2019) and Forecasted Estimates (Till 2035)
- 15.8. Data Triangulation and Validation
16. MARKET OPPORTUNITIES BASED ON E-HOUSE SIZE
- 16.1. Chapter Overview
- 16.2. Key Assumptions and Methodology
- 16.3. Revenue Shift Analysis
- 16.4. Market Movement Analysis
- 16.5. Penetration-Growth (P-G) Matrix
- 16.6. E-House Market for Small Size: Historical Trends (Since 2019) and Forecasted Estimates (Till 2035)
- 16.7. E-House Market for Medium Size: Historical Trends (Since 2019) and Forecasted Estimates (Till 2035)
- 16.8. E-House Market for Large Size: Historical Trends (Since 2019) and Forecasted Estimates (Till 2035)
- 16.9. Data Triangulation and Validation
17. MARKET OPPORTUNITIES BASED ON TYPE OF MATERIAL
- 17.1. Chapter Overview
- 17.2. Key Assumptions and Methodology
- 17.3. Revenue Shift Analysis
- 17.4. Market Movement Analysis
- 17.5. Penetration-Growth (P-G) Matrix
- 17.6. E-House Market for Composite: Historical Trends (Since 2019) and Forecasted Estimates (Till 2035)
- 17.7. E-House Market for Concrete: Historical Trends (Since 2019) and Forecasted Estimates (Till 2035)
- 17.8. E-House Market for Steel: Historical Trends (Since 2019) and Forecasted Estimates (Till 2035)
- 17.9. Data Triangulation and Validation
18. MARKET OPPORTUNITIES BASED ON TYPE OF FEATURE
- 18.1. Chapter Overview
- 18.2. Key Assumptions and Methodology
- 18.3. Revenue Shift Analysis
- 18.4. Market Movement Analysis
- 18.5. Penetration-Growth (P-G) Matrix
- 18.6. E-House Market for Customized: Historical Trends (Since 2019) and Forecasted Estimates (Till 2035)
- 18.7. E-House Market for Modular: Historical Trends (Since 2019) and Forecasted Estimates (Till 2035)
- 18.8. E-House Market for Smart: Historical Trends (Since 2019) and Forecasted Estimates (Till 2035)
- 18.9. Data Triangulation and Validation
19 MARKET OPPORTUNITIES FOR E-HOUSE IN NORTH AMERICA
- 19.1. Chapter Overview
- 19.2. Key Assumptions and Methodology
- 19.3. Revenue Shift Analysis
- 19.4. Market Movement Analysis
- 19.5. Penetration-Growth (P-G) Matrix
- 19.6. E-House Market in North America: Historical Trends (Since 2019) and Forecasted Estimates (Till 2035)
- 19.6.1. E-House Market in the US: Historical Trends (Since 2019) and Forecasted Estimates (Till 2035)
- 19.6.2. E-House Market in Canada: Historical Trends (Since 2019) and Forecasted Estimates (Till 2035)
- 19.6.3. E-House Market in Mexico: Historical Trends (Since 2019) and Forecasted Estimates (Till 2035)
- 19.6.4. E-House Market in Other North American Countries: Historical Trends (Since 2019) and Forecasted Estimates (Till 2035)
- 19.7. Data Triangulation and Validation
20. MARKET OPPORTUNITIES FOR E-HOUSE IN EUROPE
- 20.1. Chapter Overview
- 20.2. Key Assumptions and Methodology
- 20.3. Revenue Shift Analysis
- 20.4. Market Movement Analysis
- 20.5. Penetration-Growth (P-G) Matrix
- 20.6. E-House Market in Europe: Historical Trends (Since 2019) and Forecasted Estimates (Till 2035)
- 20.6.1. E-House Market in the Austria: Historical Trends (Since 2019) and Forecasted Estimates (Till 2035)
- 20.6.2. E-House Market in Belgium: Historical Trends (Since 2019) and Forecasted Estimates (Till 2035)
- 20.6.3. E-House Market in Denmark: Historical Trends (Since 2019) and Forecasted Estimates (Till 2035)
- 20.6.4. E-House Market in France: Historical Trends (Since 2019) and Forecasted Estimates (Till 2035)
- 20.6.5. E-House Market in Germany: Historical Trends (Since 2019) and Forecasted Estimates (Till 2035)
- 20.6.6. E-House Market in Ireland: Historical Trends (Since 2019) and Forecasted Estimates (Till 2035)
- 20.6.7. E-House Market in Italy: Historical Trends (Since 2019) and Forecasted Estimates (Till 2035)
- 20.6.8. E-House Market in Netherlands: Historical Trends (Since 2019) and Forecasted Estimates (Till 2035)
- 20.6.9. E-House Market in Norway: Historical Trends (Since 2019) and Forecasted Estimates (Till 2035)
- 20.6.10. E-House Market in Russia: Historical Trends (Since 2019) and Forecasted Estimates (Till 2035)
- 20.6.11. E-House Market in Spain: Historical Trends (Since 2019) and Forecasted Estimates (Till 2035)
- 20.6.12. E-House Market in Sweden: Historical Trends (Since 2019) and Forecasted Estimates (Till 2035)
- 20.6.13. E-House Market in Switzerland: Historical Trends (Since 2019) and Forecasted Estimates (Till 2035)
- 20.6.14. E-House Market in the UK: Historical Trends (Since 2019) and Forecasted Estimates (Till 2035)
- 20.6.15. E-House Market in Other European Countries: Historical Trends (Since 2019) and Forecasted Estimates (Till 2035)
- 20.7. Data Triangulation and Validation
21. MARKET OPPORTUNITIES FOR E-HOUSE IN ASIA
- 21.1. Chapter Overview
- 21.2. Key Assumptions and Methodology
- 21.3. Revenue Shift Analysis
- 21.4. Market Movement Analysis
- 21.5. Penetration-Growth (P-G) Matrix
- 21.6. E-House Market in Asia: Historical Trends (Since 2019) and Forecasted Estimates (Till 2035)
- 21.6.1. E-House Market in China: Historical Trends (Since 2019) and Forecasted Estimates (Till 2035)
- 21.6.2. E-House Market in India: Historical Trends (Since 2019) and Forecasted Estimates (Till 2035)
- 21.6.3. E-House Market in Japan: Historical Trends (Since 2019) and Forecasted Estimates (Till 2035)
- 21.6.4. E-House Market in Singapore: Historical Trends (Since 2019) and Forecasted Estimates (Till 2035)
- 21.6.5. E-House Market in South Korea: Historical Trends (Since 2019) and Forecasted Estimates (Till 2035)
- 21.6.6. E-House Market in Other Asian Countries: Historical Trends (Since 2019) and Forecasted Estimates (Till 2035)
- 21.7. Data Triangulation and Validation
22. MARKET OPPORTUNITIES FOR E-HOUSE IN MIDDLE EAST AND NORTH AFRICA
- 22.1. Chapter Overview
- 22.2. Key Assumptions and Methodology
- 22.3. Revenue Shift Analysis
- 22.4. Market Movement Analysis
- 22.5. Penetration-Growth (P-G) Matrix
- 22.6. E-House Market in Middle East and North Africa (MENA): Historical Trends (Since 2019) and Forecasted Estimates (Till 2035)
- 22.6.1. E-House Market in Egypt: Historical Trends (Since 2019) and Forecasted Estimates (Till 205)
- 22.6.2. E-House Market in Iran: Historical Trends (Since 2019) and Forecasted Estimates (Till 2035)
- 22.6.3. E-House Market in Iraq: Historical Trends (Since 2019) and Forecasted Estimates (Till 2035)
- 22.6.4. E-House Market in Israel: Historical Trends (Since 2019) and Forecasted Estimates (Till 2035)
- 22.6.5. E-House Market in Kuwait: Historical Trends (Since 2019) and Forecasted Estimates (Till 2035)
- 22.6.6. E-House Market in Saudi Arabia: Historical Trends (Since 2019) and Forecasted Estimates (Till 2035)
- 22.6.7. E-House Market in United Arab Emirates (UAE): Historical Trends (Since 2019) and Forecasted Estimates (Till 2035)
- 22.6.8. E-House Market in Other MENA Countries: Historical Trends (Since 2019) and Forecasted Estimates (Till 2035)
- 22.7. Data Triangulation and Validation
23. MARKET OPPORTUNITIES FOR E-HOUSE IN LATIN AMERICA
- 23.1. Chapter Overview
- 23.2. Key Assumptions and Methodology
- 23.3. Revenue Shift Analysis
- 23.4. Market Movement Analysis
- 23.5. Penetration-Growth (P-G) Matrix
- 23.6. E-House Market in Latin America: Historical Trends (Since 2019) and Forecasted Estimates (Till 2035)
- 23.6.1. E-House Market in Argentina: Historical Trends (Since 2019) and Forecasted Estimates (Till 2035)
- 23.6.2. E-House Market in Brazil: Historical Trends (Since 2019) and Forecasted Estimates (Till 2035)
- 23.6.3. E-House Market in Chile: Historical Trends (Since 2019) and Forecasted Estimates (Till 2035)
- 23.6.4. E-House Market in Colombia Historical Trends (Since 2019) and Forecasted Estimates (Till 2035)
- 23.6.5. E-House Market in Venezuela: Historical Trends (Since 2019) and Forecasted Estimates (Till 2035)
- 23.6.6. E-House Market in Other Latin American Countries: Historical Trends (Since 2019) and Forecasted Estimates (Till 2035)
- 23.7. Data Triangulation and Validation
24. MARKET OPPORTUNITIES FOR E-HOUSE IN REST OF THE WORLD
- 24.1. Chapter Overview
- 24.2. Key Assumptions and Methodology
- 24.3. Revenue Shift Analysis
- 24.4. Market Movement Analysis
- 24.5. Penetration-Growth (P-G) Matrix
- 24.6. E-House Market in Rest of the World: Historical Trends (Since 2019) and Forecasted Estimates (Till 2035)
- 24.6.1. E-House Market in Australia: Historical Trends (Since 2019) and Forecasted Estimates (Till 2035)
- 24.6.2. E-House Market in New Zealand: Historical Trends (Since 2019) and Forecasted Estimates (Till 2035)
- 24.6.3. E-House Market in Other Countries
- 24.7. Data Triangulation and Validation
25. TABULATED DATA
26. LIST OF COMPANIES AND ORGANIZATIONS
27. CUSTOMIZATION OPPORTUNITIES
28. ROOTS SUBSCRIPTION SERVICES
29. AUTHOR DETAIL
- 発行日
- 発行
- Roots Analysis
- ページ情報
- 英文 188 Pages
- 納期
- 7~10営業日