
|
市場調査レポート
商品コード
1771300
家庭用採血デバイス市場:業界動向と世界の予測 - 血液サンプルの状態別、サンプル採取方法別、デバイスの使用法別、応用分野別、主要地域別At Home Blood Collection Devices Market: Industry Trends and Global Forecasts - Distribution by Type of Blood Sample State, Method of Sample Collection, Device Usage, Area of Application, and Key Geographical Regions |
||||||
カスタマイズ可能
|
|||||||
| 家庭用採血デバイス市場:業界動向と世界の予測 - 血液サンプルの状態別、サンプル採取方法別、デバイスの使用法別、応用分野別、主要地域別 |
|
出版日: 2025年07月15日
発行: Roots Analysis
ページ情報: 英文 190 Pages
納期: 即日から翌営業日
|

全表示
- 概要
- 図表
- 目次
世界の家庭用採血デバイス概要
世界の家庭用採血デバイスの市場規模は現在7億4,700万米ドルとなっています。同市場は、予測期間中に10.7%のCAGRで拡大すると予測されています。
市場セグメンテーションでは、市場規模と機会分析を以下のパラメータで区分しています:
血液サンプルの状態
- 乾燥血液サンプル
- 液体血液サンプル
サンプル採取方法
- フィンガースティック法
- プッシュボタン法
デバイスの使用法
- 単回使用機器
- 再使用装置
応用分野
- 診断
- 調査
- 治療
- その他
主な地域
- 北米
- 欧州
- アジア太平洋
- ラテンアメリカ
- 中東・北アフリカ
世界の家庭用採血デバイス成長と動向
過去において、採血は侵襲的で時間がかかり、ヘルスケアの専門家が必要でした。しかし近年、家庭での採血方法は急速に進化しています。実際、ある調査によると、参加者の69%が、自己採血のように自分で採取したサンプルを提供する選択肢があれば、臨床試験に参加する可能性が高くなると回答しています。その結果、在宅検査キットの数はここ数年で増加しています。
さらに、COVID-19時代には、物理的距離を保ち、感染リスクを回避するために、ポイント・オブ・ケア治療の需要が高まり、その結果、検体採取と検査のために検査施設を訪れる患者数が減少しました。その結果、この分野の複数の利害関係者が、患者が自宅で遠隔から血液サンプルを採取できるようにする新しい装置や技術を開発するようになっています。分子検出技術の進歩と、検査に必要なサンプル量の大幅な減少に伴い、小型デバイスは、ポイント・オブ・ケア・アプリケーションに向けて診断およびモニタリング・プラットフォームを変革しつつあります。この技術は、微量サンプルの血液を採取するためによく知られています。さらに、これらの技術は、侵襲性が高く、分析にばらつきが見られる可能性のある従来のサンプリング技術と比較して、より使いやすいです。
世界の家庭用採血デバイス主な洞察
当レポートでは、世界の家庭用採血デバイスの現状を掘り下げ、業界内の潜在的な成長機会を特定しています。当レポートの主な調査結果は以下の通りです。
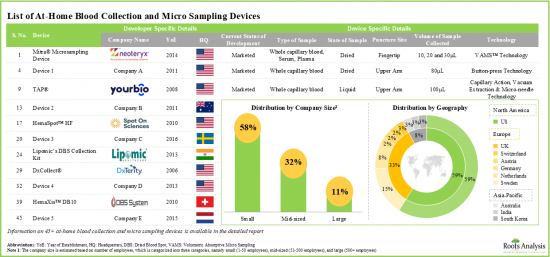
- 現在、50近くの家庭用採血およびマイクロサンプリング装置が利用可能/開発中であり、この領域に従事する企業の大半は米国に所在する新興企業または小規模企業です。
- 毛細血管全血の採取を目的とした家庭用装置のほとんどが現在販売されており、乾燥血液スポットカードの製剤に使用されるDBS技術が最も人気のあるプラットフォームとして浮上しています。
- 最近、TAP(R)IIおよびTasso-M20自己採血装置が欧州委員会からCEマークの承認を受けました。
- あらゆる種類の血液サンプルを提供する企業の例としては、(アルファベット順に)DBS System、Neoteryx、Sandstone Diagnostics、Sedia Biosciencesなどがあります。
- 競争優位性を獲得するため、利害関係者は積極的に製品ポートフォリオを拡大し、高度な機能を組み込んで機器をアップグレードしています。
- 利害関係者の関心の高まりは、最近の提携活動の活発化にも反映されており、これまでに締結された取引のかなりの割合が市場拡大に焦点を当てたものでした。
- 長年にわたり、採血デバイス関連の知的財産は目覚ましいペースで成長しており、特許の大半は業界参入企業により出願されています。
- この領域で出願/付与された特許数はCAGR 11%で増加しており、2019年に出願/付与された特許数が最大となっています。
- 価値の高い特許は、サンプルの収集、安定化、保存のためのシステムおよび方法を含む血液サンプル管理に焦点を当てています。
- ほとんどの特許は北米で出願/付与されており、この地域では90%以上の特許が業界参入企業により出願されています。
- この分野での継続的な技術革新を支援するため、民間および公的投資家は、様々な業界利害関係者が実施する取り組みに対して、6億5,000万米ドル相当の大規模な資本投資を行っています。
- この分野での資金調達と投資活動は、CAGR12%で増加しています。投資総額のかなりの割合が過去2年間に行われたものです。
- 大手企業に加え、いくつかの中堅・中小企業がIPO、ベンチャーキャピタル、その他の株式を通じて資金を調達しました。
- COVID-19パンデミックの間に家庭用採血およびマイクロサンプリング装置の採用が好意的に増加したことを考えると、市場は予測される将来において大きな成長を示すと予想されます。
家庭用採血デバイスの主な参入企業
- ユーロイムン
- エバリーウェル
- ラボコープ
- ラボノバム
- ラメディテック
- クエスト・ダイアグノスティックス
- スポットオンサイエンス
- タッソ
- ウィーバーヘルス
- ユアバイオヘルス
当レポートでは、世界の家庭用採血デバイス市場について調査し、市場の概要とともに、血液サンプルの状態別、サンプル採取方法別、デバイスの使用法別、応用分野別動向、地域別の動向、および市場に参入する企業のプロファイルなどを提供しています。
目次
第1章 序文
第2章 エグゼクティブサマリー
第3章 イントロダクション
- 章の概要
- 在宅血液採取および微量サンプル採取装置の概要
- 血液サンプル採取と検査の応用
- 血液サンプルタイプ
- 在宅採血のメリット
- 在宅採血に使用される方法
- 在宅血液採取および微量血液サンプル採取装置のタイプ
- 将来の展望
第4章 市場概要
- 章の概要
- 在宅血液採取・微量サンプル採取装置:市場情勢
- 在宅血液採取・微量サンプル採取装置:開発企業一覧
- 最もアクティブな参入企業:製品数別
第5章 製品競争力分析
- 章の概要
- 前提と主要な入力パラメータ
- 調査手法
第6章 企業プロファイル
- 章の概要
- EUROIMMUN
- Everlywell
- Labcorp
- Labonovum
- Lameditech
- Quest Diagnostics
- Spot On Sciences
- Tasso
- Weavr Health
- YourBio Health
第7章 特許分析
- 章の概要
- 在宅血液採取および微量サンプル採取装置:特許分析
第8章 パートナーシップ
- 章の概要
- パートナーシップモデル
- 在宅血液採取および微量サンプル採取装置:提携先一覧
第9章 資金調達と投資分析
- 章の概要
- 資金調達の種類
- 在宅血液採取および微量サンプル採取装置:資金調達と投資分析
- 結論
第10章 コスト削減分析
- 章の概要
- 主な前提
- 調査手法
- 在宅血液採取および微量サンプル採取装置別全体的なコスト削減の可能性
- 結論
第11章 市場予測
- 章の概要
- 予測調査手法と前提
- 在宅血液採取・マイクロサンプリング装置の世界市場(2035年まで)
- 在宅血液採取・マイクロサンプリング装置市場(2035年まで):血液サンプルの状態別
- 在宅血液採取・マイクロサンプリング装置市場(2035年まで):サンプル採取方法別
- 在宅血液採取・マイクロサンプリング機器市場(2035年まで):デバイスの使用法別
- 在宅血液採取・マイクロサンプリング装置市場(2035年まで):応用分野別
- 在宅血液採取・マイクロサンプリング装置市場(2035年まで):地域別
第12章 結論
第13章 エグゼクティブ洞察
第14章 付録I:表形式データ
第15章 付録II:企業および組織の一覧
List of Tables
- Table 3.1 Various Applications of Complete Blood Count Test
- Table 3.2 Various Applications of Basic Metabolic Panel
- Table 3.3 Various Applications of Lipoprotein Panel
- Table 4.1 At-Home Blood Collection and Micro Sampling Devices: Current Market Landscape
- Table 4.2 At-Home Blood Collection and Micro Sampling Devices: Information on Devices
- Table 4.3 At-Home Blood Collection and Micro Sampling Devices: Information on Samples Collected
- Table 4.4 At-Home Blood Collection and Micro Sampling Devices: Information on Type of Technology and Application Area
- Table 4.5 At-Home Blood Collection and Micro Sampling Devices: List of Developers
- Table 6.1 EUROIMMUN: Company Overview
- Table 6.2 EUROIMMUN: Product Portfolio
- Table 6.3 Everlywell: Company Overview
- Table 6.4 Everlywell: Product Portfolio
- Table 6.5 Everlywell: Recent Developments and Future Outlook
- Table 6.6 Labcorp: Company Overview
- Table 6.7 Labcorp: Product Portfolio
- Table 6.8 Labonovum: Company Overview
- Table 6.9 Labonovum: Product Portfolio
- Table 6.10 Lameditech: Company Overview
- Table 6.11 Lameditech: Product Portfolio
- Table 6.12 Quest Diagnostics: Company Overview
- Table 6.13 Quest Diagnostics: Product Portfolio
- Table 6.14 Spot on Sciences: Company Overview
- Table 6.15 Spot on Sciences: Product Portfolio
- Table 6.16 Spot on Science: Recent Developments and Future Outlook
- Table 6.17 Tasso: Company Overview
- Table 6.18 Tasso: Product Portfolio
- Table 6.19 Tasso: Recent Developments and Future Outlook
- Table 6.20 Weavr Health: Company Overview
- Table 6.21 Weavr Health: Product Portfolio
- Table 6.22 Weavr Health: Recent Developments and Future Outlook
- Table 6.23 YourBio Health: Company Overview
- Table 6.24 YourBio Health: Product Portfolio
- Table 7.1 Patent Analysis: List of Top CPC Symbols
- Table 7.2 Patent Analysis: Summary of Benchmarking Analysis
- Table 7.3 Patent Analysis: Various Categorizations based on Weighted Valuation Scores
- Table 7.4 Patent Analysis: List of Leading Patents (In Terms of Highest Relative Valuation)
- Table 8.1 At-Home Blood Collection and Micro Sampling Devices: List of Partnerships
- Table 8.2 Partnerships: Information on Focus Area and Therapeutic Area
- Table 9.1 At-Home Blood Collection and Micro Sampling Device Market: Funding and Investments, Since 2013
- Table 9.2 Funding and Investment Analysis: Summary of Investments
- Table 9.3 Funding and Investment Analysis: Summary of Venture Capital Funding
- Table 9.4 At-Home Blood Collection and Micro Sampling Device Market: Information on Purpose of Funding and Area of Application, Since 2013
- Table 14.1 At-Home Blood Collection and Micro Sampling Devices: Distribution by Device Class
- Table 14.2 At-Home Blood Collection and Micro Sampling Devices: Distribution by Current Status of Development
- Table 14.3 At-Home Blood Collection and Micro Sampling Devices: Distribution by Regulatory Approvals / Certifications Received
- Table 14.4 At-Home Blood Collection and Micro Sampling Devices: Distribution by Type of Technology
- Table 14.5 At-Home Blood Collection and Micro Sampling Devices: Distribution by Device Usage
- Table 14.6 At-Home Blood Collection and Micro Sampling Devices: Distribution by Type of Sample
- Table 14.7 At-Home Blood Collection and Micro Sampling Devices: Distribution by Blood Sample State
- Table 14.8 At-Home Blood Collection and Micro Sampling Devices: Distribution by Volume of Sample Collected
- Table 14.9 At-Home Blood Collection and Micro Sampling Devices: Distribution by Puncture Site
- Table 14.10 At-Home Blood Collection and Micro Sampling Devices: Distribution by Method of Sample Collection
- Table 14.11 At-Home Blood Collection and Micro Sampling Devices: Distribution by Storage Temperature
- Table 14.12 At-Home Blood Collection and Micro Sampling Devices: Distribution by Application Area
- Table 14.13 At-Home Blood Collection and Micro Sampling Device Developers: Distribution by Year of Establishment
- Table 14.14 At-Home Blood Collection and Micro Sampling Device Developers: Distribution by Company Size
- Table 14.15 At-Home Blood Collection and Micro Sampling Device Developers: Distribution by Location of Headquarters (Continent-wise)
- Table 14.16 At-Home Blood Collection and Micro Sampling Device Developers: Distribution by Location of Headquarters (Country-wise)
- Table 14.17 At-Home Blood Collection and Micro Sampling Device Developers: Distribution by Year of Establishment, Company Size and Location of Headquarters
- Table 14.18 Most Active Players: Distribution by Number of Products
- Table 14.19 Most Active Players: Distribution by Current Status of Development
- Table 14.20 Patent Analysis: Distribution by Type of Patent
- Table 14.21 Patent Analysis: Cumulative Distribution by Publication Year, Since 2015
- Table 14.22 Patent Analysis: Distribution by Type of Patent and Publication Year
- Table 14.23 Patent Analysis: Distribution by Geography
- Table 14.24 Patent Analysis: North America Scenario
- Table 14.25 Patent Analysis: Asia-Pacific Scenario
- Table 14.26 Most Active Players: Distribution by Number of Patents
- Table 14.27 Patent Analysis: Distribution by Patent Age
- Table 14.28 Overall Intellectual Property Portfolio: Distribution by Type of Organization
- Table 14.29 Partnerships: Cumulative Year-wise Trend, Since 2016
- Table 14.30 Partnerships: Distribution by Type of Partnership
- Table 14.31 Partnerships: Distribution by Year and Type of Partnership
- Table 14.32 Partnerships: Distribution by Focus Area
- Table 14.33 Partnerships: Distribution by Type of Partnership and Focus Area
- Table 14.34 Partnerships: Distribution by Therapeutic Area
- Table 14.35 Partnerships: Continent-wise Distribution
- Table 14.36 Partnerships: Country-wise Distribution
- Table 14.37 Most Active Players: Distribution by Number of Partnerships
- Table 14.38 Funding and Investment Analysis: Cumulative Year-wise Distribution of Number of Instances, Since 2013
- Table 14.39 Funding and Investment Analysis: Cumulative Year-wise Distribution of Amount Invested, Since 2013 (USD Million)
- Table 14.40 Funding and Investment Analysis: Distribution by Type of Funding, Since 2013
- Table 14.41 Funding and Investment Analysis: Distribution of Amount Invested by Type of Funding, Since 2013 (USD Million)
- Table 14.42 Funding and Investment Analysis: Distribution by Year and Type of Funding, Since 2013
- Table 14.43 Funding and Investment Analysis: Summary of Investments, Since 2013 (USD Million)
- Table 14.44 Funding and Investment Analysis: Distribution by Geography
- Table 14.45 Funding and Investment Analysis: Regional Distribution of Funding Instances
- Table 14.46 Most Active Players: Distribution by Number of Funding Instances
- Table 14.47 Most Active Players: Distribution by Amount Invested
- Table 14.48 Funding and Investment Analysis: Distribution by Type of Investor
- Table 14.49 Key Investors: Distribution by Number of Funding Instances
- Table 14.50 Funding and Investment Analysis: Distribution by Purpose of Investment
- Table 14.51 Funding and Investment Analysis: Distribution by Application Area
- Table 14.52 Overall Cost Saving Potential of At-Home Blood Collection and Micro Sampling Devices, Till 2035 (USD Million)
- Table 14.53 Global At-Home Blood Collection and Micro Sampling Device Market, Conservative, Base and Optimistic Scenarios, Till 2031 (USD Million)
- Table 14.54 At-Home Blood Collection and Micro Sampling Device Market: Distribution by Blood Sample State, Till 2035 (USD Million)
- Table 14.55 At-Home Blood Collection and Micro Sampling Device Market for Dried Blood Samples, Conservative, Base and Optimistic Scenarios, Till 2031 (USD Million)
- Table 14.56 At-Home Blood Collection and Micro Sampling Device Market for Liquid Blood Samples, Conservative, Base and Optimistic Scenarios, Till 2031 (USD Million)
- Table 14.57 At-Home Blood Collection and Micro Sampling Device Market: Distribution by Method of Sample Collection, Till 2035 (USD Million)
- Table 14.58 At-Home Blood Collection and Micro Sampling Device Market for Fingerstick Method of Sample Collection, Conservative, Base and Optimistic Scenarios, Till 2031 (USD Million)
- Table 14.59 At-Home Blood Collection and Micro Sampling Device Market for Push-Button Method of Sample Collection, Conservative, Base and Optimistic Scenarios, Till 2031 (USD Million)
- Table 14.60 At-Home Blood Collection and Micro Sampling Device Market: Distribution by Device Usage, Till 2035 (USD Million)
- Table 14.61 At-Home Blood Collection and Micro Sampling Device Market for Single-use Devices, Conservative, Base and Optimistic Scenarios, Till 2031 (USD Million)
- Table 14.62 At-Home Blood Collection and Micro Sampling Device Market for Reusable Devices, Conservative, Base and Optimistic Scenarios, Till 2031 (USD Million)
- Table 14.63 At-Home Blood Collection and Micro Sampling Device Market: Distribution by Areas of Application, Till 2035 (USD Million)
- Table 14.64 At-Home Blood Collection and Micro Sampling Device Market for Diagnostics Purposes, Conservative, Base and Optimistic Scenarios, Till 2031 (USD Million)
- Table 14.65 At-Home Blood Collection and Micro Sampling Device Market for Research Purposes, Conservative, Base and Optimistic Scenarios, Till 2035 (USD Million)
- Table 14.66 At-Home Blood Collection and Micro Sampling Device Market for Therapeutics Purposes, Conservative, Base and Optimistic Scenarios, Till 2035 (USD Million)
- Table 14.67 At-Home Blood Collection and Micro Sampling Device Market for Other Areas of Application, Conservative, Base and Optimistic Scenarios, Till 2035 (USD Million)
- Table 14.68 At-Home Blood Collection and Micro Sampling Device Market: Distribution by Region, Till 2035 (USD Million)
- Table 14.69 At-Home Blood Collection and Micro Sampling Device Market in North America, Conservative, Base and Optimistic Scenarios, Till 2035 (USD Million)
- Table 14.70 At-Home Blood Collection and Micro Sampling Device Market in Europe, Conservative, Base and Optimistic Scenarios, Till 2035 (USD Million)
- Table 14.71 At-Home Blood Collection and Micro Sampling Device Market in Asia-Pacific, Conservative, Base and Optimistic Scenarios, Till 2035 (USD Million)
- Table 14.72 At-Home Blood Collection and Micro Sampling Device Market in Latin America, Conservative, Base and Optimistic Scenarios, Till 2035 (USD Million)
- Table 14.73 At-Home Blood Collection and Micro Sampling Device Market in MENA, Conservative, Base and Optimistic Scenarios, Till 2035 (USD Million)
List of Figures
- Figure 2.1 Executive Summary: Current Market Landscape
- Figure 2.2 Executive Summary: Product Competitiveness Analysis
- Figure 2.3 Executive Summary: Patent Analysis
- Figure 2.4 Executive Summary: Partnerships and Collaborations
- Figure 2.5 Executive Summary: Funding and Investment Analysis
- Figure 2.6 Executive Summary: Cost Saving Analysis
- Figure 2.7 Executive Summary: Market Sizing and Opportunity Analysis
- Figure 3.1 Process of Sampling Dried Blood
- Figure 4.1 At-Home Blood Collection and Micro Sampling Devices: Distribution by Device Class
- Figure 4.2 At-Home Blood Collection and Micro Sampling Devices: Distribution by Current Status of Development
- Figure 4.3 At-Home Blood Collection and Micro Sampling Devices: Distribution by Regulatory Approvals / Certifications Received
- Figure 4.4 At-Home Blood Collection and Micro Sampling Devices: Distribution by Type of Technology
- Figure 4.5 At-Home Blood Collection and Micro Sampling Devices: Distribution by Device Usage
- Figure 4.6 At-Home Blood Collection and Micro Sampling Devices: Distribution by Type of Sample
- Figure 4.7 At-Home Blood Collection and Micro Sampling Devices: Distribution by Blood Sample State
- Figure 4.8 At-Home Blood Collection and Micro Sampling Devices: Distribution by Volume of Sample Collected
- Figure 4.9 At-Home Blood Collection and Micro Sampling Devices: Distribution by Puncture Site
- Figure 4.10 At-Home Blood Collection and Micro Sampling Devices: Distribution by Method of Sample Collection
- Figure 4.11 At-Home Blood Collection and Micro Sampling Devices: Distribution by Storage Temperature
- Figure 4.12 At-Home Blood Collection and Micro Sampling Devices: Distribution by Application Area
- Figure 4.13 At-Home Blood Collection and Micro Sampling Device Developers: Distribution by Year of Establishment
- Figure 4.14 At-Home Blood Collection and Micro Sampling Device Developers: Distribution by Company Size
- Figure 4.15 At-Home Blood Collection and Micro Sampling Device Developers: Distribution by Location of Headquarters (Continent-wise)
- Figure 4.16 At-Home Blood Collection and Micro Sampling Device Developers: Distribution by Location of Headquarters (Country-wise)
- Figure 4.17 At-Home Blood Collection and Micro Sampling Device Developers: Distribution by Year of Establishment, Company Size and Location of Headquarters
- Figure 4.18 Most Active Players: Distribution by Number of Products
- Figure 4.19 Most Active Players: Distribution by Current Status of Development
- Figure 5.1 Product Competitiveness Analysis: North America Scenario
- Figure 5.2 Product Competitiveness Analysis: Europe Scenario
- Figure 5.3 Product Competitiveness Analysis: Asia-Pacific Scenario
- Figure 7.1 Patent Analysis: Distribution by Type of Patent
- Figure 7.2 Patent Analysis: Cumulative Distribution by Publication Year, Since 2015
- Figure 7.3 Patent Analysis: Distribution by Type of Patent and Publication Year
- Figure 7.4 Patent Analysis: Distribution by Geography
- Figure 7.5 Patent Analysis: North America Scenario
- Figure 7.6 Patent Analysis: Asia-Pacific Scenario
- Figure 7.7 Patent Analysis: Distribution by CPC Symbols
- Figure 7.8 Patent Analysis: Distribution by Emerging Focus Area
- Figure 7.9 Most Active Players: Distribution by Number of Patents
- Figure 7.10 Patent Benchmarking Analysis: Your Bio Health and Becton Dickinson
- Figure 7.11 Patent Benchmarking Analysis: Other Leading Players
- Figure 7.12 Patent Portfolio: Distribution by Patent Age
- Figure 7.13 Patent Valuation Analysis
- Figure 7.14 Overall Intellectual Property Portfolio: Distribution by Type of Organization
- Figure 8.1 Partnerships: Cumulative Year-wise Trend, Since 2016
- Figure 8.2 Partnerships: Distribution by Type of Partnership
- Figure 8.3 Partnerships: Distribution by Year and Type of Partnership
- Figure 8.4 Partnerships: Distribution by Focus Area
- Figure 8.5 Partnerships: Distribution by Year of Partnership and Focus Area
- Figure 8.6 Heat Map: Distribution by Type of Partnership and Focus Area
- Figure 8.7 Partnerships: Distribution by Therapeutic Area
- Figure 8.8 Partnerships: Continent-wise Distribution
- Figure 8.9 Partnerships: Intercontinental and Intracontinental Agreements
- Figure 8.10 Partnerships: Country-wise Distribution
- Figure 8.11 Most Active Players: Distribution by Number of Partnerships
- Figure 9.1 Funding and Investment Analysis: Cumulative Year-wise Distribution of Number of Instances, Since 2013
- Figure 9.2 Funding and Investment Analysis: Cumulative Year-wise Distribution of Amount Invested, Since 2013 (USD Million)
- Figure 9.3 Funding and Investment Analysis: Distribution by Type of Funding, Since 2013
- Figure 9.4 Funding and Investment Analysis: Distribution of Amount Invested by Type of Funding, Since 2013 (USD Million)
- Figure 9.5 Funding and Investment Analysis: Distribution by Year and Type of Funding, Since 2013
- Figure 9.6 Funding and Investment Analysis: Distribution by Year, Type of Funding and Amount Invested, Since 2013 (USD Million)
- Figure 9.7 Funding and Investment Analysis: Summary of Investments, Since 2013 (USD Million)
- Figure 9.8 Funding and Investment Analysis: Distribution by Geography
- Figure 9.9 Funding and Investment Analysis: Regional Distribution of Funding Instances
- Figure 9.10 Most Active Players: Distribution by Number of Funding Instances
- Figure 9.11 Most Active Players: Distribution by Amount Invested
- Figure 9.12 Funding and Investment Analysis: Distribution by Type of Investor
- Figure 9.13 Key Investors: Distribution by Number of Funding Instances
- Figure 9.14 Funding and Investment Analysis: Distribution by Purpose of Investment
- Figure 9.15 Funding and Investment Analysis: Distribution by Application Area
- Figure 10.1 Overall Cost Saving Potential of At-Home Blood Collection and Micro Sampling Devices, Till 2035 (USD Million)
- Figure 11.1 Global At-Home Blood Collection and Micro Sampling Device Market, Till 2035 (USD Million)
- Figure 11.2 At-Home Blood Collection and Micro Sampling Device Market: Distribution by Blood Sample State, Till 2035 (USD Million)
- Figure 11.3 At-Home Blood Collection and Micro Sampling Device Market for Dried Blood Samples, Till 2035 (USD Million)
- Figure 11.4 At-Home Blood Collection and Micro Sampling Device Market for Liquid Blood Samples, Till 2035 (USD Million)
- Figure 11.5 At-Home Blood Collection and Micro Sampling Device Market: Distribution by Method of Sample Collection, Till 2035 (USD Million)
- Figure 11.6 At-Home Blood Collection and Micro Sampling Device Market for Fingerstick Method of Sample Collection, Till 2035 (USD Million)
- Figure 11.7 At-Home Blood Collection and Micro Sampling Device Market for Push-Button Method of Sample Collection, Till 2035 (USD Million)
- Figure 11.8 At-Home Blood Collection and Micro Sampling Device Market: Distribution by Device Usage, Till 2035 (USD Million)
- Figure 11.9 At-Home Blood Collection and Micro Sampling Device Market for Single-use Devices, Till 2035 (USD Million)
- Figure 11.10 At-Home Blood Collection and Micro Sampling Device Market for Reusable Devices, Till 2035 (USD Million)
- Figure 11.11 At-Home Blood Collection and Micro Sampling Device Market: Distribution by Areas of Application, Till 2035 (USD Million)
- Figure 11.12 At-Home Blood Collection and Micro Sampling Device Market for Diagnostic Purposes, Till 2035 (USD Million)
- Figure 11.13 At-Home Blood Collection and Micro Sampling Device Market for Research Purposes, Till 2035 (USD Million)
- Figure 11.14 At-Home Blood Collection and Micro Sampling Device Market for Therapeutic Purposes, Till 2035 (USD Million)
- Figure 11.15 At-Home Blood Collection and Micro Sampling Device Market for Other Areas of Application, Till 2035 (USD Million)
- Figure 11.16 At-Home Blood Collection and Micro Sampling Device Market: Distribution by Region, Till 2035 (USD Million)
- Figure 11.17 At-Home Blood Collection and Micro Sampling Device Market in North America, Till 2035 (USD Million)
- Figure 11.18 At-Home Blood Collection and Micro Sampling Device Market in Europe, Till 2035 (USD Million)
- Figure 11.19 At-Home Blood Collection and Micro Sampling Device Market in Asia-Pacific, Till 2035 (USD Million)
- Figure 11.20 At-Home Blood Collection and Micro Sampling Device Market in Latin America, Till 2035 (USD Million)
- Figure 11.21 At-Home Blood Collection and Micro Sampling Device Market in MENA, Till 2035 (USD Million)
- Figure 12.1 Concluding Remarks: Current Market Landscape
- Figure 12.2 Concluding Remarks: Product Competitiveness Analysis
- Figure 12.3 Concluding Remarks: Patent Analysis
- Figure 12.4 Concluding Remarks: Partnerships and Collaborations
- Figure 12.5 Concluding Remarks: Funding and Investment Analysis
- Figure 12.6 Concluding Remarks: Market Sizing and Opportunity Analysis
GLOBAL AT HOME BLOOD COLLECTION DEVICES: OVERVIEW
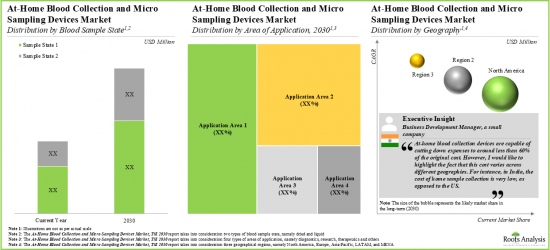
As per Roots Analysis, the global at home blood collection devices valued at USD 747 million in the current year is anticipated to grow at a CAGR of 10.7% during the forecast period.
The market sizing and opportunity analysis has been segmented across the following parameters:
Type of Blood Sample State
- Dried Blood Sample
- Liquid Blood Sample
Method of Sample Collection
- Fingerstick Method
- Push-Button Method
Device Usage
- Single-use Devices
- Reusable Devices
Area of Application
- Diagnostics
- Research
- Therapeutics
- Other Areas of Applications
Key Geographical Regions
- North America
- Europe
- Asia Pacific
- Latin America
- Middle East and North Africa
GLOBAL AT HOME BLOOD COLLECTION DEVICES: GROWTH AND TRENDS
Notably, in the past, approaches used for blood collection were invasive, time consuming and required a healthcare expert. However, in recent years, the methods for blood collection at home have evolved at a rapid pace. In fact, according to a research study, 69% of participants indicated that they would more likely participate in clinical trials if they had the option to provide self-collected samples like self-blood collection. Consequently, the number of at home testing kits have increased in the last few years.
Further, in the COVID-19 era, the demand for point of care treatment had increased to support physical distancing and avoid risk of infections, thus leading to a decline in number of patients visiting laboratories for sample collection and testing. Consequently, it encouraged several stakeholders in the domain to develop novel devices and technologies that can enable patients to collect blood samples remotely at home. With the advancements in molecular detection techniques and a significant reduction in the amount of sample required for testing, miniature devices are transforming diagnostic and monitoring platforms toward point-of-care applications. This technique is well known for capturing minute samples of blood. Moreover, these techniques are more user friendly, as compared to traditional sampling techniques which are highly invasive and may show variation in analysis.
GLOBAL AT HOME BLOOD COLLECTION DEVICES: KEY INSIGHTS
The report delves into the current state of global at home blood collection devices and identifies potential growth opportunities within the industry. Some key findings from the report include:
- Presently, close to 50 at-home blood collection and micro sampling devices are available / being developed; majority of the firms engaged in this domain are startups or small companies located in the US.
- Most of the at-home devices intended for collection of whole capillary blood are presently marketed; DBS technology, used for preparation of dried blood spot cards, has emerged as the most popular platform.
- Recently, TAP(R) II and Tasso-M20 self-blood collecting devices received CE mark approval from the European Commission.
- Examples of companies offering all types of blood samples include (in alphabetical order) DBS System, Neoteryx, Sandstone Diagnostics and Sedia Biosciences.
- In pursuit of gaining a competitive edge, stakeholders are actively expanding their product portfolios and upgrading their devices, via incorporation of advanced features.
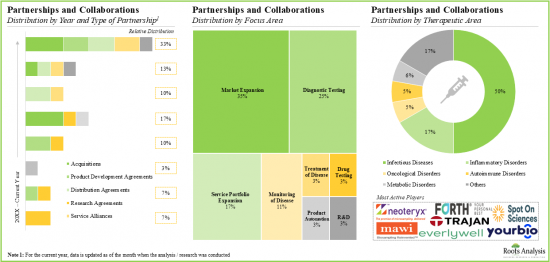
- The growing interest of the stakeholders is also reflected from the recent rise in partnership activity; a significant proportion of the deals inked till date were focused on market expansion.
- Over the years, the intellectual property related to blood collection devices has grown at a commendable pace, with majority of the patents being filed by industry players.
- Number of patents filed / granted in this domain have increased at a CAGR of 11%, with maximum number of patents filed / granted in 2019.
- The high value patents focus on blood sample management, including systems and methods for sample collection, stabilization and preservation.
- Most of the patents were filed / granted in North America; in this region, more than 90% patents were filed by the industry players.
- To support the ongoing innovation in this domain, private and public investors have made substantial capital investments, worth ~USD 650 million, in initiatives undertaken by various industry stakeholders.
- Funding and investment activity in this domain has increased at a CAGR of 12%. A significant proportion of the total investment was made in the last two years.
- In addition to large players, several mid-sized and small companies have raised funds through IPO, venture capitals and other equity.
- Given the favourable increase in adoption of at-home blood collection and micro sampling devices during the COVID-19 pandemic, the market is anticipated to witness significant growth in the foreseen future.
Example Players in the At Home Blood Collection Devices
- EUROIMMUN
- Everlywell
- Labcorp
- Labonovum
- Lameditech
- Quest Diagnostics
- Spot On Sciences
- Tasso
- Weavr Health
- YourBio Health
GLOBAL AT HOME BLOOD COLLECTION DEVICES: RESEARCH COVERAGE
- Market Sizing and Opportunity Analysis: The report features an in-depth analysis of the global antiviral drugs market, focusing on key market segments, including [A] type of blood sample state, [B] method of sample collection, [C] device usage, [D] area of application and [E] key geographical regions.
- Market Landscape: A comprehensive evaluation of at-home self-blood collection and micro sampling devices, considering various parameters, such as [A] device class, [B] current status of development, [C] regulatory approvals / certifications received, [D] type of technology, [E] device usage, [F] type of sample, [G] blood sample state, [H] volume of sample collected, [I] puncture site, [J] method of sample collection, [K] storage temperature and [L] application area. Additionally, a comprehensive evaluation of the companies engaged in the development of at home blood collection and micro sampling devices, considering various parameters, such as [A] year of establishment, [B] company size, [C] location of headquarters and [D] most active players (in terms of number of devices).
- Company Profiles: In-depth profiles of companies engaged in at home blood collection devices market, focusing on [A] company overviews, [B] product portfolio and [C] recent developments and an informed future outlook.
- Product Competitiveness Analysis: A comprehensive competitive analysis of at home blood collection and micro sampling devices, examining factors, such as [A] supplier power and [B] key product-related specifications.
- Patent Analysis: An in-depth analysis of patents filed / granted till date in the at home blood collection devices domain, based on various relevant parameters, such as [A] type of patent, [B] publication year, [C] application year, [D] regional applicability, [E] CPC symbols, [F] emerging focus areas, [G] most active players (in terms of the number of patents filed / granted) and [H] patent valuation.
- Partnerships and Collaborations: An insightful analysis of the deals inked by stakeholders in the global at home blood collection devices market, based on several parameters, such as [A] year of partnership, [B] type of partnership model adopted, [C] focus area, [D] therapeutic area and [E] regional distribution.
- Funding and Investments: An in-depth analysis of the fundings received by players in at home blood collection devices market, based on relevant parameters, such as [A] year of investment, [B] number of funding instances, [C] amount invested, [D] type of funding, [E] most active players (in terms of number of funding instances and amount raised), [F] most active investors (in terms of number of funding instances), [G] geographical distribution, [H] purpose of investment and [I] application area.
- Cost Saving Analysis: A comprehensive analysis of cost saving potential associated with the use of at-home self-blood collection and micro sampling devices examining various factors.
KEY QUESTIONS ANSWERED IN THIS REPORT
- How many companies are currently engaged in this market?
- Which are the leading companies in this market?
- What factors are likely to influence the evolution of this market?
- What is the current and future market size?
- What is the CAGR of this market?
- How is the current and future market opportunity likely to be distributed across key market segments?
REASONS TO BUY THIS REPORT
- The report provides a comprehensive market analysis, offering detailed revenue projections of the overall market and its specific sub-segments. This information is valuable to both established market leaders and emerging entrants.
- Stakeholders can leverage the report to gain a deeper understanding of the competitive dynamics within the market. By analyzing the competitive landscape, businesses can make informed decisions to optimize their market positioning and develop effective go-to-market strategies.
- The report offers stakeholders a comprehensive overview of the market, including key drivers, barriers, opportunities, and challenges. This information empowers stakeholders to stay abreast of market trends and make data-driven decisions to capitalize on growth prospects.
ADDITIONAL BENEFITS
- Complimentary PPT Insights Packs
- Complimentary Excel Data Packs for all Analytical Modules in the Report
- 15% Free Content Customization
- Detailed Report Walkthrough Session with Research Team
- Free Updated report if the report is 6-12 months old or older
TABLE OF CONTENTS
1. PREFACE
- 1.1. Scope of the Report
- 1.2. Research Methodology
- 1.2.1. Research Assumptions
- 1.2.2. Project Methodology
- 1.2.3. Forecast Methodology
- 1.2.4. Robust Quality Control
- 1.2.5. Key Considerations
- 1.2.5.1. Demographics
- 1.2.5.2. Economic Factors
- 1.2.5.3. Government Regulations
- 1.2.5.4. Supply Chain
- 1.2.5.5. COVID Impact / Related Factors
- 1.2.5.6. Market Access
- 1.2.5.7. Healthcare Policies
- 1.2.5.8. Industry Consolidation
- 1.3 Key Questions Answered
- 1.4. Chapter Outlines
2. EXECUTIVE SUMMARY
3. INTRODUCTION
- 3.1. Chapter Overview
- 3.2. Overview of At-Home Blood Collection and Micro Sampling Devices
- 3.3. Applications of Blood Sampling and Testing
- 3.3.1. Complete Blood Count
- 3.3.2. Basic Metabolic Panel
- 3.3.3. Lipoprotein Panel
- 3.4. Types of Blood Sampling
- 3.4.1. Dried Blood Sampling
- 3.4.2. Wet Blood Sampling
- 3.5. Benefits of At-Home Blood Collection
- 3.6. Methods Used for At-Home Blood Collection
- 3.6.1. Fingerstick Method
- 3.6.2. Press Button Method
- 3.6.3. Heel-stick Method
- 3.7. Types of At-Home Blood Collection and Micro Sampling Devices
- 3.7.1. Dried Blood Spot Collection Kits
- 3.7.2. Microtainer Tubes
- 3.8. Future Perspectives
4. MARKET OVERVIEW
- 4.1. Chapter Overview
- 4.2. At-Home Blood Collection and Micro Sampling Devices: Overall Market Landscape
- 4.2.1. Analysis by Device Class
- 4.2.2. Analysis by Current Status of Development
- 4.2.3. Analysis by Regulatory Approvals / Certifications Received
- 4.2.4. Analysis by Type of Technology
- 4.2.5. Analysis by Device Usage
- 4.2.6. Analysis by Type of Sample
- 4.2.7. Analysis by Blood Sample State
- 4.2.8. Analysis by Volume of Sample Collected
- 4.2.9. Analysis by Puncture Site
- 4.2.10. Analysis by Method of Sample Collection
- 4.2.11. Analysis by Storage Temperature
- 4.2.12. Analysis by Application Area
- 4.3. At-Home Blood Collection and Micro Sampling Devices: List of Developers
- 4.3.1. Analysis by Year of Establishment
- 4.3.2. Analysis by Company Size
- 4.3.3. Analysis by Geography
- 4.3.4. Analysis by Year of Establishment, Company Size and Location of Headquarters
- 4.4. Most Active Players: Analysis by Number of Products
5. PRODUCT COMPETITIVENESS ANALYSIS
- 5.1. Chapter Overview
- 5.2. Assumptions and Key Input Parameters
- 5.3. Methodology
- 5.3.1. Product Competitiveness Analysis: North America
- 5.3.2. Product Competitiveness Analysis: Europe
- 5.3.3. Product Competitiveness Analysis: Asia-Pacific
6. COMPANY PROFILES
- 6.1. Chapter Overview
- 6.2. EUROIMMUN
- 6.2.1. Company Overview
- 6.2.2. Product Portfolio
- 6.2.3. Recent Developments and Future Outlook
- 6.3. Everlywell
- 6.3.1. Company Overview
- 6.3.2. Product Portfolio
- 6.3.3. Recent Developments and Future Outlook
- 6.4. Labcorp
- 6.4.1. Company Overview
- 6.4.2. Product Portfolio
- 6.4.3. Recent Developments and Future Outlook
- 6.5. Labonovum
- 6.5.1. Company Overview
- 6.5.2. Product Portfolio
- 6.5.3. Recent Developments and Future Outlook
- 6.6. Lameditech
- 6.6.1. Company Overview
- 6.6.2. Product Portfolio
- 6.6.3. Recent Developments and Future Outlook
- 6.7. Quest Diagnostics
- 6.7.1. Company Overview
- 6.7.2. Product Portfolio
- 6.7.3. Recent Developments and Future Outlook
- 6.8. Spot On Sciences
- 6.8.1. Company Overview
- 6.8.2. Product Portfolio
- 6.8.3. Recent Developments and Future Outlook
- 6.9. Tasso
- 6.9.1. Company Overview
- 6.9.2. Product Portfolio
- 6.9.3. Recent Developments and Future Outlook
- 6.10. Weavr Health
- 6.10.1. Company Overview
- 6.10.2. Product Portfolio
- 6.10.3. Recent Developments and Future Outlook
- 6.11. YourBio Health
- 6.11.1. Company Overview
- 6.11.2. Product Portfolio
- 6.11.3. Recent Developments and Future Outlook
7. PATENT ANALYSIS
- 7.1. Chapter Overview
- 7.2. At-Home Blood Collection and Micro Sampling Devices: Patent Analysis
- 7.2.1. Scope and Methodology
- 7.2.2. Analysis by Publication Year
- 7.2.3. Analysis by Publication Year and Type of Patent
- 7.2.4. Analysis by Geography
- 7.2.5. Analysis by CPC Symbols
- 7.2.6. Analysis by Emerging Focus Area
- 7.2.7. Most Active Players: Analysis by Number of Patents
- 7.2.8. Patent Benchmarking Analysis
- 7.2.9. Patent Valuation Analysis
- 7.2.10. Overall Intellectual Property Portfolio: Analysis by Type of Organization
8. PARTNERSHIPS
- 8.1. Chapter Overview
- 8.2. Partnership Models
- 8.3. At-Home Blood Collection and Micro Sampling Devices: List of Partnerships
- 8.3.1. Analysis by Year of Partnership
- 8.3.2. Analysis by Type of Partnership
- 8.3.3. Analysis by Year and Type of Partnership
- 8.3.4. Analysis by Focus Area
- 8.3.5. Analysis by Year of Partnership and Focus Area
- 8.3.6. Analysis by Type of Partnership and Focus Area
- 8.3.7. Analysis by Therapeutic Area
- 8.3.8. Analysis by Region
- 8.3.8.1. Continent-wise Distribution
- 8.3.8.2. Intercontinental and Intracontinental Distribution
- 8.3.8.3. Country-wise Distribution
- 8.3.9. Most Active Players: Analysis by Number of Partnerships
9. FUNDING AND INVESTMENT ANALYSIS
- 9.1. Chapter Overview
- 9.2. Types of Funding
- 9.3. At-Home Blood Collection and Micro Sampling Devices: Funding and Investment Analysis
- 9.3.1. Analysis of Number of Funding Instances by Year
- 9.3.2. Analysis by Amount Invested
- 9.3.3. Analysis by Type of Funding
- 9.3.4. Analysis by Year and Type of Funding
- 9.3.5. Analysis of Amount Invested by Geography
- 9.3.6. Most Active Players: Analysis by Number of Funding Instances and Amount Invested
- 9.3.7. Key Investors: Analysis by Number of Funding Instances
- 9.3.8. Analysis by Purpose of Investment
- 9.3.9. Analysis by Application Area
- 9.4. Concluding Remarks
10. COST SAVING ANALYSIS
- 10.1. Chapter Overview
- 10.2. Key Assumptions
- 10.3. Methodology
- 10.4. Overall Cost Saving Potential of At-Home Blood Collection and Micro Sampling Devices
- 10.5. Concluding Remarks
11. MARKET FORECAST
- 11.1. Chapter Overview
- 11.2. Forecast Methodology and Assumptions
- 11.3. Global At-Home Blood Collection and Micro Sampling Devices Market, Till 2035
- 11.3.1. At-Home Blood Collection and Micro Sampling Devices Market, Till 2035: Analysis by Blood Sample State
- 11.3.1.1. At-Home Blood Collection and Micro Sampling Devices Market for Dried Blood Samples, Till 2035
- 11.3.1.2. At-Home Blood Collection and Micro Sampling Devices Market for Liquid Blood Samples, Till 2035
- 11.3.2. At-Home Blood Collection and Micro Sampling Devices Market, Till 2035: Analysis by Method of Sample Collection
- 11.3.2.1. At-Home Blood Collection and Micro Sampling Devices Market for Fingerstick Method of Sample Collection, Till 2035
- 11.3.2.2. At-Home Blood Collection and Micro Sampling Devices Market for Push-Button Method of Sample Collection, Till 2035
- 11.3.3. At-Home Blood Collection and Micro Sampling Devices Market, Till 2035: Analysis by Device Usage
- 11.3.3.1. At-Home Blood Collection and Micro Sampling Devices Market for Single-use Devices, Till 2035
- 11.3.3.2. At-Home Blood Collection and Micro Sampling Devices Market for Reusable Devices, Till 2035
- 11.3.4. At-Home Blood Collection and Micro Sampling Devices Market, Till 2035: Analysis by Area of Application
- 11.3.4.1. At-Home Blood Collection and Micro Sampling Device Market for Diagnostics, Till 2035
- 11.3.4.2. At-Home Blood Collection and Micro Sampling Device Market for Research, Till 2035
- 11.3.4.3. At-Home Blood Collection and Micro Sampling Device Market for Therapeutics, Till 2035
- 11.3.4.4. At-Home Blood Collection and Micro Sampling Device Market for Other Areas of Application, Till 2035
- 11.3.5. At-Home Blood Collection and Micro Sampling Devices Market, Till 2035: Analysis by Region
- 11.3.5.1. At-Home Blood Collection and Micro Sampling Devices Market in North America, Till 2035
- 11.3.5.2. At-Home Blood Collection and Micro Sampling Devices Market in Europe, Till 2035
- 11.3.5.3. At-Home Blood Collection and Micro Sampling Devices Market in Asia-Pacific, Till 2035
- 11.3.5.4. At-Home Blood Collection and Micro Sampling Devices Market in Latin America, Till 2035
- 11.3.5.5. At-Home Blood Collection and Micro Sampling Devices Market in MENA, Till 2035
- 11.3.1. At-Home Blood Collection and Micro Sampling Devices Market, Till 2035: Analysis by Blood Sample State
12. CONCLUSION
13. EXECUTIVE INSIGHTS
- 13.1. Chapter Overview
- 13.2. Interview Transcript, Business Development Manager, Company A

