
同種細胞療法市場:細胞療法タイプ別、細胞由来別、標的適応症別、治療領域別、主要地域別
Allogeneic Cell Therapy Market by Type of Cell Therapy, Source of Cell, Target Indication, Therapeutic Area, and Key Geographical Regions- 発行日
- ページ情報
- 英文 222 Pages
- 納期
- 即日から翌営業日
- 商品コード
- 1737047
- カスタマイズ可能 お客様のご希望に応じて、既存データの加工や未掲載情報(例:国別セグメント)の追加などの対応が可能です。詳細はお問い合わせください。
- 翻訳ツール提供対象 PDF対応AI翻訳ツールの無料貸し出しサービスのご利用が可能です
- 医薬品関連専門 医薬品関連専門を専門とする市場調査会社です。
概要
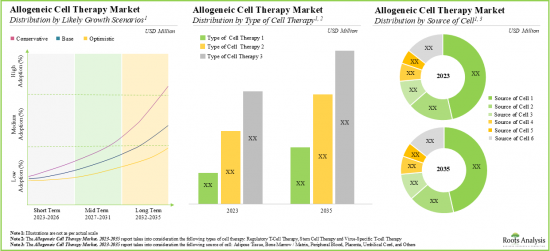
世界の同種細胞療法の市場規模は、2035年までの予測期間中に5.9%のCAGRで拡大し、現在の9億8,000万米ドルから2035年までに27億4,000万米ドルに成長すると予測されています。
市場セグメンテーションでは、市場規模および機会分析を以下のパラメータで区分しています:
細胞治療タイプ別
- 幹細胞
- ウイルス特異的T細胞
- 制御性T細胞
細胞由来別
- 骨髄/マトリックス
- 脂肪組織
- 末梢血
- 臍帯
- 胎盤
- その他
標的適応症別
- 感染症
- 慢性心不全
- クローン病
- 虚血性脳卒中
- 血液がん
- 骨疾患
- 重症虚血肢
- 移植片対宿主病
- デュシェンヌ型筋ジストロフィー
- 表皮水疱症
- 糖尿病性足潰瘍
- その他
治療領域別
- 移植後感染症
- 心血管疾患
- 自己免疫/炎症性疾患
- 脳血管障害
- 腫瘍学的疾患
- 筋骨格系障害
- 神経疾患
- 遺伝性疾患
- その他
地域別
- 北米
- 欧州
- アジア太平洋、その他
同種細胞療法市場:成長と動向
細胞治療とは、損傷した組織を補うため、あるいは直接的な相互作用や因子の発現を通じて細胞の機能を調節するために、患者の体内に人工細胞を投与することを指します。細胞療法はその供給源によって、自家細胞療法(患者自身の身体に由来するもの)と同種細胞療法(健康なドナーに由来するもの)があります。
同種細胞療法は、しばしば"既製の"細胞療法と呼ばれ、患者自身ではなくドナーからの細胞を使用する再生医療の一形態です。これらの細胞は、骨髄、臍帯血、人工多能性幹細胞(iPS細胞)など、さまざまな供給源に由来します。患者自身の細胞を用いる自家細胞療法とは異なり、同種細胞療法にはいくつかの明確な利点があります。同種細胞治療の主な用途のひとつは、がん、自己免疫疾患、変性疾患などの様々な疾患の治療です。実際、Alliance for Regenerative Medicineによると、同種細胞を用いたがん治療の臨床試験数は過去5年間で30%増加しました。さらに、これらの細胞は治療特性を高めるために遺伝子組み換えが可能であり、疾患細胞を標的として破壊したり、組織の修復を促進したりする効果がより高くなることも特筆に値します。
同種細胞療法市場:主要インサイト
当レポートでは、同種細胞療法市場の現状を掘り下げ、同産業における潜在的な成長機会を明らかにしています。当レポートの主な調査結果は以下の通りです:
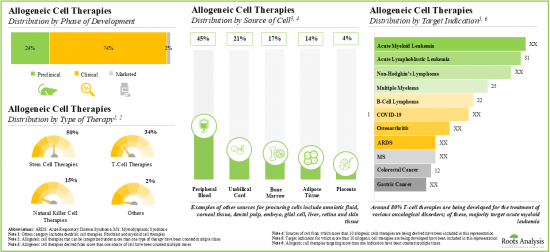
- 480以上の同種細胞療法が190以上の企業別承認または調査中であり、市場情勢には既存企業と新規参入企業の両方が存在します。
- 臨床段階にある同種細胞療法の大半は第II相試験で評価されています。これらの療法は異なる細胞源に由来し、複数の疾患を適応症としています。
- 現在、365以上の臨床試験(登録患者数18,000人以上)が進行中で、様々な地域で同種細胞療法が検討されています。
- この分野に対する利害関係者の関心が高まっていることは、同種細胞治療開発者が国際的・国内的な様々なパートナーと幅広いパートナーシップを結んでいることにも反映されています。
- この分野の機会に気づいた複数の投資家は、過去5年間に約88億米ドル(120の資金調達事例にわたって)を投資しており、その最高額はベンチャーキャピタルラウンドを通じて投資されたものです。
- 学術/医療/商業団体に所属する様々なKOLが、様々な疾患適応における同種細胞治療の効率を評価しています。
- 慢性疾患の罹患率上昇と新規同種細胞療法への需要拡大に牽引され、同市場は2035年までCAGR 5.9%で成長すると予測されています。
- 同種細胞療法の将来機会は、様々な種類の適応症、治療領域、主要な地理的地域に分散していると予測されます。
同種細胞療法市場:主要セグメント
細胞療法タイプ別に、同種細胞療法の世界市場は幹細胞療法、ウイルス特異的T細胞療法、制御性T細胞療法に区分されます。現在、同種細胞療法市場の大半のシェアを幹細胞療法が占めています。今後数年間は、制御性T細胞療法分野のCAGR(~23%)がより高く成長する可能性が高いことは特筆に値します。
細胞由来別では、市場は骨髄/マトリックス、脂肪組織、末梢血、臍帯、胎盤、その他に区分されます。現在、市場は骨髄/マトリックス由来の同種細胞療法が支配的であり、同種細胞療法市場で最も高い割合を占めています。脂肪組織由来療法セグメントの同種細胞療法の世界市場は、相対的に高いCAGRで成長する可能性が高いことは注目に値します。
標的適応症別では、市場は感染症、慢性心不全、クローン病、虚血性脳卒中、血液がん、骨疾患、重症虚血肢、移植片対宿主病、デュシェンヌ型筋ジストロフィー、表皮水疱症、糖尿病性足潰瘍、その他に区分されます。現在のところ、感染症分野が世界の同種細胞療法市場の大半を占めています。注目すべきは、表皮水疱症を適応症とするセグメントは比較的高いCAGRで成長する可能性が高いことです。
治療領域別に見ると、同種細胞治療の世界市場は、移植後感染症、心血管障害、自己免疫/炎症性疾患、脳血管障害、腫瘍性疾患、筋骨格系疾患、神経疾患、遺伝性疾患、その他に分布しています。現在、移植後感染症や心血管疾患に対する同種細胞療法が市場全体を支配しています。しかし、自己免疫疾患/炎症性疾患に使用される細胞療法市場は、相対的に高いCAGRで成長すると思われます。
主要地域別に見ると、市場は北米、欧州、アジア太平洋地域、その他アジア太平洋地域に区分されます。現在のところ、北米が最大の市場シェアを占めています。
同種細胞療法市場の参入企業例
- Artiva Biotherapeutics
- Allogene Therapeutics
- Atara Biotherapeutics
- Cellenkos
- Cell2Cure
- Celularity
- Cellular Biomedicine Group
- CHABiotech
- CRISPR Therapeutics
- Fate Therapeutics
- Fundamenta Therapeutics
- GC Cell
- Hope Biosciences
- Immunity Bio
- Mesoblast
- Nanjing Bioheng Biotech
- Orca Bio
- Pluristem Therapeutics
- Poseida Therapeutics
- Stemedica Cell Technologies
当レポートでは、世界の同種細胞療法市場について調査し、市場の概要とともに、細胞療法タイプ別、細胞由来別、標的適応症別、治療領域別、主要地別の動向、および市場に参入する企業のプロファイルなどを提供しています。
目次
第1章 序文
第1章 同種細胞療法市場概要
第2章 エグゼクティブサマリー
第3章 イントロダクション
- 同種細胞療法の概要
- 同種細胞療法の製造プロセス
- 同種細胞療法の利点
- 同種細胞療法に伴う課題
- 同種細胞治療産業の最近の動向
- 将来の展望
第4章 市場情勢
- 同種細胞療法:市場情勢
- 開発段階別の分析
- 投与経路別の分析
- 細胞治療の種類別の分析
- 細胞源別の分析
- 投与頻度別の分析
- 治療法別の分析
- 対象患者セグメント別の分析
- 対象適応症別の分析
- 治療領域別の分析
- 同種細胞療法:開発情勢
- 設立年別の分析
- 企業規模別の分析
- 本社所在地別の分析
- 最も活発な参入企業:治療数別の分析
第5章 パートナーシップとコラボレーション
- 章の概要
- パートナーシップモデル
- 同種細胞療法:パートナーシップとコラボレーション
第6章 資金調達と投資
- 章の概要
- 資金調達の種類
- 同種細胞療法:資金調達と投資
第7章 臨床試験の分析
- 分析調査手法と主要パラメータ
- 同種細胞療法:臨床試験分析
第8章 主要なオピニオンリーダー
- 調査手法と主要なパラメータ
- 同種細胞療法:キーオピニオンリーダー(KOL)
第9章 市場予測と機会分析
- 章の概要
- 主要な前提と調査手法
- 世界の同種細胞療法市場(2035年まで)
- 同種細胞療法市場:製品別売上予測(2035年まで)
- レバスコール/MPC-150-IM/レキセメストロセル-L
- アロフィセル/ ダルバドストロセル/Cx601
- マルチステム(R)(アサーシス)
- タブセル(R)/ タブセルセル/ATA129
- MDR-101
- PLXパッド
- OMISIRGE/オミドゥビセル-onlv
- オルカT
- リオンシル
- ステムピューセル(R)
- ビラリムM/ALVR105/ポソレウセル
- トリニティエボリューション(R)
- CAP-1002
- オステオセルプラス
- MPC-06-ID/レキセメストロセル-L
- AB-205/E-CEL細胞
- アロ-APZ2-OTS
- トリニティエリート
- CYP-004
- サイトビルCMV T細胞
- カルティステム(R)
- グラフィックス(R)
- エリックスサイト
- テムセル(R)HS
- アロASC-DFU
第10章 エグゼクティブ洞察
第11章 付録I:表形式データ
第12章 付録I1:企業および組織の一覧
図表
List of Tables
- Table 4.1 List of Allogeneic Cell Therapies
- Table 4.2 List of Allogeneic Cell Therapies Developers
- Table 5.1 Allogeneic Cell Therapies: List of Partnerships and Collaborations, Since 2019
- Table 6.1 Allogeneic Cell Therapies: List of Funding and Investments, Since 2019
- Table 7.1. Allogeneic Cell Therapies: List of Clinical Trials, Since 2019
- Table 8.1. Allogeneic Cell Therapies: List of Key Opinion Leaders (KOLs)
- Table 9.1 Allogeneic Cell Therapies: List of Forecasted Therapies
- Table 11.1 Market Landscape: Distribution by Phase of Development
- Table 11.2 Market Landscape: Distribution by Route of Administration
- Table 11.3 Market Landscape: Distribution by Type of Cell Therapy
- Table 11.4 Market Landscape: Distribution by Source of Cell
- Table 11.5 Market Landscape: Distribution by Dosing Frequency
- Table 11.6 Market Landscape: Distribution by Type of Therapy
- Table 11.7 Market Landscape: Distribution by Target Patient Segment
- Table 11.8 Market Landscape: Distribution by Target Indication
- Table 11.9 Market Landscape: Distribution by Therapeutic Area
- Table 11.10 Market Landscape: Distribution by Year of Establishment
- Table 11.11 Market Landscape: Distribution by Company Size
- Table 11.12 Market Landscape: Distribution by Location of Headquarters
- Table 11.13 Market Landscape: Distribution by Number of Therapies
- Table 11.14 Partnerships and Collaborations: Distribution by Year of Partnership, Since 2019
- Table 11.15 Partnerships and Collaborations: Distribution by Type of Partnership
- Table 11.16 Partnerships and Collaborations: Distribution by Year and Type of Partnership
- Table 11.17 Partnerships and Collaborations: Distribution by Type of Cell Therapy
- Table 11.18 Partnerships and Collaborations: Distribution by Therapeutic Area
- Table 11.19 Partnerships and Collaborations: Distribution by Type of Partner
- Table 11.20 Most Active Players: Distribution by Number of Partnerships
- Table 11.21 Partnerships and Collaborations: Intercontinental and Intracontinental Deals
- Table 11.22 Partnerships and Collaborations: Local and International Deals
- Table 11.23 Funding and Investments: Distribution by Year of Investment, Since 2019
- Table 11.24 Funding and Investments: Distribution by Amount Invested (USD Million)
- Table 11.25 Funding and Investments: Distribution by Type of Funding
- Table 11.26 Funding and Investments: Distribution of Amount Invested by Type of Funding (USD Million)
- Table 11.27 Funding and Investments: Distribution of Amount Invested by Year and Type of Funding (USD Million)
- Table 11.28 Funding and Investments: Distribution by Type of Investor
- Table 11.29 Funding and Investments: Distribution by Type of Therapy
- Table 11.30 Funding and Investments: Distribution by Geography (Region-wise)
- Table 11.31 Funding and Investments: Distribution by Geography (Country-wise)
- Table 11.32 Leading Investors: Distribution by Number of Instances
- Table 11.33 Most Active Players: Distribution by Number of Instances
- Table 11.34 Most Active Players: Distribution by Amount Invested (USD Million)
- Table 11.35 Clinical Trial Analysis: Distribution by Trial Registration Year, Since 2019
- Table 11.36 Clinical Trial Analysis: Distribution by Trial Status
- Table 11.37 Clinical Trial Analysis: Distribution by Trial Registration Year and Trial Status
- Table 11.38 Clinical Trial Analysis: Distribution by Trial Registration Year and Patients Enrolled
- Table 11.39 Clinical Trial Analysis: Distribution by Trial Status and Patients Enrolled
- Table 11.40 Clinical Trial Analysis: Distribution by Trial Phase
- Table 11.41 Clinical Trial Analysis: Distribution by Study Design
- Table 11.42 Clinical Trial Analysis: Distribution by Trial Status, Trial Phase and Geography
- Table 11.43 Clinical Trial Analysis: Distribution by Type of Sponsor
- Table 11.44 Most Active Industry Players: Analysis by Number of Trials
- Table 11.45 Most Active Non-Industry Players: Analysis by Number of Trials
- Table 11.46 Clinical Trial Analysis: Distribution by Geography and Trial Status (Number of Trials)
- Table 11.47 Clinical Trial Analysis: Distribution by Geography and Trial Status (Patients Enrolled)
- Table 11.48 Allogeneic Cell Therapies KOL Analysis: Distribution by Type of KOL
- Table 11.49 Allogeneic Cell Therapies KOL Analysis: Distribution by Qualification
- Table 11.50 Allogeneic Cell Therapies KOL Analysis: Distribution by Type of Organization
- Table 11.51 Allogeneic Cell Therapies KOL Analysis: Distribution by Affiliated Organization
- Table 11.52 Allogeneic Cell Therapies KOL Analysis: Distribution by Target Disease Indication
- Table 11.53 Allogeneic Cell Therapies KOL Analysis: Distribution by Geographical Location of KOLs
- Table 11.54 Most Prominent KOLs: Distribution by RA score
- Table 11.55 Global Allogeneic Cell Therapy Market: Conservative, Base and Optimistic Scenarios, Till 2035 (USD Million)
- Table 11.56 Allogeneic Cell Therapy Market: Distribution by Type of Cell Therapy, Till 2035 (USD Million)
- Table 11.57 Allogeneic Cell Therapy Market for Stem Cell Therapies: Conservative, Base and Optimistic Scenarios, Till 2035 (USD Million)
- Table 11.58 Allogeneic Cell Therapies Market for Virus-specific T-cell Therapies: Conservative, Base and Optimistic Scenarios, Till 2035 (USD Million)
- Table 11.59 Allogeneic Cell Therapy Market for Regulatory T-cell Therapies: Conservative, Base and Optimistic Scenarios, Till 2035 (USD Million)
- Table 11.60 Allogeneic Cell Therapy Market: Distribution by Source of Cell, Till 2035 (USD Million)
- Table 11.61 Allogeneic Cell Therapy Market for Bone Marrow / Matrix-derived Therapies: Conservative, Base and Optimistic Scenarios, Till 2035 (USD Million)
- Table 11.62 Allogeneic Cell Therapy Market for Adipose Tissue-derived Therapies: Conservative, Base and Optimistic Scenarios, Till 2035 (USD Million)
- Table 11.63 Allogeneic Cell Therapy Market for Umbilical Cord-derived Therapies: Conservative, Base and Optimistic Scenarios, Till 2035 (USD Million)
- Table 11.64 Allogeneic Cell Therapy Market for Peripheral Blood-derived Therapies: Conservative, Base and Optimistic Scenarios, Till 2035 (USD Million)
- Table 11.65 Allogeneic Cell Therapy Market for Placenta-derived Therapies: Conservative, Base and Optimistic Scenarios, Till 2035 (USD Million)
- Table 11.66 Allogeneic Cell Therapy Market for Others: Conservative, Base and Optimistic Scenarios, Till 2035 (USD Million)
- Table 11.67 Allogeneic Cell Therapy Market: Distribution by Target Indication, Till 2035 (USD Million)
- Table 11.68 Allogeneic Cell Therapy Market for Infectious Disease: Conservative, Base and Optimistic Scenarios, Till 2035 (USD Million)
- Table 11.69 Allogeneic Cell Therapy Market for Chronic Heart Failure: Conservative, Base and Optimistic Scenarios, Till 2035 (USD Million)
- Table 11.70 Allogeneic Cell Therapy Market for Crohn's Disease: Conservative, Base and Optimistic Scenarios, Till 2035 (USD Million)
- Table 11.71 Allogeneic Cell Therapy Market for Ischemic Stroke: Conservative, Base and Optimistic Scenarios, Till 2035 (USD Million)
- Table 11.72 Allogeneic Cell Therapy Market for Hematological Cancer: Conservative, Base and Optimistic Scenarios, Till 2035 (USD Million)
- Table 11.73 Allogeneic Cell Therapy Market for Bone Disease: Conservative, Base and Optimistic Scenarios, Till 2035 (USD Million)
- Table 11.74 Allogeneic Cell Therapy Market for Critical Limb Ischemia: Conservative, Base and Optimistic Scenarios, Till 2035 (USD Million)
- Table 11.75 Allogeneic Cell Therapy Market for Graft versus Host Disease: Conservative, Base and Optimistic Scenarios, Till 2035 (USD Million)
- Table 11.76 Allogeneic Cell Therapy Market for Duchenne Muscular Dystrophy: Conservative, Base and Optimistic Scenarios, Till 2035 (USD Million)
- Table 11.77 Allogeneic Cell Therapy Market for Epidermolysis Bullosa: Conservative, Base 8and Optimistic Scenarios, Till 2035 (USD Million)
- Table 11.78 Allogeneic Cell Therapy Market for Diabetic Foot Ulcer: Conservative, Base and Optimistic Scenarios, Till 2035 (USD Million)
- Table 11.79 Allogeneic Cell Therapy Market for Others: Conservative, Base and Optimistic Scenarios, Till 2035 (USD Million)
- Table 11.80 Allogeneic Cell Therapy Market: Distribution by Therapeutic Area, Till 2035 (USD Million)
- Table 11.81 Allogeneic Cell Therapy Market for Post Transplant Infections: Conservative, Base and Optimistic Scenarios, Till 2035 (USD Million)
- Table 11.82 Allogeneic Cell Therapy Market for Cardiovascular Disorders: Conservative, Base and Optimistic Scenarios, Till 2035 (USD Million)
- Table 11.83 Allogeneic Cell Therapy Market for Autoimmune / Inflammatory Disorders: Conservative, Base and Optimistic Scenarios, Till 2035 (USD Million)
- Table 11.84 Allogeneic Cell Therapy Market for Cerebrovascular Disorders: Conservative, Base and Optimistic Scenarios, Till 2035 (USD Million)
- Table 11.85 Allogeneic Cell Therapy Market for Oncological Disorders: Conservative, Base and Optimistic Scenarios, Till 2035 (USD Million)
- Table 11.86 Allogeneic Cell Therapy Market for Musculoskeletal Disorders: Conservative, Base and Optimistic Scenarios, Till 2035 (USD Million)
- Table 11.87 Allogeneic Cell Therapy Market for Neurological Disorders: Conservative, Base and Optimistic Scenarios, Till 2035 (USD Million)
- Table 11.88 Allogeneic Cell Therapy Market for Genetic Disorders: Conservative, Base and Optimistic Scenarios, Till 2035 (USD Million)
- Table 11.89 Allogeneic Cell Therapy Market for Others: Conservative, Base and Optimistic Scenarios, Till 2035 (USD Million)
- Table 11.90 Allogeneic Cell Therapy Market: Distribution by Key Geographical Regions, Till 2035 (USD Million)
- Table 11.91 Allogeneic Cell Therapy Market in North America: Conservative, Base and Optimistic Scenarios, Till 2035 (USD Million)
- Table 11.92 Allogeneic Cell Therapy Market in the US: Conservative, Base and Optimistic Scenarios, Till 2035 (USD Million)
- Table 11.93 Allogeneic Cell Therapy Market in Canada: Conservative, Base and Optimistic Scenarios, Till 2035 (USD Million)
- Table 11.94 Allogeneic Cell Therapy Market in Europe: Conservative, Base and Optimistic Scenarios, Till 2035 (USD Million)
- Table 11.95 Allogeneic Cell Therapy Market in the UK: Conservative, Base and Optimistic Scenarios, Till 2035 (USD Million)
- Table 11.96 Allogeneic Cell Therapy Market in Germany: Conservative, Base and Optimistic Scenarios, Till 2035 (USD Million)
- Table 11.97 Allogeneic Cell Therapy Market in France: Conservative, Base and Optimistic Scenarios, Till 2035 (USD Million)
- Table 11.98 Allogeneic Cell Therapy Market in Italy: Conservative, Base and Optimistic Scenarios, Till 2035 (USD Million)
- Table 11.99 Allogeneic Cell Therapy Market in Spain: Conservative, Base and Optimistic Scenarios, Till 2035 (USD Million)
- Table 11.100 Allogeneic Cell Therapy Market in Rest of Europe: Conservative, Base and Optimistic Scenarios, Till 2035 (USD Million)
- Table 11.101 Allogeneic Cell Therapy Market in Asia-Pacific and Rest of the World: Conservative, Base and Optimistic Scenarios, Till 2035 (USD Million)
- Table 11.102 Allogeneic Cell Therapy Market in India: Conservative, Base and Optimistic Scenarios, Till 2035 (USD Million)
- Table 11.103 Allogeneic Cell Therapy Market in Australia: Conservative, Base and Optimistic Scenarios, Till 2035 (USD Million)
- Table 11.104 Allogeneic Cell Therapy Market in Taiwan: Conservative, Base and Optimistic Scenarios, Till 2035 (USD Million)
- Table 11.105 Allogeneic Cell Therapy Market in Japan: Conservative, Base and Optimistic Scenarios, Till 2035 (USD Million)
- Table 11.106 Allogeneic Cell Therapy Market in Korea: Conservative, Base and Optimistic Scenarios, Till 2035 (USD Million)
- Table 11.107 Allogeneic Cell Therapy Market in Malaysia: Conservative, Base and Optimistic Scenarios, Till 2035 (USD Million)
- Table 11.108 Allogeneic Cell Therapy Market in Israel: Conservative, Base and Optimistic Scenarios, Till 2035 (USD Million)
- Table 11.109 Revascor / MPC-150-IM / Rexlemestrocel-L (Mesoblast): Sales Forecast, Conservative, Base and Optimistic Scenarios, Till 2035 (USD Million)
- Table 11.110 Alofisel / Darvadstrocel / Cx601 (Takeda): Sales Forecast, Conservative, Base and Optimistic Scenarios, Till 2035 (USD Million)
- Table 11.111 MultiStem(R) (Athersys): Sales Forecast, Conservative, Base and Optimistic Scenarios, Till 2035 (USD Million)
- Table 11.112 Tab-cel(R) / tabelecleucel / ATA129 (Atara Biotherapeutics): Sales Forecast, Conservative, Base and Optimistic Scenarios, Till 2035 (USD Million)
- Table 11.113 MDR-101 (Medeor Therapeutics): Sales Forecast, Conservative, Base and Optimistic Scenarios, Till 2035 (USD Million)
- Table 11.114 PLX-PAD (Pluristem Therapeutics): Sales Forecast, Conservative, Base and Optimistic Scenarios, Till 2035 (USD Million)
- Table 11.115 OMISIRGE / Omidubicel-onlv (Gamida Cell): Sales Forecast, Conservative, Base and Optimistic Scenarios, Till 2035 (USD Million)
- Table 11.116 Orca-T (Orca Bio): Sales Forecast, Conservative, Base and Optimistic Scenarios, Till 2035 (USD Million)
- Table 11.117 Ryoncil (Mesoblast): Sales Forecast, Conservative, Base and Optimistic Scenarios, Till 2035 (USD Million)
- Table 11.118 Stempeucel(R) (Stempeutics Research): Sales Forecast, Conservative, Base and Optimistic Scenarios, Till 2035 (USD Million)
- Table 11.119 Viralym-M / ALVR105 / Posoleucel (Allovir): Sales Forecast, Conservative, Base and Optimistic Scenarios, Till 2035 (USD Million)
- Table 11.120 Trinity Evolution(R) (Orthofix): Sales Forecast, Conservative, Base and Optimistic Scenarios, Till 2035 (USD Million)
- Table 11.121 CAP-1002 (Capricor Therapeutics): Sales Forecast, Conservative, Base and Optimistic Scenarios, Till 2035 (USD Million)
- Table 11.122 Osteocel(R) Plus (NuVasive): Sales Forecast, Conservative, Base and Optimistic Scenarios, Till 2035 (USD Million)
- Table 11.123 MPC-06-ID / Rexlemestrocel-L (Mesoblast): Sales Forecast, Conservative, Base and Optimistic Scenarios, Till 2035 (USD Million)
- Table 11.124 AB-205 / E-CEL cells (Angiocrine Bioscience): Sales Forecast, Conservative, Base and Optimistic Scenarios, Till 2035 (USD Million)
- Table 11.125 allo-APZ2-OTS (RHEACELL): Sales Forecast, Conservative, Base and Optimistic Scenarios, Till 2035 (USD Million)
- Table 11.126 Trinity ELITE (Orthofix): Sales Forecast, Conservative, Base and Optimistic Scenarios, Till 2035 (USD Million)
- Table 11.127 CYP-004 (Cynata Therapeutics): Sales Forecast, Conservative, Base and Optimistic Scenarios, Till 2035 (USD Million)
- Table 11.128 Cytovir CMV T-cells (Kuur Therapeutics): Sales Forecast, Conservative, Base and Optimistic Scenarios, Till 2035 (USD Million)
- Table 11.129 CARTISTEM(R) (Medipost): Sales Forecast, Conservative, Base and Optimistic Scenarios, Till 2035 (USD Million)
- Table 11.130 Grafix(R) (Osiris Therapeutics): Sales Forecast, Conservative, Base and Optimistic Scenarios, Till 2035 (USD Million)
- Table 11.131 ELIXCYTE (UnicoCell Biomed): Sales Forecast, Conservative, Base and Optimistic Scenarios, Till 2035 (USD Million)
- Table 11.132 TEMCELL(R) HS (JCR Pharmaceutical, Mesoblast): Sales Forecast, Conservative, Base and Optimistic Scenarios, Till 2035 (USD Million)
- Table 11.133 ALLO-ASC-DFU (Anterogen): Sales Forecast, Conservative, Base and Optimistic Scenarios, Till 2035 (USD Million)
List of Figures
- Figure 2.1 Executive Summary: Overall Market Landscape
- Figure 2.2 Executive Summary: Partnerships and Collaborations
- Figure 2.3 Executive Summary: Funding and Investment Analysis
- Figure 2.4 Executive Summary: Clinical Trial Analysis
- Figure 2.5 Executive Summary: Key Opinion Leaders
- Figure 2.6 Executive Summary: Market Sizing and Opportunity Analysis
- Figure 3.1 Manufacturing Process of Allogeneic Cell Therapy
- Figure 3.2 Advantages Offered by Allogeneic Cell Therapy
- Figure 3.3 Challenges Associated with Allogeneic Cell Therapy
- Figure 4.1 Allogeneic Cell Therapies: Distribution by Phase of Development
- Figure 4.2 Allogeneic Cell Therapies: Distribution by Route of Administration
- Figure 4.3 Allogeneic Cell Therapies: Distribution by Type of Cell Therapy
- Figure 4.4 Allogeneic Cell Therapies: Distribution by Source of Cell
- Figure 4.5 Allogeneic Cell Therapies: Distribution by Dosing Frequency
- Figure 4.6 Allogeneic Cell Therapies: Distribution by Type of Therapy
- Figure 4.7 Allogeneic Cell Therapies: Distribution by Target Patient Segment
- Figure 4.8 Allogeneic Cell Therapies: Distribution by Target Indication
- Figure 4.9 Allogeneic Cell Therapies: Distribution by Therapeutic Area
- Figure 4.10 Allogeneic Cell Therapies Developers: Distribution by Year of Establishment
- Figure 4.11 Allogeneic Cell Therapies Developers: Distribution by Company Size
- Figure 4.12 Allogeneic Cell Therapies Developers: Distribution by Location of Headquarters
- Figure 4.13 Most Active Players: Distribution by Number of Therapies
- Figure 5.1 Partnerships and Collaborations: Distribution by Year of Partnership, Since 2019
- Figure 5.2 Partnerships and Collaborations: Distribution by Type of Partnership
- Figure 5.3 Partnerships and Collaborations: Distribution by Year and Type of Partnership
- Figure 5.4 Partnerships and Collaborations: Distribution by Type of Cell Therapy
- Figure 5.5 Partnerships and Collaborations: Distribution by Therapeutic Area
- Figure 5.6 Partnerships and Collaborations: Distribution by Type of Partner
- Figure 5.7 Most Active Players: Distribution by Number of Partnerships
- Figure 5.8 Partnerships and Collaborations: Intercontinental and Intracontinental Deals
- Figure 5.9 Partnerships and Collaborations: Local and International Deals
- Figure 6.1 Funding and Investments: Distribution by Year of Investment, Since 2019
- Figure 6.2 Funding and Investments: Distribution by Amount Invested (USD Million)
- Figure 6.3 Funding and Investments: Distribution by Type of Funding
- Figure 6.4 Funding and Investments: Distribution of Amount Invested by Type of Funding (USD Million)
- Figure 6.5 Funding and Investments: Distribution of Amount Invested by Year and Type of Funding (USD Million)
- Figure 6.6 Funding and Investments: Distribution by Type of Investor
- Figure 6.7 Funding and Investments: Distribution by Type of Therapy
- Figure 6.8 Funding and Investments: Distribution by Geography (Region-wise)
- Figure 6.9 Funding and Investments: Distribution by Geography (Country-wise)
- Figure 6.10 Leading Investors: Distribution by Number of Instances
- Figure 6.11 Most Active Players: Distribution by Number of Instances
- Figure 6.12 Most Active Players: Distribution by Amount Invested (USD Million)
- Figure 7.1 Clinical Trial Analysis: Scope and Methodology
- Figure 7.2 Clinical Trial Analysis: Distribution by Trial Registration Year, Since 2019
- Figure 7.3 Clinical Trial Analysis: Distribution by Trial Status
- Figure 7.4 Clinical Trial Analysis: Distribution by Trial Registration Year and Trial Status
- Figure 7.5 Clinical Trial Analysis: Distribution by Trial Registration Year and Patients Enrolled
- Figure 7.6 Clinical Trial Analysis: Distribution by Trial Status and Patients Enrolled
- Figure 7.7 Clinical Trial Analysis: Distribution by Trial Phase
- Figure 7.8 Clinical Trial Analysis: Distribution by Study Design
- Figure 7.9 Clinical Trial Analysis: Distribution by Trial Status, Trial Phase and Geography
- Figure 7.10 Clinical Trial Analysis: Distribution by Type of Sponsor
- Figure 7.11 Most Active Industry Players: Analysis by Number of Trials
- Figure 7.12 Most Active Non-Industry Players: Analysis by Number of Trials
- Figure 7.13 Clinical Trial Analysis: Distribution by Geography and Trial Status (Number of Trials)
- Figure 7.14 Clinical Trial Analysis: Distribution by Geography and Trial Status (Patients Enrolled)
- Figure 8.1 Allogeneic Cell Therapies KOL Analysis: Distribution by Type of KOL
- Figure 8.2 Allogeneic Cell Therapies KOL Analysis: Distribution by Qualification
- Figure 8.3 Allogeneic Cell Therapies KOL Analysis: Distribution by Type of Organization
- Figure 8.4 Allogeneic Cell Therapies KOL Analysis: Distribution by Affiliated Organization
- Figure 8.5 Allogeneic Cell Therapies KOL Analysis: Distribution by Target Disease Indication
- Figure 8.6 Allogeneic Cell Therapies KOL Analysis: Geographical Distribution of KOLs (Region-wise)
- Figure 8.7 Allogeneic Cell Therapies KOL Analysis: Geographical Distribution of KOLs (Country-wise)
- Figure 8.8 Most Prominent KOLs: Peer Group 1 (Principal Investigators)
- Figure 8.9 Most Prominent KOLs: Peer Group 2 (Study Directors)
- Figure 8.10 Most Prominent KOLs: Peer Group 3 (Study Chair)
- Figure 8.11 Most Prominent KOLs: Distribution by RA score
- Figure 9.1 Global Allogeneic Cell Therapy Market, Till 2035 (USD Million)
- Figure 9.2 Allogeneic Cell Therapy Market: Distribution by Type of Cell Therapy, Till 2035 (USD Million)
- Figure 9.3 Allogeneic Cell Therapy Market for Stem Cell Therapies, Till 2035 (USD Million)
- Figure 9.4 Allogeneic Cell Therapy Market for Virus-Specific T-cell Therapies, Till 2035 (USD Million)
- Figure 9.5 Allogeneic Cell Therapy Market for Regulatory T-cell Therapies, Till 2035 (USD Million)
- Figure 9.6 Allogeneic Cell Therapy Market: Distribution by Source of Cell, Till 2035 (USD Million)
- Figure 9.7 Allogeneic Cell Therapy Market for Bone Marrow / Matrix-derived Therapies, Till 2035 (USD Million)
- Figure 9.8 Allogeneic Cell Therapy Market for Adipose Tissue-derived Therapies, Till 2035 (USD Million)
- Figure 9.9 Allogeneic Cell Therapy Market for Peripheral Blood-derived Therapies, Till 2035 (USD Million)
- Figure 9.10 Allogeneic Cell Therapy Market for Umbilical Cord-derived Therapies, Till 2035 (USD Million)
- Figure 9.11 Allogeneic Cell Therapy Market for Placenta-derived Therapies, Till 2035 (USD Million)
- Figure 9.12 Allogeneic Cell Therapy Market for Others, Till 2035 (USD Million)
- Figure 9.13 Allogeneic Cell Therapy Market: Distribution by Target Indication, Till 2035 (USD Million)
- Figure 9.14 Allogeneic Cell Therapy Market for Infectious Disease, Till 2035 (USD Million)
- Figure 9.15 Allogeneic Cell Therapy Market for Chronic Heart Failure, Till 2035 (USD Million)
- Figure 9.16 Allogeneic Cell Therapy Market for Crohn's Disease Till 2035 (USD Million)
- Figure 9.17 Allogeneic Cell Therapy Market for Ischemic Stroke, Till 2035 (USD Million)
- Figure 9.18 Allogeneic Cell Therapy Market for Hematological Cancer, Till 2035 (USD Million)
- Figure 9.19 Allogeneic Cell Therapy Market for Bone Disease, Till 2035 (USD Million)
- Figure 9.20 Allogeneic Cell Therapy Market for Critical Limb Ischemia, Till 2035 (USD Million)
- Figure 9.21 Allogeneic Cell Therapy Market for Graft versus Host Disease, Till 2035 (USD Million)
- Figure 9.22 Allogeneic Cell Therapy Market for Duchenne Muscular Dystrophy, Till 2035 (USD Million)
- Figure 9.23 Allogeneic Cell Therapy Market for Epidermolysis Bullosa, Till 2035 (USD Million)
- Figure 9.24 Allogeneic Cell Therapy Market for Diabetic Foot Ulcer, Till 2035 (USD Million)
- Figure 9.25 Allogeneic Cell Therapy Market for Others, Till 2035 (USD Million)
- Figure 9.26 Allogeneic Cell Therapy Market: Distribution by Therapeutic Area, Till 2035 (USD Million)
- Figure 9.27 Allogeneic Cell Therapy Market for Post-Transplant Infections, Till 2035 (USD Million)
- Figure 9.28 Allogeneic Cell Therapy Market for Cardiovascular Disorders, Till 2035 (USD Million)
- Figure 9.29 Allogeneic Cell Therapy Market for Autoimmune / Inflammatory Disorders Till 2035 (USD Million)
- Figure 9.30 Allogeneic Cell Therapy Market for Cerebrovascular Disorders, Till 2035 (USD Million)
- Figure 9.31 Allogeneic Cell Therapy Market for Oncological Disorders, Till 2035 (USD Million)
- Figure 9.32 Allogeneic Cell Therapy Market for Musculoskeletal Disorders, Till 2035 (USD Million)
- Figure 9.33 Allogeneic Cell Therapy Market for Neurological Disorders, Till 2035 (USD Million)
- Figure 9.34 Allogeneic Cell Therapy Market for Genetic Disorders, Till 2035 (USD Million)
- Figure 9.35 Allogeneic Cell Therapy Market for Others, Till 2035 (USD Million)
- Figure 9.36 Allogeneic Cell Therapy Market: Distribution by Key Geographical Regions, Till 2035 (USD Million)
- Figure 9.37 Allogeneic Cell Therapy Market in North America, Till 2035 (USD Million)
- Figure 9.38 Allogeneic Cell Therapy Market in the US, Till 2035 (USD Million)
- Figure 9.39 Allogeneic Cell Therapy Market in Canada, Till 2035 (USD Million)
- Figure 9.40 Allogeneic Cell Therapy Market in Europe, Till 2035 (USD Million)
- Figure 9.41 Allogeneic Cell Therapy Market in the UK, Till 2035 (USD Million)
- Figure 9.42 Allogeneic Cell Therapy Market in Germany, Till 2035 (USD Million)
- Figure 9.43 Allogeneic Cell Therapy Market in France, Till 2035 (USD Million)
- Figure 9.44 Allogeneic Cell Therapy Market in Spain, Till 2035 (USD Million)
- Figure 9.45 Allogeneic Cell Therapy Market in Italy, Till 2035 (USD Million)
- Figure 9.46 Allogeneic Cell Therapy Market in Rest of Europe, Till 2035 (USD Million)
- Figure 9.47 Allogeneic Cell Therapy Market in Asia-Pacific and Rest of the World, Till 2035 (USD Million)
- Figure 9.48 Allogeneic Cell Therapy Market in India, Till 2035 (USD Million)
- Figure 9.49 Allogeneic Cell Therapy Market in Australia, Till 2035 (USD Million)
- Figure 9.50 Allogeneic Cell Therapy Market in Taiwan, Till 2035 (USD Million)
- Figure 9.51 Allogeneic Cell Therapy Market in Japan, Till 2035 (USD Million)
- Figure 9.52 Allogeneic Cell Therapy Market in Korea, Till 2035 (USD Million)
- Figure 9.53 Allogeneic Cell Therapy Market in Malaysia, Till 2035 (USD Million)
- Figure 9.54 Allogeneic Cell Therapy Market in Israel, Till 2035 (USD Million)
- Figure 9.55 Revascor / MPC-150-IM / Rexlemestrocel-L (Mesoblast): Sales Forecast, Till 2035 (USD Million)
- Figure 9.56 Alofisel / Darvadstrocel / Cx601 (Takeda): Sales Forecast, Till 2035 (USD Million)
- Figure 9.57 MultiStem(R) (Athersys): Sales Forecast, Till 2035 (USD Million)
- Figure 9.58 Tab-cel(R) / tabelecleucel / ATA129 (Atara Biotherapeutics): Sales Forecast, Till 2035 (USD Million)
- Figure 9.59 MDR-101 (Medeor Therapeutics): Sales Forecast, Till 2035 (USD Million)
- Figure 9.60 PLX-PAD (Pluristem Therapeutics): Sales Forecast, Till 2035 (USD Million)
- Figure 9.61 OMISIRGE / Omidubicel-onlv (Gamida Cell): Sales Forecast, Till 2035 (USD Million)
- Figure 9.62 Orca-T (Orca Bio): Sales Forecast, Till 2035 (USD Million)
- Figure 9.63 Ryoncil (Mesoblast): Sales Forecast, Till 2035 (USD Million)
- Figure 9.64 Stempeucel(R) (Stempeutics Research): Sales Forecast, Till 2035 (USD Million)
- Figure 9.65 Viralym-M / ALVR105 / Posoleucel (Allovir): Sales Forecast, Till 2035 (USD Million)
- Figure 9.66 Trinity Evolution(R) (Orthofix): Sales Forecast, Till 2035 (USD Million)
- Figure 9.67 CAP-1002 (Capricor Therapeutics): Sales Forecast, Till 2035 (USD Million)
- Figure 9.68 Osteocel(R) Plus (NuVasive): Sales Forecast, Till 2035 (USD Million)
- Figure 9.69 MPC-06-ID / Rexlemestrocel-L (Mesoblast): Sales Forecast, Till 2035 (USD Million)
- Figure 9.70 AB-205 / E-CEL cells (Angiocrine Bioscience): Sales Forecast, Till 2035 (USD Million)
- Figure 9.71 allo-APZ2-OTS (RHEACELL): Sales Forecast, Till 2035 (USD Million)
- Figure 9.72 Trinity ELITE (Orthofix): Sales Forecast, Till 2035 (USD Million)
- Figure 9.73 CYP-004 (Cynata Therapeutics): Sales Forecast, Till 2035 (USD Million)
- Figure 9.74 Cytovir CMV T-cells (Kuur Therapeutics): Sales Forecast, Till 2035 (USD Million)
- Figure 9.75 CARTISTEM(R) (Medipost): Sales Forecast, Till 2035 (USD Million)
- Figure 9.76 Grafix(R) (Osiris Therapeutics): Sales Forecast, Till 2035 (USD Million)
- Figure 9.77 ELIXCYTE (UnicoCell Biomed): Sales Forecast, Till 2035 (USD Million)
- Figure 9.78 TEMCELL(R) HS (JCR Pharmaceutical / Mesoblast): Sales Forecast, Till 2035 (USD Million)
- Figure 9.79 ALLO-ASC-DFU (Anterogen): Sales Forecast, Till 2035 (USD Million)
目次
ALLOGENEIC CELL THERAPY MARKET: OVERVIEW
As per Roots Analysis, the global allogenic cell therapy market is estimated to grow from USD 0.98 billion in the current year to USD 2.74 billion by 2035, at a CAGR of 5.9% during the forecast period, till 2035.
The market sizing and opportunity analysis has been segmented across the following parameters:
Type of Cell Therapy
- Stem Cell
- Virus-Specific T-Cell
- Regulatory T-Cell
Source of Cell
- Bone Marrow / Matrix
- Adipose Tissue
- Peripheral Blood
- Umbilical Cord
- Placenta
- Others
Target Indication
- Infectious Diseases
- Chronic Heart Failure
- Crohn's Disease
- Ischemic Stroke
- Hematological Cancer
- Bone Diseases
- Critical Limb Ischemia
- Graft versus Host Disease
- Duchenne Muscular Dystrophy
- Epidermolysis Bullosa
- Diabetic Foot Ulcer
- Others
Therapeutic Area
- Post-Transplant Infections
- Cardiovascular Disorders
- Autoimmune / Inflammatory Disorders
- Cerebrovascular Disorders
- Oncological Disorders
- Musculoskeletal Disorders
- Neurological Disorders
- Genetic Disorders
- Others
Key Geographical Regions
- North America
- Europe
- Asia-Pacific and Rest of the World
ALLOGENEIC CELL THERAPY MARKET: GROWTH AND TRENDS
Cell therapy refers to the administration of engineered cells into a patient's body in order to replace the damaged tissues or to modulate the cell functioning through direct interaction or expression of factors. Depending on its source, cell therapies can either be autologous (derived from the patient's own body) or allogeneic (derived from a healthy donor).
Allogenic cell therapy, often referred to as "off-the-shelf" cell therapy, is a form of regenerative medicine that involves the use of cells from a donor, rather than the patient themselves. These cells can be derived from various sources, such as bone marrow, umbilical cord blood, or induced pluripotent stem cells (iPSCs). Unlike autologous cell therapy, where a patient's own cells are used, allogenic cell therapy provides several distinct advantages. One of the key applications of allogeneic cell therapy is in the treatment of various diseases, such as cancer, autoimmune disorders, and degenerative conditions. In fact, according to the Alliance for Regenerative Medicine, the number of clinical trials being conducted for allogeneic cell-based cancer therapies increased by 30% over the past five years. Further, it is worth mentioning that these cells can be genetically modified to enhance their therapeutic properties, making them more effective at targeting and destroying disease cells or promoting tissue repair.
ALLOGENEIC CELL THERAPY MARKET: KEY INSIGHTS
The report delves into the current state of the allogeneic cell therapy market and identifies potential growth opportunities within the industry. Some key findings from the report include:
- Over 480 allogeneic cell therapies are either approved or being investigated in research studies by more than 190 players; the market landscape features the presence of both established players and new entrants.
- The majority of the clinical-stage allogeneic cell therapies are being evaluated in phase II trials; these therapies are being derived from different sources of cells and target multiple disease indications.
- More than 365 clinical trials (with over 18,000 enrolled patients) are currently underway to investigate allogeneic cell therapies across different geographies.
- The rising interest of stakeholders in this domain is reflected in the wide array of partnerships established by allogeneic cell therapy developers with various international and indigenous partners.
- Having realized the opportunity in this segment, several investors have invested around USD 8.8 billion (across 120 funding instances), in the past five years; the maximum amount was invested through venture capital rounds.
- Various KOLs affiliated to academic / medical / commercial organizations are evaluating the efficiency of allogeneic cell therapies in different disease indications.
- Driven by the rising incidence of chronic diseases and growing demand for novel allogeneic cell therapies, this market is anticipated to grow at a CAGR of 5.9%, till 2035.
- The projected future opportunity for allogeneic cell therapies is likely to be well distributed across different types of target indications, therapeutic areas and key geographical regions.
ALLOGENEIC CELL THERAPY MARKET: KEY SEGMENTS
Regulatory T-Cell Therapies is the Fastest Growing Segment of the Allogeneic Cell Therapy Market
Based on the type of cell therapy, the global market for allogeneic cell therapy is segmented into stem cell, virus-specific T cell and regulatory T-cell therapies. Currently, the majority share of the allogeneic cell therapy market is captured by stem cell therapies. It is worth mentioning that the regulatory T-cell therapies segment is likely to grow at a higher CAGR (~ 23%) in the coming years.
By Source of Cell, Bone Marrow / Matrix Segment Dominates the Global Allogeneic Cell Therapy Market
Based on the source of cells, the market is segmented into bone marrow / matrix, adipose tissue, peripheral blood, umbilical cord, placenta and others. Currently, the market is dominated by bone marrow / matrix-derived allogenic cell therapies, capturing the highest proportion of the allogeneic cell therapy market. It is worth highlighting that the global allogeneic cell therapy market for the adipose tissue-derived therapies segment is likely to grow at a relatively higher CAGR.
Infectious Diseases Segment is Likely to Hold the Largest Share of the Allogeneic Cell Therapy Market During the Forecast Period
Based on the target indication, the market is segmented into infectious diseases, chronic heart failure, Crohn's disease, ischemic stroke, hematological cancer, bone disease, critical limb ischemia, graft versus host disease, Duchenne muscular dystrophy, epidermolysis bullosa, diabetic foot ulcer and others. At present, the infectious diseases segment holds the majority share of the global allogeneic cell therapy market. Notably, epidermolysis bullosa target indication segment is likely to grow at a relatively higher CAGR.
By Therapeutic Area, Allogeneic Cell Therapies for Post-Transplant Infections are Likely to Dominate the Market During the Forecast Period
Based on the therapeutic area, the global market for allogeneic cell therapy is distributed across post-transplant infections, cardiovascular disorders, autoimmune / inflammatory disorders, cerebrovascular disorders, oncological disorders, musculoskeletal disorders, neurological disorders, genetic disorders and others. Currently, allogeneic cell therapies for post-transplant infections and cardiovascular disorders dominate the overall market. However, the market for cell therapies used in autoimmune / inflammatory disorders is likely to grow at a relatively higher CAGR.
North America Accounts for the Largest Share of the Market
Based on the key geographical regions, the market is segmented into North America, Europe, and Asia-Pacific and Rest of the World. In the current scenario, North America is likely to capture the largest market share.
Example Players in the Allogeneic Cell Therapy Market
- Artiva Biotherapeutics
- Allogene Therapeutics
- Atara Biotherapeutics
- Cellenkos
- Cell2Cure
- Celularity
- Cellular Biomedicine Group
- CHABiotech
- CRISPR Therapeutics
- Fate Therapeutics
- Fundamenta Therapeutics
- GC Cell
- Hope Biosciences
- Immunity Bio
- Mesoblast
- Nanjing Bioheng Biotech
- Orca Bio
- Pluristem Therapeutics
- Poseida Therapeutics
- Stemedica Cell Technologies
ALLOGENEIC CELL THERAPY MARKET: RESEARCH COVERAGE
- Market Sizing and Opportunity Analysis: The report features an in-depth analysis of the global allogeneic cell therapy market, focusing on key market segments, including [A] type of cell therapy, [B] source of cell, [C] target indication, [D] therapeutic area and [E] key geographical regions.
- Allogeneic Cell Therapies Market Landscape: A comprehensive evaluation of allogeneic cell therapies, based on several relevant parameters, such as [A] year of establishment, [B] company size, [C] location of headquarters, [D] phase of development, [E] route of administration, [F] type of cell therapy, [G] source of cell, [H] dosing frequency, [I] type of therapy, [J] target patient segment, [K] target indication and [L] therapeutic area.
- Partnerships and Collaborations: An insightful analysis of the deals inked by stakeholders in allogeneic cell therapy domain, based on several parameters, such as [A] year of partnership, [B] type of partnership, [C] type of cell therapy, [D] therapeutic area, [E] type of partner, [F] most active players and [G] geographical distribution of partnership activity.
- Funding and Investment Analysis: An in-depth analysis of the fundings raised by companies engaged in this domain, based on relevant parameters, such as [A] year of investment, [B] amount invested, [C] type of funding, [D] type of investor, [E] type of therapy, [F] geographical distribution and [G] most active players.
- Clinical Trial Analysis: An insightful analysis of clinical trials related to allogeneic cell therapies, based on several parameters, such as [A] trial registration year, [B] trial status, [C] trial phase, [D] study design, [E] type of sponsor, [F] geography and [G] most active industry and non-industry players.
- Key Opinion Leaders (KOLs]: An in-depth analysis that emphasizes the key opinion leaders investigating clinical trials related to allogeneic cell therapies, considering various parameters, such as [A] type of KOL, [B] qualification, [C] type of organization, [D] affiliated organization, [E] geographical location of KOLs and [F] target disease indication.
KEY QUESTIONS ANSWERED IN THIS REPORT
- How many companies are currently engaged in this market?
- Which are the leading companies in this market?
- What factors are likely to influence the evolution of this market?
- What is the current and future market size?
- What is the CAGR of this market?
- How is the current and future market opportunity likely to be distributed across key market segments?
REASONS TO BUY THIS REPORT
- The report provides a comprehensive market analysis, offering detailed revenue projections of the overall market and its specific sub-segments. This information is valuable to both established market leaders and emerging entrants.
- Stakeholders can leverage the report to gain a deeper understanding of the competitive dynamics within the market. By analyzing the competitive landscape, businesses can make informed decisions to optimize their market positioning and develop effective go-to-market strategies.
- The report offers stakeholders a comprehensive overview of the market, including key drivers, barriers, opportunities, and challenges. This information empowers stakeholders to stay abreast of market trends and make data-driven decisions to capitalize on growth prospects.
ADDITIONAL BENEFITS
- Complimentary Excel Data Packs for all Analytical Modules in the Report
- 15% Free Content Customization
- Detailed Report Walkthrough Session with Research Team
- Free Updated report if the report is 6-12 months old or older
TABLE OF CONTENTS
1. PREFACE
1.1. Allogeneic Cell Therapy Market Overview
- 1.2. Key Market Insights
- 1.3. Scope of the Report
- 1.4. Research Methodology
- 1.5. Frequently Asked Questions
- 1.6. Chapter Outlines
2. EXECUTIVE SUMMARY
3. INTRODUCTION
- 3.1. Overview of Allogeneic Cell Therapy
- 3.2. Manufacturing Process of Allogeneic Cell Therapy
- 3.3. Advantages Offered by Allogeneic Cell Therapy
- 3.4. Challenges Associated with Allogeneic Cell Therapy
- 3.5. Recent Developments in Allogeneic Cell Therapy Industry
- 3.6. Future Perspectives
4. MARKET LANDSCAPE
- 4.1. Allogeneic Cell Therapies: Market Landscape
- 4.1.1. Analysis by Phase of Development
- 4.1.2. Analysis by Route of Administration
- 4.1.3. Analysis by Type of Cell Therapy
- 4.1.4. Analysis by Source of Cell
- 4.1.5. Analysis by Dosing Frequency
- 4.1.6. Analysis by Type of Therapy
- 4.1.7. Analysis by Target Patient Segment
- 4.1.8. Analysis by Target Indication
- 4.1.9. Analysis by Therapeutic Area
- 4.2. Allogeneic Cell Therapies: Developer Landscape
- 4.2.1. Analysis by Year of Establishment
- 4.2.2. Analysis by Company Size
- 4.2.3. Analysis by Location of Headquarters
- 4.2.4. Most Active Players: Analysis by Number of Therapies
5. PARTNERSHIPS AND COLLABORATIONS
- 5.1. Chapter Overview
- 5.2. Partnership Models
- 5.3. Allogeneic Cell Therapies: Partnerships and Collaborations
- 5.3.1. Analysis by Year of Partnership
- 5.3.2. Analysis by Type of Partnership
- 5.3.3. Analysis by Year and Type of Partnership
- 5.3.4. Analysis by Type of Cell Therapy
- 5.3.5. Analysis by Therapeutic Area
- 5.3.6. Analysis by Type of Partner
- 5.3.7. Most Active Players: Analysis by Number of Partnerships
- 5.3.8. Analysis by Geography
- 5.3.8.1. Intercontinental and Intracontinental Deals
- 5.3.8.2. Local and International Deals
6. FUNDING AND INVESTMENTS
- 6.1. Chapter Overview
- 6.2. Types of Funding
- 6.3. Allogeneic Cell Therapies: Funding and Investments
- 6.3.1. Analysis by Year of Investment
- 6.3.2. Analysis by Amount Invested
- 6.3.3. Analysis by Type of Funding
- 6.3.4. Analysis of Amount Invested by Type of Funding
- 6.3.5. Analysis of Amount Invested by Year and Type of Funding
- 6.3.6. Analysis by Type of Investor
- 6.3.7. Analysis by Type of Therapy
- 6.3.8. Analysis by Geography
- 6.3.9. Leading Investors: Analysis by Number of Instances
- 6.3.10. Most Active Players: Analysis by Number of Instances
- 6.3.11. Most Active Players: Analysis by Amount Invested
7. CLINICAL TRIAL ANALYSIS
- 7.1. Analysis Methodology and Key Parameters
- 7.2. Allogeneic Cell Therapies: Clinical Trial Analysis
- 7.2.1. Analysis by Trial Registration Year
- 7.2.2. Analysis by Trial Status
- 7.2.3. Analysis by Trial Registration Year and Trial Status
- 7.2.4. Analysis by Trial Registration Year and Patients Enrolled
- 7.2.5. Analysis by Trial Status and Patients Enrolled
- 7.2.6. Analysis by Trial Phase
- 7.2.7. Analysis by Study Design
- 7.2.8. Analysis by Trial Status, Trial Phase and Geography
- 7.2.9. Analysis by Type of Sponsor
- 7.2.10. Most Active Industry Players: Analysis by Number of Trials
- 7.2.11. Most Active Non-Industry Players: Analysis by Number of Trials
- 7.2.12. Analysis by Geography
8. KEY OPINION LEADERS
- 8.1. Methodology and Key Parameters
- 8.2. Allogeneic Cell Therapies: Key Opinion Leaders (KOLs)
- 8.2.1. Analysis by Type of KOL
- 8.2.2. Analysis by Qualification
- 8.2.3. Analysis by Type of Organization
- 8.2.4. Analysis by Affiliated Organization
- 8.2.5. Analysis by Target Disease Indication
- 8.2.6. Analysis by Geographical Location of KOLs
- 8.2.7. Most Prominent KOLs: Peer Group 1 (Principal Investigators)
- 8.2.8. Most Prominent KOLs: Peer Group 2 (Study Directors)
- 8.2.9. Most Prominent KOLs: Peer Group 3 (Study Chair)
- 8.2.10. Most Prominent KOLs: Analysis by RA Score
9. MARKET FORECAST AND OPPORTUNITY ANALYSIS
- 9.1. Chapter Overview
- 9.2. Key Assumptions and Methodology
- 9.3. Global Allogeneic Cell Therapy Market, Till 2035
- 9.3.1. Allogeneic Cell Therapy Market: Distribution by Type of Cell Therapy, Till 2035
- 9.3.1.1. Allogeneic Cell Therapy Market for Stem Cell Therapies, Till 2035
- 9.3.1.2. Allogeneic Cell Therapy Market for Virus-specific T-cell Therapies, Till 2035
- 9.3.1.3. Allogeneic Cell Therapy Market for Regulatory T-cell Therapies, Till 2035
- 9.3.2. Allogeneic Cell Therapy Market: Distribution by Source of Cell, Till 2035
- 9.3.2.1. Allogeneic Cell Therapy Market for Bone Marrow / Matrix-derived Therapies, Till 2035
- 9.3.2.2. Allogeneic Cell Therapy Market for Adipose Tissue-derived Therapies, Till 2035
- 9.3.2.3. Allogeneic Cell Therapy Market for Peripheral Blood-derived Therapies, Till 2035
- 9.3.2.4. Allogeneic Cell Therapy Market for Umbilical Cord-derived Therapies, Till 2035
- 9.3.2.5. Allogeneic Cell Therapy Market for Placenta-derived Therapies, Till 2035
- 9.3.2.6. Allogeneic Cell Therapy Market for Others, Till 2035
- 9.3.3. Allogeneic Cell Therapy Market: Distribution by Target Indication, Till 2035
- 9.3.3.1. Allogeneic Cell Therapy Market for Infectious Disease, Till 2035
- 9.3.3.2. Allogeneic Cell Therapy Market for Chronic Heart Failure, Till 2035
- 9.3.3.3. Allogeneic Cell Therapy Market for Crohn's Disease Till 2035
- 9.3.3.4. Allogeneic Cell Therapy Market for Ischemic Stroke, Till 2035
- 9.3.3.5. Allogeneic Cell Therapy Market for Hematological Cancer, Till 2035
- 9.3.3.6. Allogeneic Cell Therapy Market for Bone Diseases Till 2035
- 9.3.3.7. Allogeneic Cell Therapy Market for Critical Limb Ischemia, Till 2035
- 9.3.3.8. Allogeneic Cell Therapy Market for Graft versus Host Disease, Till 2035
- 9.3.3.9. Allogeneic Cell Therapy Market for Duchenne Muscular Dystrophy, Till 2035
- 9.3.3.10. Allogeneic Cell Therapy Market for Epidermolysis Bullosa, Till 2035
- 9.3.3.11. Allogeneic Cell Therapy Market for Diabetic Foot Ulcer, Till 2035
- 9.3.3.12. Allogeneic Cell Therapy Market for Others, Till 2035
- 9.3.4. Allogeneic Cell Therapy Market: Distribution by Therapeutic Area, Till 2035
- 9.3.4.1. Allogeneic Cell Therapy Market for Post-Transplant Infections, Till 2035
- 9.3.4.2. Allogeneic Cell Therapy Market for Cardiovascular Disorders, Till 2035
- 9.3.4.3. Allogeneic Cell Therapy Market for Autoimmune / Inflammatory Disorders, Till 2035
- 9.3.4.4. Allogeneic Cell Therapy Market for Cerebrovascular Disorders, Till 2035
- 9.3.4.5. Allogeneic Cell Therapy Market for Oncological Disorders, Till 2035
- 9.3.4.6. Allogeneic Cell Therapy Market for Musculoskeletal Disorders, Till 2035
- 9.3.4.7. Allogeneic Cell Therapy Market for Neurological Disorders, Till 2035
- 9.3.4.8. Allogeneic Cell Therapy Market for Genetic Disorders, Till 2035
- 9.3.4.9. Allogeneic Cell Therapy Market for Others, Till 2035
- 9.3.5. Allogeneic Cell Therapy Market: Distribution by Key Geographical Regions, Till 2035
- 9.3.5.1. Allogeneic Cell Therapy Market in North America, Till 2035
- 9.3.5.1.1. Allogeneic Cell Therapy Market in the US, Till 2035
- 9.3.5.1.2. Allogeneic Cell Therapy Market in Canada, Till 2035
- 9.3.5.2. Allogeneic Cell Therapy Market in Europe, Till 2035
- 9.3.5.2.1. Allogeneic Cell Therapy Market in the UK, Till 2035
- 9.3.5.2.2. Allogeneic Cell Therapy Market in Germany, Till 2035
- 9.3.5.2.3. Allogeneic Cell Therapy Market in France, Till 2035
- 9.3.5.2.4. Allogeneic Cell Therapy Market in Italy, Till 2035
- 9.3.5.2.5. Allogeneic Cell Therapy Market in Spain, Till 2035
- 9.3.5.2.6. Allogeneic Cell Therapy Market in Rest of Europe, Till 2035
- 9.3.5.3. Allogeneic Cell Therapy Market in Asia-Pacific and Rest of the World, Till 2035
- 9.3.5.3.1. Allogeneic Cell Therapy Market in India, Till 2035
- 9.3.5.3.2. Allogeneic Cell Therapy Market in Australia, Till 2035
- 9.3.5.3.3. Allogeneic Cell Therapy Market in Taiwan, Till 2035
- 9.3.5.3.4. Allogeneic Cell Therapy Market in Japan, Till 2035
- 9.3.5.3.5. Allogeneic Cell Therapy Market in Korea, Till 2035
- 9.3.5.3.6. Allogeneic Cell Therapy Market in Malaysia, Till 2035
- 9.3.5.3.7. Allogeneic Cell Therapy Market in Israel, Till 2035
- 9.3.5.1. Allogeneic Cell Therapy Market in North America, Till 2035
- 9.3.1. Allogeneic Cell Therapy Market: Distribution by Type of Cell Therapy, Till 2035
- 9.4. Allogeneic Cell Therapy Market: Product-wise Sales Forecast, Till 2035
- 9.4.1. Revascor / MPC-150-IM / Rexlemestrocel-L
- 9.4.1.1. Sales Forecast (USD Million)
- 9.4.1.2. Net Present Value
- 9.4.1.3. Value Creation Analysis
- 9.4.2. Alofisel / Darvadstrocel / Cx601
- 9.4.2.1. Sales Forecast (USD Million)
- 9.4.2.2. Net Present Value
- 9.4.2.3. Value Creation Analysis
- 9.4.3. MultiStem(R) (Athersys)
- 9.4.3.1. Sales Forecast (USD Million)
- 9.4.3.2. Net Present Value
- 9.4.3.3. Value Creation Analysis
- 9.4.4. Tab-cel(R) / tabelecleucel / ATA129
- 9.4.4.1. Sales Forecast (USD Million)
- 9.4.4.2. Net Present Value
- 9.4.4.3. Value Creation Analysis
- 9.4.5. MDR-101
- 9.4.5.1. Sales Forecast (USD Million)
- 9.4.5.2. Net Present Value
- 9.4.5.3. Value Creation Analysis
- 9.4.6. PLX-PAD
- 9.4.6.1. Sales Forecast (USD Million)
- 9.4.6.2. Net Present Value
- 9.4.6.3. Value Creation Analysis
- 9.4.7. OMISIRGE / Omidubicel-onlv
- 9.4.7.1. Sales Forecast (USD Million)
- 9.4.7.2. Net Present Value
- 9.4.7.3. Value Creation Analysis
- 9.4.8. Orca-T
- 9.4.8.1. Sales Forecast (USD Million)
- 9.4.8.2. Net Present Value
- 9.4.8.3. Value Creation Analysis
- 9.4.9. Ryoncil
- 9.4.9.1. Sales Forecast (USD Million)
- 9.4.9.2. Net Present Value
- 9.4.9.3. Value Creation Analysis
- 9.4.10. Stempeucel(R)
- 9.4.10.1. Sales Forecast (USD Million)
- 9.4.10.2. Net Present Value
- 9.4.10.3. Value Creation Analysis
- 9.4.11. Viralym-M / ALVR105 / Posoleucel
- 9.4.11.1. Sales Forecast (USD Million)
- 9.4.11.2. Net Present Value
- 9.4.11.3. Value Creation Analysis
- 9.4.12. Trinity Evolution(R)
- 9.4.12.1. Sales Forecast (USD Million)
- 9.4.12.2. Net Present Value
- 9.4.12.3. Value Creation Analysis
- 9.4.13. CAP-1002
- 9.4.13.1. Sales Forecast (USD Million)
- 9.4.13.2. Net Present Value
- 9.4.13.3. Value Creation Analysis
- 9.4.14. Osteocel(R) Plus
- 9.4.14.1. Sales Forecast (USD Million)
- 9.4.14.2. Net Present Value
- 9.4.14.3. Value Creation Analysis
- 9.4.15. MPC-06-ID / Rexlemestrocel-L
- 9.4.15.1. Sales Forecast (USD Million)
- 9.4.15.2. Net Present Value
- 9.4.15.3. Value Creation Analysis
- 9.4.16. AB-205 / E-CEL cells
- 9.4.16.1. Sales Forecast (USD Million)
- 9.4.16.2. Net Present Value
- 9.4.16.3. Value Creation Analysis
- 9.4.17. allo-APZ2-OTS
- 9.4.17.1. Sales Forecast (USD Million)
- 9.4.17.2. Net Present Value
- 9.4.17.3. Value Creation Analysis
- 9.4.18. Trinity ELITE
- 9.4.18.1. Sales Forecast (USD Million)
- 9.4.18.2. Net Present Value
- 9.4.18.3. Value Creation Analysis
- 9.4.19. CYP-004
- 9.4.19.1. Sales Forecast (USD Million)
- 9.4.19.2. Net Present Value
- 9.4.19.3. Value Creation Analysis
- 9.4.20. Cytovir CMV T-cells
- 9.4.20.1. Sales Forecast (USD Million)
- 9.4.20.2. Net Present Value
- 9.4.20.3. Value Creation Analysis
- 9.4.21. CARTISTEM(R)
- 9.4.21.1. Sales Forecast (USD Million)
- 9.4.21.2. Net Present Value
- 9.4.21.3. Value Creation Analysis
- 9.4.22. Grafix(R)
- 9.4.22.1. Sales Forecast (USD Million)
- 9.4.22.2. Net Present Value
- 9.4.22.3. Value Creation Analysis
- 9.4.23. ELIXCYTE
- 9.4.23.1. Sales Forecast (USD Million)
- 9.4.23.2. Net Present Value
- 9.4.23.3. Value Creation Analysis
- 9.4.24. TEMCELL(R) HS
- 9.4.24.1. Sales Forecast (USD Million)
- 9.4.24.2. Net Present Value
- 9.4.24.3. Value Creation Analysis
- 9.4.25. ALLO-ASC-DFU
- 9.4.25.1. Sales Forecast (USD Million)
- 9.4.25.2. Net Present Value
- 9.4.25.3. Value Creation Analysis
- 9.4.1. Revascor / MPC-150-IM / Rexlemestrocel-L
10. EXECUTIVE INSIGHTS
- 10.1. Chapter Overview
- 10.2. Glycostem Therapeutics
- 10.2.1. Company Snapshot
- 10.2.2. Interview Transcript: Troels Jordansen (Chief Executive Officer)
- 10.3. Mesoblast
- 10.3.1. Company Snapshot
- 10.3.2. Interview Transcript: Eric Rose (Chief Medical Officer)
- 10.4. Triumvira Immunologics
- 10.4.1. Company Snapshot
- 10.4.2. Interview Transcript: Andreas Bader (Chief Scientific Officer)
- 10.5. Celyad Oncology
- 10.5.1. Company Snapshot
- 10.5.2. Interview Transcript: Vincent Brichard (Vice President)
11. APPENDIX I: TABULATED DATA
12. APPENDIX I1: LIST OF COMPANIES AND ORGANIZATIONS
- 発行日
- 発行
- Roots Analysis
- ページ情報
- 英文 222 Pages
- 納期
- 即日から翌営業日


