
光トランシーバーの世界市場(~2035年):フォームファクター別、データレート別、プロトコル別、波長別、ファイバー別、コネクター別、エンドユーザー別、主要地域別:産業動向と予測
Optical Transceiver Market, Till 2035: Distribution by Type of Form Factor, Type of Data Rate, Type of Protocol, Type of Wavelength, Type of Fiber, Type of Connector, End User and Key Geographical Regions: Industry Trends and Global Forecasts- 発行日
- ページ情報
- 英文 197 Pages
- 納期
- 7~10営業日
- 商品コード
- 1721369
- カスタマイズ可能 お客様のご希望に応じて、既存データの加工や未掲載情報(例:国別セグメント)の追加などの対応が可能です。詳細はお問い合わせください。
- 翻訳ツール提供対象 PDF対応AI翻訳ツールの無料貸し出しサービスのご利用が可能です
- 医薬品関連専門 医薬品関連専門を専門とする市場調査会社です。
概要
光トランシーバー市場の概要
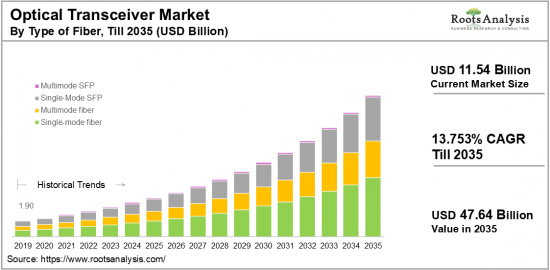
世界の光トランシーバーの市場規模は、現在の115億4,000万米ドルから2035年までに476億4,000万米ドルに達すると予測され、2035年までの予測期間にCAGRで13.75%の成長が見込まれます。
光トランシーバー市場:成長と動向
光トランシーバー部門は、高速インターネット、データセンター、5G技術の登場に対するニーズの高まりに後押しされ、大幅な成長を示しています。AIのようなシステムの開発に伴い、光トランシーバーの需要はこの市場の急拡大に大きく寄与しています。さらに、スマートフォン、タブレットなどのコネクテッドデバイスの普及により、データトラフィックが劇的に急増し、より信頼性の高いネットワークインフラが必要とされています。
技術の急速な進歩は、継続的な技術革新と柔軟性を要求し、新企業が市場参入するのに十分な機会を生み出しています。さらに、通信などの産業をリードするさまざまな企業は、接続性の向上と効率的なパフォーマンスを顧客に提供することに意欲的であり、結果として既存技術のアップグレードの継続的なニーズが生まれています。これには、ネットワーク、エッジコンピューティング、ネットワークインフラ全体の強化が含まれます。5G技術の台頭によって促進された需要の増加は、市場成長をさらに促進しています。
光トランシーバーは、特にデータセンターなどの大容量データ伝送ネットワークに不可欠です。時代が進むにつれて、これらのトランシーバーは現代のネットワークの複雑性によってますます複雑になっています。現代のネットワークにおける高いデータレートの追求は、1G~400Gの速度でデータを伝送できる光トランシーバーの開発につながっています。このような高いデータレートに到達するには、信頼性が高く効率的なデータ伝送を保証する革新的な設計と技術が必要です。この急速な拡大は、産業の新規参入企業に大きな機会を生み出しており、今後数十年にわたって市場成長率を何十億単位で押し上げると予測されています。
COVID-19パンデミックとリモートワークへのシフトが、強化されたネットワーク機能への需要を高めています。オンラインストリーミングはロックダウン期間にかつてないほど増加しました。さらに、労働者はリモートワーク環境を構築しなければならず、その結果、高速インターネットと接続性へのニーズが高まっています。これらすべての要因が光トランシーバー市場の成長を加速させました。需要の高まりと数多くの機会を前に、光トランシーバー市場は予測期間に大きく成長する見込みです。
当レポートでは、世界の光トランシーバー市場について調査し、市場規模の推計と機会の分析、競合情勢、企業プロファイル、SWOT分析などを提供しています。
目次
第1章 序文
第2章 調査手法
第3章 経済的考慮事項、その他のプロジェクト特有の考慮事項
第4章 マクロ経済指標
第5章 エグゼクティブサマリー
第6章 イントロダクション
第7章 競合情勢
第8章 企業プロファイル
- 章の概要
- Accelink Technologies
- Amphenol
- Applied Optoelectronics
- Arista Networks
- ATOP
- Broadcom
- CBO GmbH
- Ciena
- Fabrinet
- Firecomms
- NEC
- NVIDIA
- ZTE
第9章 バリューチェーン分析
第10章 SWOT分析
第11章 光トランシーバー市場
第12章 市場機会:フォームファクター別
第13章 市場機会:データレート別
第14章 市場機会:プロトコル別
第15章 市場機会:波長別
第16章 市場機会:ファイバー別
第17章 市場機会:コネクター別
第18章 市場機会:範囲別
第19章 市場機会:応用分野別
第20章 市場機会:企業規模別
第21章 市場機会:エンドユーザー別
第22章 市場機会:ビジネスモデル別
第23章 北米の光トランシーバー市場の機会
第24章 欧州の光トランシーバー市場の機会
第25章 アジアの光トランシーバー市場の機会
第26章 中東・北アフリカ(MENA)の光トランシーバー市場の機会
第27章 ラテンアメリカの光トランシーバー市場の機会
第28章 その他の地域の光トランシーバー市場の機会
第29章 表形式データ
第30章 企業・団体のリスト
第31章 カスタマイズの機会
第32章 Rootsのサブスクリプションサービス
第33章 著者詳細
目次
Optical Transceiver Market Overview
As per Roots Analysis, the global optical transceiver market size is estimated to grow from USD 11.54 billion in the current year to USD 47.64 billion by 2035, at a CAGR of 13.75% during the forecast period, till 2035.
The opportunity for optical transceiver market has been distributed across the following segments:
Type of Form Factor
- CFP (C Form-factor Pluggable)
- QSFP (Quad Small Form-factor Pluggable)
- QSFP+
- QSFP28
- SFP (Small Form-factor Pluggable)
- SFP+ (Enhanced Small Form-factor Pluggable)
- XFP (10 Gigabit Small Form-factor Pluggable)
Type of Data Rate
- Less than 10 Gbps
- 10 Gbps to 40 Gbps
- 100 Gbps
- Greater than 100 Gbps
Type of Protocol
- CWDM/DWDM
- Ethernet
- FTTx
- Fiber Channel
- Other Protocols
Type of Wavelength
- 850 nm
- 1310 nm
- 1550 nm
- Others
Type of Fiber
- Single-mode fiber
- Multimode fiber
- Single-Mode SFP
- Multimode SFP
Type of Connector
- LC
- MPO
- RJ-45
- SC
Distance as per Range
- Extended Range (ER)
- Long-Range (LR)
- Short-Range (SR)
- Others
Area of Application
- 5G Networks
- Cloud Computing
- Content Delivery Networks
- Internet Service Providers
- Medical Facilities
- Research
- Telecommunications
- Television Networks
- Others
Company Size
- Large Enterprises
- Small and Medium-sized Enterprises (SMEs)
End User
- Automotive
- Data Centers
- Enterprises
- Healthcare
- Industrial
- IT
- Telecommunications
Business Model
- B2B
- B2C
- B2B2C
Geographical Regions
- North America
- US
- Canada
- Mexico
- Other North American countries
- Europe
- Austria
- Belgium
- Denmark
- France
- Germany
- Ireland
- Italy
- Netherlands
- Norway
- Russia
- Spain
- Sweden
- Switzerland
- UK
- Other European countries
- Asia
- China
- India
- Japan
- Singapore
- South Korea
- Other Asian countries
- Latin America
- Brazil
- Chile
- Colombia
- Venezuela
- Other Latin American countries
- Middle East and North Africa
- Egypt
- Iran
- Iraq
- Israel
- Kuwait
- Saudi Arabia
- UAE
- Other MENA countries
- Rest of the World
- Australia
- New Zealand
- Other countries
OPTICAL TRANSCEIVER MARKET: GROWTH AND TRENDS
The optical transceiver sector is witnessing substantial growth, propelled by the rising need for high-speed internet, data centers, and the emergence of 5G technology. With the development of systems like artificial intelligence, the demand for optical transceivers is significantly contributing to the rapid expansion of this market. Additionally, the widespread adoption of smartphones, tablets, and other connected devices has resulted in a dramatic surge in data traffic, necessitating a more dependable network infrastructure.
The swift advancement of technology demands ongoing innovation and flexibility, creating ample opportunities for new companies to enter the market. Furthermore, various leading players in industries such as telecommunications are eager to offer improved connectivity and efficient performance to their clients, resulting in a continuous need to upgrade existing technologies. This encompasses enhancements in networks, edge computing, and the overall network infrastructure. The growing demand spurred by the rise of 5G technology is further driving market growth.
Optical transceivers are vital for high-capacity data transmission networks, particularly in data centers. As time has progressed, these transceivers have become increasingly complex due to the intricacies of modern networks. The pursuit of high data rates in contemporary networks has led to the development of optical transceivers capable of transmitting data at speeds ranging from 1G to 400G. Reaching these elevated data rates requires innovative designs and technologies to ensure reliable and efficient data transmission. This rapid expansion is creating significant opportunities for newcomers in the industry and is anticipated to boost the market growth rate by billions over the next few decades.
The COVID-19 pandemic and the shift to remote work have elevated the demand for enhanced networking capabilities. There was an unprecedented increase in online streaming during the lockdown period. Additionally, professionals had to establish remote work environments, which resulted in a growing need for high-speed internet and connectivity. All these factors have accelerated the growth of the optical transceiver market. With a rising demand and numerous opportunities ahead, the optical transceivers market is expected to grow significantly during the forecast period.
OPTICAL TRANSCEIVER MARKET: KEY SEGMENTS
Market Share by Type of Form Factor
Based on the type of form factor, the global optical transceiver market is segmented into SFP (Small Form-factor Pluggable), SFP+ (Enhanced Small Form-factor Pluggable), QSFP (Quad Small Form-factor Pluggable), QSFP+, and others. According to our estimates, currently, SFP+ and QSFP+ segment captures the majority share of the market, owing to their application in high-performance computing, data centers, and telecommunication infrastructures. As the demand for 10 Gigabit Ethernet and 8G fiber channel rises, along with the growth of data centers, enterprise networks, and telecommunication facilities, the form factor market is consistently expanding and is expected to grow significantly in the near future.
Market Share by Type of Data Rate
Based on type of data rate, the optical transceiver market is segmented into data rate less than 10 Gbps, 10 Gbps to 40 Gbps, 100 Gbps, and data rate greater than 100 Gbps. According to our estimates, currently, 10 Gbps to 40 Gbps data rate segment captures the majority share of the market, owing to its prevalent usage in enterprise networks, data centers, and metropolitan area networks (MANs). Additionally, this category supports both 10 Gigabit Ethernet and 40 Gigabit Ethernet connections, which significantly contributes to the growth of the optical transceiver market. The development of telecommunications, cloud computing, and enterprise networks is enhancing the overall data rate market, with the demand for quicker and more dependable data transmission serving as the primary driver for the ongoing evolution of the optical transceiver sector.
Market Share by Type of Protocol
Based on type of protocol, the optical transceiver market is segmented into ethernet, fiber channel, CWDM / DWDM, FTTx, and other protocols comprising of specific set of rules and conventions for data communication. According to our estimates, currently, ethernet and fiber channel segment captures the majority share of the market. This can be attributed to multiple advantages, including ethernet being the most prevalent networking technology for both wide area networks (WAN) and local area networks (LAN), playing a vital role in high-speed data transmission. Ethernet optical transceivers find application in numerous settings, such as data centers, enterprise networks, and carrier networks. Further, there has been a notable increase in market activity due to the substantial demand for fiber channels, which have seen widespread adoption across various industries. The necessity for fast, dependable, and scalable network solutions propels the growth and advancement of these protocols in the optical transceiver sector.
Market Share by Type of Wavelength
Based on type of wavelength, the optical transceiver market is segmented into 850 nm, 1310 nm, 1550 nm, and others. According to our estimates, currently, 1310 nm bandwidth segment captures the majority share of the market. This can be attributed to several factors, including low scattering levels, elevated data transmission rates, improved security and precision.
Additionally, the 1310 nm bandwidth can operate efficiently at higher temperatures and offers better effectiveness in terms of cost and energy use. Each wavelength meets different needs and applications, enabling the optical transceiver market to fulfill a broad spectrum of requirements ranging from short-range data center links to long-distance telecommunications, resulting in significant demand and considerable growth in the optical transceiver market.
Market Share by Type of Fiber
Based on type of fiber, the optical transceiver market is segmented into single-mode fiber, multimode fiber, single-mode SFP, and multimode SFP. According to our estimates, currently, single-mode SFP segment captures the majority share of the market, owing to the rising demand for high-speed, long-distance communication in data centers, telecom networks, and enterprise networks. Additionally, the increasing need for high bandwidth to support new technologies like 5G, IoT, and cloud computing corresponds with the features of single-mode fiber and its transceivers. The escalating demand for reliable technology capable of facilitating high-speed data transmission over long distances and wide-area networks (WANs), along with the continuously growing industry, has significantly propelled the market and will likely continue to expand in the coming years.
Market Share by Type of Connector
Based on type of connector, the optical transceiver market is segmented into LC, SC, MPO, and RJ-45. According to our estimates, currently, LC connector segment captures the majority share of the market. LC connectors, which are compact and known for their high performance and reliability, are predominantly employed in data centers, enterprise networks, and high-density settings due to their small size, allowing for greater port density. As the demand for LC connectors continues to rise alongside their broad compatibility, the optical transceiver market is poised for substantial growth, presenting a vast opportunity for new entrants.
Market Share by Range
Based on range, the optical transceiver market is segmented into short range, long range, extended range, and others. According to our estimates, currently, short range segment captures the majority share of the market. This can be attributed to the fact that these transceivers are often used in settings requiring limited distance communication, such as within data centers or campus networks.
Market Share by Area of Application
Based on area of application, the optical transceiver market is segmented into telecommunications, 5G networks, internet service providers, cloud computing, medical facilities, research, content delivery networks, television networks and others. According to our estimates, currently, telecommunications sector captures the majority share of the market, primarily due to the extensive use of optical transceivers in telecom networks for rapid data transmission.
Market Share by Company Size
Based on company size, the optical transceiver market is segmented into large, small, and medium-sized companies. According to our estimates, currently, large companies capture the majority share of the market, due to various factors, including their resources and scale. Large enterprises possess substantial resources such as financial capital, advanced research and development capabilities, and established manufacturing operations. Their size enables them to invest in state-of-the-art technologies, maintain an extensive product range, and reach a broader customer audience.
Although large firms primarily dominate the global transceiver market, medium-sized and small businesses can still find their place by concentrating on specialized products, providing customized solutions, or appealing to specific customer demographics. These smaller companies may compete effectively through agility, innovation, and personalized customer service rather than on the basis of scale.
Market Share by End User
Based on end user, the optical transceiver market is segmented into telecom, enterprises data centers, IT, healthcare, automotive, industrial, and others. According to our estimates, currently, telecommunications sector captures the majority share of the market, as it necessitates fast and dependable connectivity for services like voice calls, data transmission, video streaming, and internet access. Transceivers are essential in facilitating efficient data transmission within telecom networks. Additionally, telecom operators are consistently investing in the expansion and enhancement of their networks to satisfy the increasing demand for bandwidth and data services. This persistent infrastructure development fuels the demand for transceivers, especially in technologies such as fiber optics that support long-distance communication.
Other end-users, such as data centers and enterprise networking, also have a significant impact. The rising demand for cloud services, big data analytics, and IoT applications in these areas is accelerating the use of transceivers for high-speed data transmission and connectivity, thereby increasing the demand for the Optical transceiver market.
Market Share by Business Model
Based on business model, the optical transceiver market is segmented into B2B, B2C and B2B2C. According to our estimates, currently, B2B segment captures the majority share of the market, due to the rising integration of optical technology across various sectors, including education, manufacturing, healthcare, finance, and others. However, B2C model is anticipated to grow at a higher CAGR during forecast period.
Market Share by Geography
Based on geography, the optical transceiver market is segmented into North America, Europe, Asia, Latin America, Middle East and North Africa, and Rest of the World. According to our estimates, currently, North America captures the majority share of the market. This is primarily due to increasing awareness which is driving demand in commercial sectors such as retail, banking, and corporate environments. Additionally, significant government investments are being made for public safety and the protection of critical infrastructure. The widespread adoption of advanced video analytics and integrated surveillance systems has also played a significant role in enhancing the demand for optical transceiver systems. However, Asia is anticipated to grow at a higher CAGR during forecast period, due to the growing need for automation and increasing investments in digital infrastructure in emerging nations like India, China, and Japan.
Example Players in Optical Transceiver Market
- Accelink Technologies
- Amphenol
- Applied Optoelectronics
- Arista Networks
- ATOP
- Broadcom
- CBO
- Ciena
- Cisco Systems
- Fabrinet
- Firecomms
- Foxconn Electronics
- FS.COM
- Fujikura
- Fujitsu Optical Components
- Furukawa Electric
- Hisense Broadband Multimedia Technology
- Huawei Technologies
- II-VI Incorporated
- Intel
- Juniper Networks
- Koch Industries
- Lumentum Operations
- Murata Manufacturing
- NEC
- NVIDIA
- Phoenix Contact
- Shaoxing ZKTel Equipment
- Smartoptics AS
- Sumitomo Electric Industries
- Texas Instruments
- ZTE
OPTICAL TRANSCEIVER MARKET: RESEARCH COVERAGE
The report on the optical transceiver market features insights on various sections, including:
- Market Sizing and Opportunity Analysis: An in-depth analysis of the optical transceiver market, focusing on key market segments, including [A] type of form factor, [B] types of data rate, [C] types of protocol, [D] types of wavelengths, [E] types of fiber, [F] types of connectors, [G] distance, [H] areas of application, and [I] company size, [J] end user, [K] type of business model and, [L] geographical regions.
- Competitive Landscape: A comprehensive analysis of the companies engaged in the optical transceiver market, based on several relevant parameters, such as [A] year of establishment, [B] company size, [C] location of headquarters, [D] ownership structure.
- Company Profiles: Elaborate profiles of prominent players engaged in the optical transceiver market, providing details on [A] location of headquarters, [B]company size, [C] company mission, [D] company footprint, [E] management team, [F] contact details, [G] financial information, [H] operating business segments, [I] optical transceiver portfolio, [J] moat analysis, [K] recent developments, and an informed future outlook.
- SWOT Analysis: An insightful SWOT framework, highlighting the strengths, weaknesses, opportunities and threats in the domain. Additionally, it provides Harvey ball analysis, highlighting the relative impact of each SWOT parameter.
KEY QUESTIONS ANSWERED IN THIS REPORT
- How many companies are currently engaged in optical transceiver market?
- Which are the leading companies in this market?
- What factors are likely to influence the evolution of this market?
- What is the current and future market size?
- What is the CAGR of this market?
- How is the current and future market opportunity likely to be distributed across key market segments?
REASONS TO BUY THIS REPORT
- The report provides a comprehensive market analysis, offering detailed revenue projections of the overall market and its specific sub-segments. This information is valuable to both established market leaders and emerging entrants.
- Stakeholders can leverage the report to gain a deeper understanding of the competitive dynamics within the market. By analyzing the competitive landscape, businesses can make informed decisions to optimize their market positioning and develop effective go-to-market strategies.
- The report offers stakeholders a comprehensive overview of the market, including key drivers, barriers, opportunities, and challenges. This information empowers stakeholders to stay abreast of market trends and make data-driven decisions to capitalize on growth prospects.
ADDITIONAL BENEFITS
- Complimentary Excel Data Packs for all Analytical Modules in the Report
- 10% Free Content Customization
- Detailed Report Walkthrough Session with Research Team
- Free Updated report if the report is 6-12 months old or older
TABLE OF CONTENTS
1. PREFACE
- 1.1. Introduction
- 1.2. Market Share Insights
- 1.3. Key Market Insights
- 1.4. Report Coverage
- 1.5. Key Questions Answered
- 1.6. Chapter Outlines
2. RESEARCH METHODOLOGY
- 2.1. Chapter Overview
- 2.2. Research Assumptions
- 2.3. Database Building
- 2.3.1. Data Collection
- 2.3.2. Data Validation
- 2.3.3. Data Analysis
- 2.4. Project Methodology
- 2.4.1. Secondary Research
- 2.4.1.1. Annual Reports
- 2.4.1.2. Academic Research Papers
- 2.4.1.3. Company Websites
- 2.4.1.4. Investor Presentations
- 2.4.1.5. Regulatory Filings
- 2.4.1.6. White Papers
- 2.4.1.7. Industry Publications
- 2.4.1.8. Conferences and Seminars
- 2.4.1.9. Government Portals
- 2.4.1.10. Media and Press Releases
- 2.4.1.11. Newsletters
- 2.4.1.12. Industry Databases
- 2.4.1.13. Roots Proprietary Databases
- 2.4.1.14. Paid Databases and Sources
- 2.4.1.15. Social Media Portals
- 2.4.1.16. Other Secondary Sources
- 2.4.2. Primary Research
- 2.4.2.1. Introduction
- 2.4.2.2. Types
- 2.4.2.2.1. Qualitative
- 2.4.2.2.2. Quantitative
- 2.4.2.3. Advantages
- 2.4.2.4. Techniques
- 2.4.2.4.1. Interviews
- 2.4.2.4.2. Surveys
- 2.4.2.4.3. Focus Groups
- 2.4.2.4.4. Observational Research
- 2.4.2.4.5. Social Media Interactions
- 2.4.2.5. Stakeholders
- 2.4.2.5.1. Company Executives (CXOs)
- 2.4.2.5.2. Board of Directors
- 2.4.2.5.3. Company Presidents and Vice Presidents
- 2.4.2.5.4. Key Opinion Leaders
- 2.4.2.5.5. Research and Development Heads
- 2.4.2.5.6. Technical Experts
- 2.4.2.5.7. Subject Matter Experts
- 2.4.2.5.8. Scientists
- 2.4.2.5.9. Doctors and Other Healthcare Providers
- 2.4.2.6. Ethics and Integrity
- 2.4.2.6.1. Research Ethics
- 2.4.2.6.2. Data Integrity
- 2.4.3. Analytical Tools and Databases
- 2.4.1. Secondary Research
3. ECONOMIC AND OTHER PROJECT SPECIFIC CONSIDERATIONS
- 3.1. Forecast Methodology
- 3.1.1. Top-Down Approach
- 3.1.2. Bottom-Up Approach
- 3.1.3. Hybrid Approach
- 3.2. Market Assessment Framework
- 3.2.1. Total Addressable Market (TAM)
- 3.2.2. Serviceable Addressable Market (SAM)
- 3.2.3. Serviceable Obtainable Market (SOM)
- 3.2.4. Currently Acquired Market (CAM)
- 3.3. Forecasting Tools and Techniques
- 3.3.1. Qualitative Forecasting
- 3.3.2. Correlation
- 3.3.3. Regression
- 3.3.4. Time Series Analysis
- 3.3.5. Extrapolation
- 3.3.6. Convergence
- 3.3.7. Forecast Error Analysis
- 3.3.8. Data Visualization
- 3.3.9. Scenario Planning
- 3.3.10. Sensitivity Analysis
- 3.4. Key Considerations
- 3.4.1. Demographics
- 3.4.2. Market Access
- 3.4.3. Reimbursement Scenarios
- 3.4.4. Industry Consolidation
- 3.5. Robust Quality Control
- 3.6. Key Market Segmentations
- 3.7. Limitations
4. MACRO-ECONOMIC INDICATORS
- 4.1. Chapter Overview
- 4.2. Market Dynamics
- 4.2.1. Time Period
- 4.2.1.1. Historical Trends
- 4.2.1.2. Current and Forecasted Estimates
- 4.2.2. Currency Coverage
- 4.2.2.1. Overview of Major Currencies Affecting the Market
- 4.2.2.2. Impact of Currency Fluctuations on the Industry
- 4.2.3. Foreign Exchange Impact
- 4.2.3.1. Evaluation of Foreign Exchange Rates and Their Impact on Market
- 4.2.3.2. Strategies for Mitigating Foreign Exchange Risk
- 4.2.4. Recession
- 4.2.4.1. Historical Analysis of Past Recessions and Lessons Learnt
- 4.2.4.2. Assessment of Current Economic Conditions and Potential Impact on the Market
- 4.2.5. Inflation
- 4.2.5.1. Measurement and Analysis of Inflationary Pressures in the Economy
- 4.2.5.2. Potential Impact of Inflation on the Market Evolution
- 4.2.6. Interest Rates
- 4.2.6.1. Overview of Interest Rates and Their Impact on the Market
- 4.2.6.2. Strategies for Managing Interest Rate Risk
- 4.2.7. Commodity Flow Analysis
- 4.2.7.1. Type of Commodity
- 4.2.7.2. Origins and Destinations
- 4.2.7.3. Values and Weights
- 4.2.7.4. Modes of Transportation
- 4.2.8. Global Trade Dynamics
- 4.2.8.1. Import Scenario
- 4.2.8.2. Export Scenario
- 4.2.9. War Impact Analysis
- 4.2.9.1. Russian-Ukraine War
- 4.2.9.2. Israel-Hamas War
- 4.2.10. COVID Impact / Related Factors
- 4.2.10.1. Global Economic Impact
- 4.2.10.2. Industry-specific Impact
- 4.2.10.3. Government Response and Stimulus Measures
- 4.2.10.4. Future Outlook and Adaptation Strategies
- 4.2.11. Other Indicators
- 4.2.11.1. Fiscal Policy
- 4.2.11.2. Consumer Spending
- 4.2.11.3. Gross Domestic Product (GDP)
- 4.2.11.4. Employment
- 4.2.11.5. Taxes
- 4.2.11.6. R&D Innovation
- 4.2.11.7. Stock Market Performance
- 4.2.11.8. Supply Chain
- 4.2.11.9. Cross-Border Dynamics
- 4.2.1. Time Period
5. EXECUTIVE SUMMARY
6. INTRODUCTION
- 6.1. Chapter Overview
- 6.2. Overview of Optical Transceiver
- 6.2.1. Key Characteristics of Optical Transceiver market
- 6.2.2. Type of Form Factor
- 6.2.3. Type of Data Rate
- 6.2.4. Mode of Protocol
- 6.2.5. Type of Wavelength
- 6.2.6. Type of Fiber
- 6.2.7. Type of Connector
- 6.2.8. Distance as per Range
- 6.2.9. Area of Application
- 6.3. Future Perspective
7. COMPETITIVE LANDSCAPE
- 7.1. Chapter Overview
- 7.2. Optical Transceiver: Overall Market Landscape
- 7.2.1. Analysis by Year of Establishment
- 7.2.2. Analysis by Company Size
- 7.2.3. Analysis by Location of Headquarters
- 7.2.4. Analysis by Ownership Structure
8. COMPANY PROFILES
- 8.1. Chapter Overview
- 8.2. Accelink Technologies*
- 8.2.1. Company Overview
- 8.2.2. Company Mission
- 8.2.3. Company Footprint
- 8.2.4. Management Team
- 8.2.5. Contact Details
- 8.2.6. Financial Performance
- 8.2.7. Operating Business Segments
- 8.2.8. Service / Product Portfolio (project specific)
- 8.2.9. MOAT Analysis
- 8.2.10. Recent Developments and Future Outlook
- 8.3. Amphenol
- 8.4. Applied Optoelectronics
- 8.5. Arista Networks
- 8.6. ATOP
- 8.7. Broadcom
- 8.8. CBO GmbH
- 8.9. Ciena
- 8.10. Fabrinet
- 8.11. Firecomms
- 8.12. NEC
- 8.13. NVIDIA
- 8.14. ZTE
9. VALUE CHAIN ANALYSIS
10. SWOT ANALYSIS
11. OPTICAL TRANSCEIVER MARKET
- 11.1. Chapter Overview
- 11.2. Key Assumptions and Methodology
- 11.3. Trends Disruption Impacting Market
- 11.4. Optical Transceiver Market, Historical Trends (Since 2019) and Forecasted Estimates (Till 2035)
- 11.5. Multivariate Scenario Analysis
- 11.5.1. Conservative Scenario
- 11.5.2. Optimistic Scenario
- 11.6. Key Market Segmentations
12. MARKET OPPORTUNITIES BASED ON TYPE OF FORM FACTOR
- 12.1. Chapter Overview
- 12.2. Key Assumptions and Methodology
- 12.3. Revenue Shift Analysis
- 12.4. Market Movement Analysis
- 12.5. Penetration-Growth (P-G) Matrix
- 12.6. Optical Transceiver Market for CFP: Historical Trends (Since 2019) and Forecasted Estimates (Till 2035)
- 12.6.1. Optical Transceiver Market for QSFP: Historical Trends (Since 2019) and Forecasted Estimates (Till 2035)
- 12.6.2. Optical Transceiver Market for QSFP+: Historical Trends (Since 2019) and Forecasted Estimates (Till 2035)
- 12.6.3. Optical Transceiver Market for QSFP28: Historical Trends (Since 2019) and Forecasted Estimates (Till 2035)
- 12.6.4. Optical Transceiver Market for SFP: Historical Trends (Since 2019) and Forecasted Estimates (Till 2035)
- 12.6.5. Optical Transceiver Market for SFP+: Historical Trends (Since 2019) and Forecasted Estimates (Till 2035)
- 12.6.6. Optical Transceiver Market for XFP: Historical Trends (Since 2019) and Forecasted Estimates (Till 2035)
- 12.7. Data Triangulation and Validation
13. MARKET OPPORTUNITIES BASED ON TYPE OF DATA RATE
- 13.1. Chapter Overview
- 13.2. Key Assumptions and Methodology
- 13.3. Revenue Shift Analysis
- 13.4. Market Movement Analysis
- 13.5. Penetration-Growth (P-G) Matrix
- 13.6. Optical Transceiver Market for Less than 10 Gbps: Historical Trends (Since 2019) and Forecasted Estimates (Till 2035)
- 13.7. Optical Transceiver Market for 10 Gbps to 40 Gbps: Historical Trends (Since 2019) and Forecasted Estimates (Till 2035)
- 13.8. Optical Transceiver Market for 100 Gbps: Historical Trends (Since 2019) and Forecasted Estimates (Till 2035)
- 13.9. Optical Transceiver Market for Greater than 100 Gbps: Historical Trends (Since 2019) and Forecasted Estimates (Till 2035)
- 13.10. Data Triangulation and Validation
14. MARKET OPPORTUNITIES BASED ON PROTOCOL
- 14.1. Chapter Overview
- 14.2. Key Assumptions and Methodology
- 14.3. Revenue Shift Analysis
- 14.4. Market Movement Analysis
- 14.5. Penetration-Growth (P-G) Matrix
- 14.6. Optical Transceiver Market for CWDM/DWDM: Historical Trends (Since 2019) and Forecasted Estimates (Till 2035)
- 14.7. Optical Transceiver Market for Ethernet: Historical Trends (Since 2019) and Forecasted Estimates (Till 2035)
- 14.8. Optical Transceiver Market for FTTx: Historical Trends (Since 2019) and Forecasted Estimates (Till 2035)
- 14.9. Optical Transceiver Market for Fiber Channel and Other Protocols: Historical Trends (Since 2019) and Forecasted Estimates (Till 2035)
- 14.10. Data Triangulation and Validation
15. MARKET OPPORTUNITIES BASED ON TYPE OF WAWELENGTH
- 15.1. Chapter Overview
- 15.2. Key Assumptions and Methodology
- 15.3. Revenue Shift Analysis
- 15.4. Market Movement Analysis
- 15.5. Penetration-Growth (P-G) Matrix
- 15.6. Optical Transceiver Market based on 850 nm wavelength: Historical Trends (Since 2019) and Forecasted Estimates (Till 2035)
- 15.7. Optical Transceiver Market based on 1310 nm wavelength: Historical Trends (Since 2019) and Forecasted Estimates (Till 2035)
- 15.8. Optical Transceiver Market based on 1550 nm and wavelengths: Historical Trends (Since 2019) and Forecasted Estimates (Till 2035)
- 15.9. Data Triangulation and Validation
16. MARKET OPPORTUNITIES BASED ON TYPE OF FIBRE
- 16.1. Chapter Overview
- 16.2. Key Assumptions and Methodology
- 16.3. Revenue Shift Analysis
- 16.4. Market Movement Analysis
- 16.5. Penetration-Growth (P-G) Matrix
- 16.6. Optical Transceiver Market for Single-Mode Fiber: Historical Trends (Since 2019) and Forecasted Estimates (Till 2035)
- 16.7. Optical Transceiver Market for Multimode Fiber: Historical Trends (Since 2019) and Forecasted Estimates (Till 2035)
- 16.8. Optical Transceiver Market for Single-Mode SFP: Historical Trends (Since 2019) and Forecasted Estimates (Till 2035)
- 16.9. Optical Transceiver Market for Multimode SFP: Historical Trends (Since 2019) and Forecasted Estimates (Till 2035)
- 16.10. Data Triangulation and Validation
17. MARKET OPPORTUNITIES BASED ON TYPE OF CONNECTOR
- 17.1. Chapter Overview
- 17.2. Key Assumptions and Methodology
- 17.3. Revenue Shift Analysis
- 17.4. Market Movement Analysis
- 17.5. Penetration-Growth (P-G) Matrix
- 17.6. Optical Transceiver Market for LC: Historical Trends (Since 2019) and Forecasted Estimates (Till 2035)
- 17.7. Optical Transceiver Market for MPO: Historical Trends (Since 2019) and Forecasted Estimates (Till 2035)
- 17.8. Optical Transceiver Market for RJ-45: Historical Trends (Since 2019) and Forecasted Estimates (Till 2035)
- 17.9. Optical Transceiver Market for SC: Historical Trends (Since 2019) and Forecasted Estimates (Till 2035)
- 17.10. Data Triangulation and Validation
18. MARKET OPPORTUNITIES BASED ON RANGE
- 18.1. Chapter Overview
- 18.2. Key Assumptions and Methodology
- 18.3. Revenue Shift Analysis
- 18.4. Market Movement Analysis
- 18.5. Penetration-Growth (P-G) Matrix
- 18.6. Optical Transceiver Market for Short-Range: Historical Trends (Since 2019) and Forecasted Estimates (Till 2035)
- 18.7. Optical Transceiver Market for Long-Range: Historical Trends (Since 2019) and Forecasted Estimates (Till 2035)
- 18.8. Optical Transceiver Market for Extended Range and others: Historical Trends (Since 2019) and Forecasted Estimates (Till 2035)
- 18.9. Data Triangulation and Validation
19. MARKET OPPORTUNITIES BASED ON AREA OF APPLICATION
- 19.1. Chapter Overview
- 19.2. Key Assumptions and Methodology
- 19.3. Revenue Shift Analysis
- 19.4. Market Movement Analysis
- 19.5. Penetration-Growth (P-G) Matrix
- 19.6. Optical Transceiver Market for 5G Networks: Historical Trends (Since 2019) and Forecasted Estimates (Till 2035)
- 19.7. Optical Transceiver Market for Cloud Computing: Historical Trends (Since 2019) and Forecasted Estimates (Till 2035)
- 19.8. Optical Transceiver Market for Content Delivery Networks: Historical Trends (Since 2019) and Forecasted Estimates (Till 2035)
- 19.9. Optical Transceiver Market for Internet Service Providers: Historical Trends (Since 2019) and Forecasted Estimates (Till 2035)
- 19.10. Optical Transceiver Market for Medical Facilities: Historical Trends (Since 2019) and Forecasted Estimates (Till 2035)
- 19.11. Optical Transceiver Market for Research: Historical Trends (Since 2019) and Forecasted Estimates (Till 2035)
- 19.12. Optical Transceiver Market for Telecommunications: Historical Trends (Since 2019) and Forecasted Estimates (Till 2035)
- 19.13. Optical Transceiver Market for Television Networks: Historical Trends (Since 2019) and Forecasted Estimates (Till 2035)
- 19.14. Optical Transceiver Market for Others: Historical Trends (Since 2019) and Forecasted Estimates (Till 2035)
- 19.15. Data Triangulation and Validation
20. MARKET OPPORTUNITIES BASED ON COMPANY SIZE
- 20.1. Chapter Overview
- 20.2. Key Assumptions and Methodology
- 20.3. Revenue Shift Analysis
- 20.4. Market Movement Analysis
- 20.5. Penetration-Growth (P-G) Matrix
- 20.6. Optical Transceiver Market for Small and Medium-sized Enterprises (SMEs): Historical Trends (Since 2019) and Forecasted Estimates (Till 2035)
- 20.7. Optical Transceiver Market for Large Enterprises: Historical Trends (Since 2019) and Forecasted Estimates (Till 2035)
- 20.8. Data Triangulation and Validation
21. MARKET OPPORTUNITIES BASED ON END USER
- 21.1. Chapter Overview
- 21.2. Key Assumptions and Methodology
- 21.3. Revenue Shift Analysis
- 21.4. Market Movement Analysis
- 21.5. Penetration-Growth (P-G) Matrix
- 21.6. Optical Transceiver Market for Automotive: Historical Trends (Since 2019) and Forecasted Estimates (Till 2035)
- 21.7. Optical Transceiver Market for Data Centers: Historical Trends (Since 2019) and Forecasted Estimates (Till 2035)
- 21.8. Optical Transceiver Market for Enterprises: Historical Trends (Since 2019) and Forecasted Estimates (Till 2035)
- 21.9. Optical Transceiver Market for Healthcare: Historical Trends (Since 2019) and Forecasted Estimates (Till 2035)
- 21.10. Optical Transceiver Market for Industry: Historical Trends (Since 2019) and Forecasted Estimates (Till 2035)
- 21.11. Optical Transceiver Market for IT: Historical Trends (Since 2019) and Forecasted Estimates (Till 2035)
- 21.12. Optical Transceiver Market for Telecommunications: Historical Trends (Since 2019) and Forecasted Estimates (Till 2035)
- 21.13. Data Triangulation and Validation
22. MARKET OPPORTUNITIES BASED ON BUSINESS MODEL
- 22.1. Chapter Overview
- 22.2. Key Assumptions and Methodology
- 22.3. Revenue Shift Analysis
- 22.4. Market Movement Analysis
- 22.5. Penetration-Growth (P-G) Matrix
- 22.6. Optical Transceiver Market for B2B: Historical Trends (Since 2019) and Forecasted Estimates (Till 2035)
- 22.7. Optical Transceiver Market for B2C: Historical Trends (Since 2019) and Forecasted Estimates (Till 2035)
- 22.8. Optical Transceiver Market for B2B2C: Historical Trends (Since 2019) and Forecasted Estimates (Till 2035))
- 22.9. Data Triangulation and Validation
23. MARKET OPPORTUNITIES FOR OPTICAL TRANSCEIVER IN NORTH AMERICA
- 23.1. Chapter Overview
- 23.2. Key Assumptions and Methodology
- 23.3. Revenue Shift Analysis
- 23.4. Market Movement Analysis
- 23.5. Penetration-Growth (P-G) Matrix
- 23.6. LMS Market in North America: Historical Trends (Since 2019) and Forecasted Estimates (Till 2035)
- 23.6.1. LMS Market in the US: Historical Trends (Since 2019) and Forecasted Estimates (Till 2035)
- 23.6.2. LMS Market in Canada: Historical Trends (Since 2019) and Forecasted Estimates (Till 2035)
- 23.6.3. LMS Market in Mexico: Historical Trends (Since 2019) and Forecasted Estimates (Till 2035)
- 23.6.4. LMS Market in Other North American Countries: Historical Trends (Since 2019) and Forecasted Estimates (Till 2035)
- 23.7. Data Triangulation and Validation
24. MARKET OPPORTUNITIES FOR OPTICAL TRANSCEIVER IN EUROPE
- 24.1. Chapter Overview
- 24.2. Key Assumptions and Methodology
- 24.3. Revenue Shift Analysis
- 24.4. Market Movement Analysis
- 24.5. Penetration-Growth (P-G) Matrix
- 24.6. Optical Transceiver Market in Europe: Historical Trends (Since 2019) and Forecasted Estimates (Till 2035)
- 24.6.1. Optical Transceiver Market in the Austria: Historical Trends (Since 2019) and Forecasted Estimates (Till 2035)
- 24.6.2. Optical Transceiver Market in Belgium: Historical Trends (Since 2019) and Forecasted Estimates (Till 2035)
- 24.6.3. Optical Transceiver Market in Denmark: Historical Trends (Since 2019) and Forecasted Estimates (Till 2035)
- 24.6.4. Optical Transceiver Market in France: Historical Trends (Since 2019) and Forecasted Estimates (Till 2035)
- 24.6.5. Optical Transceiver Market in Germany: Historical Trends (Since 2019) and Forecasted Estimates (Till 2035)
- 24.6.6. Optical Transceiver Market in Ireland: Historical Trends (Since 2019) and Forecasted Estimates (Till 2035)
- 24.6.7. Optical Transceiver Market in Italy: Historical Trends (Since 2019) and Forecasted Estimates (Till 2035)
- 24.6.8. Optical Transceiver Market in Netherlands: Historical Trends (Since 2019) and Forecasted Estimates (Till 2035)
- 24.6.9. Optical Transceiver Market in Norway: Historical Trends (Since 2019) and Forecasted Estimates (Till 2035)
- 24.6.10. Optical Transceiver Market in Russia: Historical Trends (Since 2019) and Forecasted Estimates (Till 2035)
- 24.6.11. Optical Transceiver Market in Spain: Historical Trends (Since 2019) and Forecasted Estimates (Till 2035)
- 24.6.12. Optical Transceiver Market in Sweden: Historical Trends (Since 2019) and Forecasted Estimates (Till 2035)
- 24.6.13. Optical Transceiver Market in Switzerland: Historical Trends (Since 2019) and Forecasted Estimates (Till 2035)
- 24.6.14. Optical Transceiver Market in the UK: Historical Trends (Since 2019) and Forecasted Estimates (Till 2035)
- 24.6.15. Optical Transceiver Market in Other European Countries: Historical Trends (Since 2019) and Forecasted Estimates (Till 2035)
- 24.7. Data Triangulation and Validation
25. MARKET OPPORTUNITIES FOR OPTICAL TRANSCEIVER IN ASIA
- 25.1. Chapter Overview
- 25.2. Key Assumptions and Methodology
- 25.3. Revenue Shift Analysis
- 25.4. Market Movement Analysis
- 25.5. Penetration-Growth (P-G) Matrix
- 25.6. Optical Transceiver Market in Asia: Historical Trends (Since 2019) and Forecasted Estimates (Till 2035)
- 25.6.1. Optical Transceiver Market in China: Historical Trends (Since 2019) and Forecasted Estimates (Till 2035)
- 25.6.2. Optical Transceiver Market in India: Historical Trends (Since 2019) and Forecasted Estimates (Till 2035)
- 25.6.3. Optical Transceiver Market in Japan: Historical Trends (Since 2019) and Forecasted Estimates (Till 2035)
- 25.6.4. Optical Transceiver Market in Singapore: Historical Trends (Since 2019) and Forecasted Estimates (Till 2035)
- 25.6.5. Optical Transceiver Market in South Korea: Historical Trends (Since 2019) and Forecasted Estimates (Till 2035)
- 25.6.6. Optical Transceiver Market in Other Asian Countries: Historical Trends (Since 2019) and Forecasted Estimates (Till 2035)
- 25.7. Data Triangulation and Validation
26. MARKET OPPORTUNITIES FOR OPTICAL TRANSCEIVER IN MIDDLE EAST AND NORTH AFRICA (MENA)
- 26.1. Chapter Overview
- 26.2. Key Assumptions and Methodology
- 26.3. Revenue Shift Analysis
- 26.4. Market Movement Analysis
- 26.5. Penetration-Growth (P-G) Matrix
- 26.6. Optical Transceiver Market in Middle East and North Africa (MENA): Historical Trends (Since 2019) and Forecasted Estimates (Till 2035)
- 26.6.1. Optical Transceiver Market in Egypt: Historical Trends (Since 2019) and Forecasted Estimates (Till 205)
- 26.6.2. Optical Transceiver Market in Iran: Historical Trends (Since 2019) and Forecasted Estimates (Till 2035)
- 26.6.3. Optical Transceiver Market in Iraq: Historical Trends (Since 2019) and Forecasted Estimates (Till 2035)
- 26.6.4. Optical Transceiver Market in Israel: Historical Trends (Since 2019) and Forecasted Estimates (Till 2035)
- 26.6.5. Optical Transceiver Market in Kuwait: Historical Trends (Since 2019) and Forecasted Estimates (Till 2035)
- 26.6.6. Optical Transceiver Market in Saudi Arabia: Historical Trends (Since 2019) and Forecasted Estimates (Till 2035)
- 26.6.7. Optical Transceiver Market in United Arab Emirates (UAE): Historical Trends (Since 2019) and Forecasted Estimates (Till 2035)
- 26.6.8. Optical Transceiver Market in Other MENA Countries: Historical Trends (Since 2019) and Forecasted Estimates (Till 2035)
- 26.7. Data Triangulation and Validation
27. MARKET OPPORTUNITIES FOR OPTICAL TRANSCEIVER IN LATIN AMERICA
- 27.1. Chapter Overview
- 27.2. Key Assumptions and Methodology
- 27.3. Revenue Shift Analysis
- 27.4. Market Movement Analysis
- 27.5. Penetration-Growth (P-G) Matrix
- 27.6. Optical Transceiver Market in Latin America: Historical Trends (Since 2019) and Forecasted Estimates (Till 2035)
- 27.6.1. Optical Transceiver Market in Argentina: Historical Trends (Since 2019) and Forecasted Estimates (Till 2035)
- 27.6.2. Optical Transceiver Market in Brazil: Historical Trends (Since 2019) and Forecasted Estimates (Till 2035)
- 27.6.3. Optical Transceiver Market in Chile: Historical Trends (Since 2019) and Forecasted Estimates (Till 2035)
- 27.6.4. Optical Transceiver Market in Colombia Historical Trends (Since 2019) and Forecasted Estimates (Till 2035)
- 27.6.5. Optical Transceiver Market in Venezuela: Historical Trends (Since 2019) and Forecasted Estimates (Till 2035)
- 27.6.6. Optical Transceiver Market in Other Latin American Countries: Historical Trends (Since 2019) and Forecasted Estimates (Till 2035)
- 27.7. Data Triangulation and Validation
28. MARKET OPPORTUNITIES FOR OPTICAL TRANSCEIVER IN REST OF THE WORLD
- 28.1. Chapter Overview
- 28.2. Key Assumptions and Methodology
- 28.3. Revenue Shift Analysis
- 28.4. Market Movement Analysis
- 28.5. Penetration-Growth (P-G) Matrix
- 28.6. Optical Transceiver Market in Rest of the World: Historical Trends (Since 2019) and Forecasted Estimates (Till 2035)
- 28.6.1. Optical Transceiver Market in Australia: Historical Trends (Since 2019) and Forecasted Estimates (Till 2035)
- 28.6.2. Optical Transceiver Market in New Zealand: Historical Trends (Since 2019) and Forecasted Estimates (Till 2035)
- 28.6.3. Optical Transceiver Market in Other Countries
- 28.7. Data Triangulation and Validation
29. TABULATED DATA
30. LIST OF COMPANIES AND ORGANIZATIONS
31. CUSTOMIZATION OPPORTUNITIES
32. ROOTS SUBSCRIPTION SERVICES
33. AUTHOR DETAILS
- 発行日
- 発行
- Roots Analysis
- ページ情報
- 英文 197 Pages
- 納期
- 7~10営業日


