
ナノ粒子製剤市場:ナノ粒子タイプ別、事業規模別、主要地域別:2035年までの業界動向と世界の予測
Nanoparticle Formulation Market by Type of Nanoparticle (Organic, Inorganic Nanoparticles and Carbon-based Nanoparticles), Scale of Operation and Key Geographical Regions : Industry Trends and Global Forecasts, Till 2035- 発行日
- ページ情報
- 英文 270 Pages
- 納期
- 即日から翌営業日
- 商品コード
- 1682717
- カスタマイズ可能 お客様のご希望に応じて、既存データの加工や未掲載情報(例:国別セグメント)の追加などの対応が可能です。詳細はお問い合わせください。
- 翻訳ツール提供対象 PDF対応AI翻訳ツールの無料貸し出しサービスのご利用が可能です
- 医薬品関連専門 医薬品関連専門を専門とする市場調査会社です。
概要
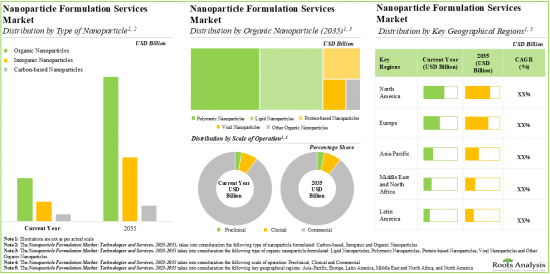
世界のナノ粒子製剤の市場規模は、2035年までの予測期間中に9.4%のCAGRで拡大し、現在の51億米ドルから2035年までに151億米ドルに成長すると予測されています。
無数の疾患にわたって強力な治療可能性を示したナノ粒子ベースの医薬品は、短期間のうちに有望な治療選択肢として浮上しました。実際、現在進行中の研究ペースを考慮すると、ナノ粒子分野における目覚ましい革新(疾病診断と治療特異性の改善という点で)は、今後数年で製薬業界に革命をもたらす可能性が高いと専門家は考えています。さらに、媒介性疾患の検出と制御、透析、分子イメージングを目的としたナノテクノロジーに焦点を当てた最近の取り組みが、これらのナノ粒子の需要をさらに促進しています。さらに、ナノ粒子は、その変更可能な特性(サイズ、形状、表面特性、電荷など)により、最適な送達を達成し、患者の体内の生物学的障壁(全身、微小環境、細胞)の制限を克服するように設計することができます。しかしながら、ナノ粒子の特性と生物学的システムとの間の複雑な相互作用は、これらのナノスケール材料の安全性と有効性を確保するために慎重な検討を必要とします。CRO(医薬品開発業務受託機関)やCDO/CDMO(医薬品開発・製造業務受託機関)といった様々な利害関係者は、研究者や医薬品開発者がその設計、開発、製造に関連する複雑な問題をうまく切り抜けるのを支援する上で、極めて重要な役割を果たすと予想されます。この分野の多面的な専門知識を活用することで、受託サービスプロバイダーは、ナノ粒子開発プロセスの合理化、コスト削減、有望なナノ粒子の研究室規模から臨床規模への転換の促進を支援することができます。技術の進歩とナノ粒子ベースの医薬品に対する需要の高まりに後押しされ、ナノ粒子製剤サービス市場は予測される将来において顕著な成長を遂げると予想されます。
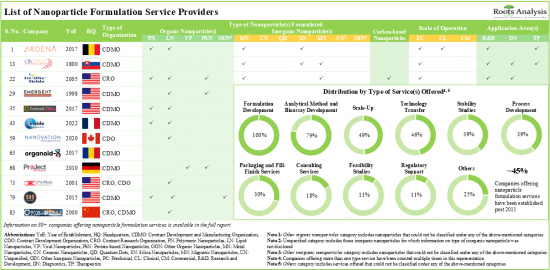
現在、ナノ粒子ベースの医薬品の開発と製造を強化するために、世界中の企業別100以上のナノ粒子製剤技術が提供されています。技術の80%近くは有機ナノ粒子の製剤化のために設計されており、そのうち50%近くは主に腫瘍疾患をターゲットとした注射ルートによるドラッグデリバリーを目的としています。現在のサービスプロバイダーは80社以上で、さまざまな規模のナノ粒子製剤サービスを幅広く提供しています。
市場情勢は、広範な応用分野向けのナノ粒子ベースの医薬品を開発/製造するために必要な専門知識を持つ老舗企業と新規参入企業の両方の存在を特徴としています。ナノ粒子ベースの製剤に対する需要の高まりを受けて、サービスプロバイダーはそれぞれのサービスポートフォリオを強化するために既存の能力を継続的に拡大しています。近年、パートナーシップ活動の着実な成長が観察されています。研究開発契約は、米国を拠点とする企業が採用する最も顕著なタイプのパートナーシップモデルです。知的財産を保護するために、ナノ粒子の処方と開発に関連する1,700件以上の特許が様々な組織別出願され、また様々な組織に付与されています。ナノ粒子製剤サービス市場は、商業規模の操業から得られる収益が原動力となり、今後10年間でCAGR~9%で成長するとみられます。
当レポートでは、世界のナノ粒子製剤市場について調査し、市場の概要とともに、ナノ粒子タイプ別、事業規模別、主要地域別の動向、および市場に参入する企業のプロファイルなどを提供しています。
目次
第1章 序文
第2章 エグゼクティブサマリー
第3章 イントロダクション
第4章 技術情勢
第5章 サービスプロバイダーの情勢
第6章 技術競争力分析
第7章 企業競争力分析
第8章 企業プロファイル
- 章の概要
- Ascension Sciences
- DIANT Pharma
- ExonanoRNA
- Nanoform
- NanoVation Therapeutics
- NanoVelos
- NTT Biopharma
- Organoid-X BioTech
- Vaxinano
第9章 パートナーシップとコラボレーション
第10章 特許分析
第11章 ナノ粒子評価フレームワーク
第12章 市場予測と機会分析
第13章 ケーススタディ:技術ライセンシング契約
第14章 結論
第15章 エグゼクティブ洞察
第16章 付録1:表形式のデータ
第17章 付録2:企業・団体一覧
図表
List of Tables
- Table 4.1 Nanoparticle Formulation Technologies: Information on Type of Nanoparticle(s) Formulated
- Table 4.2 Nanoparticle Formulation Technologies: Information on Formulation Method(s) Used
- Table 4.3 Nanoparticle Formulation Technologies: Information on Type of Molecule(s) Delivered
- Table 4.4 Nanoparticle Formulation Technologies: Information on Therapeutic Area(s)
- Table 4.5 Nanoparticle Formulation Technologies: Information on Compatible Dosage Form(s)
- Table 4.6 Nanoparticle Formulation Technologies: Information on Route(s) of Administration
- Table 4.7 Nanoparticle Formulation Technologies: Information on Compatible Drug Release Mechanism
- Table 4.8 Nanoparticle Formulation Technologies: Information on Compatibility for Long-Acting Drug Delivery
- Table 4.9 Nanoparticle Formulation Technologies: List of Technology Developers
- Table 5.1 Nanoparticle Formulation Service Providers: List of Service Providers
- Table 5.2 Nanoparticle Formulation Service Providers: Information on Type of Nanoparticle(s) Formulated
- Table 5.3 Nanoparticle Formulation Service Providers: Information on Type of Service(s) Offered
- Table 5.4 Nanoparticle Formulation Service Providers: Information on Scale of Operation
- Table 5.5 Nanoparticle Formulation Service Providers: Information on Application Area(s)
- Table 8.1 Nanoparticle Formulation Technology Developers and Service Providers: List of Companies Profiled
- Table 8.2 Ascension Sciences: Company Overview
- Table 8.3 Ascension Sciences: Technology Portfolio
- Table 8.4 Ascension Sciences: Recent Developments and Future Outlook
- Table 8.5 DIANT Pharma: Company Overview
- Table 8.6 DIANT Pharma: Technology Portfolio
- Table 8.7 DIANT Pharma: Recent Developments and Future Outlook
- Table 8.8 ExonanoRNA: Company Overview
- Table 8.9 ExonanoRNA: Technology Portfolio
- Table 8.10 ExonanoRNA: Recent Developments and Future Outlook
- Table 8.11 Nanoform: Company Overview
- Table 8.12 Nanoform: Technology Portfolio
- Table 8.13 Nanoform: Recent Developments and Future Outlook
- Table 8.14 NanoVation Therapeutics: Company Overview
- Table 8.15 NanoVation Therapeutics: Technology Portfolio
- Table 8.16 NanoVation Therapeutics: Recent Developments and Future Outlook
- Table 8.17 NanoVelos: Company Overview
- Table 8.18 NanoVelos: Technology Portfolio
- Table 8.19 NTT Biopharma: Company Overview
- Table 8.20 NTT Biopharma: Technology Portfolio
- Table 8.21 Organoid-X BioTech: Company Overview
- Table 8.22 Organoid-X BioTech: Technology Portfolio
- Table 8.23 Vaxinano: Company Overview
- Table 8.24 Vaxinano: Technology Portfolio
- Table 8.25 Vaxinano: Recent Developments and Future Outlook
- Table 9.1 Partnerships and Collaborations: Information on Year of Agreement, Type of Partnership and Type of Partner, since 2018
- Table 9.2 Partnerships and Collaborations: Information on Type of Agreement (Country-wise and Continent-wise), since 2018
- Table 10.1 Patent Analysis: List of Top CPC Sections
- Table 10.2 Patent Analysis: List of Top CPC Symbols
- Table 10.3 Patent Analysis: List of Top CPC Codes
- Table 10.4 Patent Analysis: Categorizations based on Weighted Valuation Scores
- Table 10.5 Patent Portfolio: List of Leading Patents (by Highest Relative Valuation)
- Table 11.1 Organic Nanoparticles: Global Competition
- Table 11.2 Inorganic Nanoparticles: Global Competition
- Table 11.3 Carbon-based Nanoparticles: Global Competition
- Table 13.1 Technology Licensing Deals
- Table 16.1 Nanoparticle Formulation Technologies: Distribution by Type of Nanoparticle(s) Formulated
- Table 16.2 Nanoparticle Formulation Technologies: Distribution by Type of Organic Nanoparticle(s) Formulated
- Table 16.3 Nanoparticle Formulation Technologies: Distribution by Type of Inorganic Nanoparticle(s) Formulated
- Table 16.4 Nanoparticle Formulation Technologies: Distribution by Type of Molecule(s) Delivered
- Table 16.5 Nanoparticle Formulation Technologies: Distribution by Therapeutic Area(s)
- Table 16.6 Nanoparticle Formulation Technologies: Distribution by Compatible Dosage Form(s)
- Table 16.7 Nanoparticle Formulation Technologies: Distribution by Route(s) of Administration
- Table 16.8 Nanoparticle Formulation Technology Developers: Distribution by Year of Establishment
- Table 16.9 Nanoparticle Formulation Technology Developers: Distribution by Company Size
- Table 16.10 Nanoparticle Formulation Technology Developers: Distribution by Location of Headquarters
- Table 16.11 Nanoparticle Formulation Technology Developers: Distribution by Company Size and Location of Headquarters
- Table 16.12 Most Active Players: Distribution by Number of Technologies
- Table 16.13 Nanoparticle Formulation Service Providers: Distribution by Year of Establishment
- Table 16.14 Nanoparticle Formulation Service Providers: Distribution by Company Size
- Table 16.15 Nanoparticle Formulation Service Providers: Distribution by Location of Headquarters
- Table 16.16 Nanoparticle Formulation Service Providers: Distribution by Company Size and Location of Headquarters
- Table 16.17 Nanoparticle Formulation Service Providers: Distribution by Location of Facilities
- Table 16.18 Nanoparticle Formulation Service Providers: Distribution by Type of Service Provider(s)
- Table 16.19 Nanoparticle Formulation Service Providers: Distribution by Type of Nanoparticle(s) Formulated
- Table 16.20 Nanoparticle Formulation Service Providers: Distribution by Type of Organic Nanoparticle(s) Formulated
- Table 16.21 Nanoparticle Formulation Service Providers: Distribution by Type of Inorganic Nanoparticle(s) Formulated
- Table 16.22 Nanoparticle Formulation Service Providers: Distribution by Type of Service Provider(s) and Type of Nanoparticle(s) Formulated
- Table 16.23 Nanoparticle Formulation Service Providers: Distribution by Type of Service(s) Offered
- Table 16.24 Nanoparticle Formulation Service Providers: Distribution by Company Size and Type of Service(s) Offered
- Table 16.25 Nanoparticle Formulation Service Providers: Distribution by Scale of Operation
- Table 16.26 Nanoparticle Formulation Service Providers: Distribution by Application Area(s)
- Table 16.27 Partnerships and Collaborations: Distribution by Year of Partnership
- Table 16.28 Partnerships and Collaborations: Distribution by Type of Partnership
- Table 16.29 Partnerships and Collaborations: Distribution by Year and Type of Partnership
- Table 16.30 Partnerships and Collaborations: Distribution by Type of Partner
- Table 16.31 Partnerships and Collaborations: Distribution by Location of Headquarters of Partner
- Table 16.32 Partnerships and Collaborations: Distribution by Type of Partnership and Location of Headquarters of Partner
- Table 16.33 Most Active Players: Distribution by Number of Partnerships
- Table 16.34 Partnerships and Collaborations: Distribution by Region
- Table 16.35 Partnerships and Collaborations: Distribution by Intercontinental and Intracontinental Agreements
- Table 16.36 Partnerships and Collaborations: Distribution by Local and International Agreements
- Table 16.37 Patent Analysis: Distribution by Type of Patent
- Table 16.38 Patent Analysis: Cumulative Distribution by Publication Year, since 2018
- Table 16.39 Patent Analysis: Distribution by Type of Patent and Publication Year
- Table 16.40 Patent Analysis: Distribution by Geography
- Table 16.41 Patent Analysis: Distribution by CPC Symbols
- Table 16.42 Leading Industry Players: Distribution by Number of Patents
- Table 16.43 Patent Analysis: Cumulative Distribution by Type of Organization
- Table 16.44 Leading Industrial Players: Benchmarking by Patent Characteristics (CPC Codes)
- Table 16.45 Patent Analysis: Distribution by Patent Age
- Table 16.46 Organic Nanoparticles: Number of Clinical Trials
- Table 16.47 Organic Nanoparticles: Extent of Innovation (Number of Patents)
- Table 16.48 Organic Nanoparticles: Trends in Research Activity (Number of Publications)
- Table 16.49 Inorganic Nanoparticles: Number of Clinical Trials
- Table 16.50 Inorganic Nanoparticles: Extent of Innovation (Number of Patents)
- Table 16.51 Inorganic Nanoparticles: Trends in Research Activity (Number of Publications)
- Table 16.52 Carbon-based Nanoparticles: Cumulative Number of Clinical Trials
- Table 16.53 Carbon-based Nanoparticles: Extent of Innovation (Number of Patents)
- Table 16.54 Carbon-based Nanoparticles: Trends in Research Activity (Number of Publications)
- Table 16.55 Global Nanoparticle Formulation Services Market, till 2035 (USD Billion)
- Table 16.56 Nanoparticle Formulation Services Market: Distribution by Type of Nanoparticle Formulated, Current Year and 2035
- Table 16.57 Nanoparticle Formulation Services Market: Distribution by Type of Organic Nanoparticle Formulated, Current Year and 2035
- Table 16.58 Nanoparticle Formulation Services Market for Polymeric Nanoparticles, till 2035 (USD Million)
- Table 16.59 Nanoparticle Formulation Services Market for Lipid Nanoparticles, till 2035 (USD Million)
- Table 16.60 Nanoparticle Formulation Services Market for Viral Nanoparticles, till 2035 (USD Million)
- Table 16.61 Nanoparticle Formulation Services Market for Protein-based Nanoparticles, till 2035 (USD Million)
- Table 16.62 Nanoparticle Formulation Services Market for Other Organic Nanoparticles, till 2035 (USD Million)
- Table 16.63 Nanoparticle Formulation Services Market for Inorganic Nanoparticles, till 2035 (USD Million)
- Table 16.64 Nanoparticle Formulation Services Market for Carbon-based Nanoparticles, till 2035 (USD Million)
- Table 16.65 Nanoparticle Formulation Services Market: Distribution by Scale of Operation, Current Year and 2035
- Table 16.66 Nanoparticle Formulation Services Market for Preclinical Operations, till 2035 (USD Million)
- Table 16.67 Nanoparticle Formulation Services Market for Clinical Operations, till 2035 (USD Million)
- Table 16.68 Nanoparticle Formulation Services Market for Commercial Operations, till 2035 (USD Million)
- Table 16.69 Nanoparticle Formulation Services Market: Distribution by Key Geographical Regions, Current Year and 2035
- Table 16.70 Nanoparticle Formulation Services Market in North America, till 2035 (USD Million)
- Table 16.71 Nanoparticle Formulation Services Market in Europe, till 2035 (USD Million)
- Table 16.72 Nanoparticle Formulation Services Market in Asia-Pacific, till 2035 (USD Million)
- Table 16.73 Nanoparticle Formulation Services Market in Middle East and North Africa, till 2035 (USD Million)
- Table 16.74 Nanoparticle Formulation Services Market in Latin America, till 2035 (USD Million)
List of Figures
- Figure 2.1 Executive Summary: Technology Landscape
- Figure 2.2 Executive Summary: Service Providers Landscape
- Figure 2.3 Executive Summary: Partnerships and Collaborations
- Figure 2.4 Executive Summary: Patent Analysis
- Figure 2.5 Executive Summary: Market Forecast and Opportunity Analysis
- Figure 3.1 Key Benefits and Limitations of Nanoparticle-based Systems
- Figure 3.2 Classification of Nanoparticles
- Figure 3.3 Applications of Nanoparticle-based Systems
- Figure 4.1 Nanoparticle Formulation Technologies: Distribution by Type of Nanoparticle(s) Formulated
- Figure 4.2 Nanoparticle Formulation Technologies: Distribution by Type of Organic Nanoparticle(s) Formulated
- Figure 4.3 Nanoparticle Formulation Technologies: Distribution by Type of Inorganic Nanoparticle(s) Formulated
- Figure 4.4 Nanoparticle Formulation Technologies: Distribution by Type of Molecule(s) Delivered
- Figure 4.5 Nanoparticle Formulation Technologies: Distribution by Therapeutic Area(s)
- Figure 4.6 Nanoparticle Formulation Technologies: Distribution by Compatible Dosage Form(s)
- Figure 4.7 Nanoparticle Formulation Technologies: Distribution by Route(s) of Administration
- Figure 4.8 Nanoparticle Formulation Technology Developers: Distribution by Year of Establishment
- Figure 4.9 Nanoparticle Formulation Technology Developers: Distribution by Company Size
- Figure 4.10 Nanoparticle Formulation Technology Developers: Distribution by Location of Headquarters
- Figure 4.11 Nanoparticle Formulation Technology Developers: Distribution by Company Size and Location of Headquarters
- Figure 4.12 Most Active Players: Distribution by Number of Technologies
- Figure 5.1 Nanoparticle Formulation Service Providers: Distribution by Year of Establishment
- Figure 5.2 Nanoparticle Formulation Service Providers: Distribution by Company Size
- Figure 5.3 Nanoparticle Formulation Service Providers: Distribution by Location of Headquarters
- Figure 5.4 Nanoparticle Formulation Service Providers: Distribution by Company Size and Location of Headquarters
- Figure 5.5 Nanoparticle Formulation Service Providers: Distribution by Location of Facilities
- Figure 5.6 Nanoparticle Formulation Service Providers: Distribution by Type of Service Provider(s)
- Figure 5.7 Nanoparticle Formulation Service Providers: Distribution by Type of Nanoparticle(s) Formulated
- Figure 5.8 Nanoparticle Formulation Service Providers: Distribution by Type of Organic Nanoparticle(s) Formulated
- Figure 5.9 Nanoparticle Formulation Service Providers: Distribution by Type of Inorganic Nanoparticle(s) Formulated
- Figure 5.10 Nanoparticle Formulation Service Providers: Distribution by Type of Service Provider(s) and Type of Nanoparticle(s) Formulated
- Figure 5.11 Nanoparticle Formulation Service Providers: Distribution by Type of Service(s) Offered
- Figure 5.12 Nanoparticle Formulation Service Providers: Distribution by Company Size and Type of Service(s) Offered
- Figure 5.13 Nanoparticle Formulation Service Providers: Distribution by Scale of Operation
- Figure 5.14 Nanoparticle Formulation Service Providers: Distribution by Application Area(s)
- Figure 6.1 Technology Competitiveness Analysis: Nanoparticle Formulation Technologies Offered by Small Players based in North America
- Figure 6.2 Technology Competitiveness Analysis: Nanoparticle Formulation Technologies Offered by Mid-sized and Large Players based in North America
- Figure 6.3 Technology Competitiveness Analysis: Nanoparticle Formulation Technologies Offered by Players based in Europe
- Figure 6.4 Technology Competitiveness Analysis: Nanoparticle Formulation Technologies Offered by Players based in Asia-Pacific, Middle East and North Africa, and Rest of the World
- Figure 7.1 Company Competitiveness Analysis: Nanoparticle Formulation Service Providers based in North America
- Figure 7.2 Company Competitiveness Analysis: Nanoparticle Formulation Service Providers based in Europe
- Figure 7.3 Company Competitiveness Analysis: Nanoparticle Formulation Service Providers based in Asia-Pacific, and Middle East and North Africa
- Figure 8.1 Ascension Sciences: Service Portfolio
- Figure 8.2 DIANT Pharma: Service Portfolio
- Figure 8.3 ExonanoRNA: Service Portfolio
- Figure 8.4 Nanoform: Service Portfolio
- Figure 8.5 NanoVation Therapeutics: Service Portfolio
- Figure 8.6 NanoVelos: Service Portfolio
- Figure 8.7 NTT Biopharma: Service Portfolio
- Figure 8.8 Organoid-X BioTech: Service Portfolio
- Figure 8.9 Vaxinano: Service Portfolio
- Figure 9.1 Partnerships and Collaborations: Distribution by Year of Partnership
- Figure 9.2 Partnerships and Collaborations: Distribution by Type of Partnership
- Figure 9.3 Partnerships and Collaborations: Distribution by Year and Type of Partnership
- Figure 9.4 Partnerships and Collaborations: Distribution by Type of Partner
- Figure 9.5 Partnerships and Collaborations: Distribution by Location of Headquarters of Partner
- Figure 9.6 Partnerships and Collaborations: Distribution by Type of Partnership and Location of Headquarters of Partner
- Figure 9.7 Most Active Players: Distribution by Number of Partnerships
- Figure 9.8 Partnerships and Collaborations: Distribution by Region
- Figure 9.9 Partnerships and Collaborations: Distribution by Intercontinental and Intracontinental Agreements
- Figure 9.10 Partnerships and Collaborations: Distribution by Local and International Agreements
- Figure 10.1 Patent Analysis: Distribution by Type of Patent
- Figure 10.2 Patent Analysis: Cumulative Distribution by Publication Year, since 2018
- Figure 10.3 Patent Analysis: Distribution by Type of Patent and Publication Year
- Figure 10.4 Patent Analysis: Distribution by Geography
- Figure 10.5 Patent Analysis: Distribution by CPC Symbols
- Figure 10.6 Leading Industry Players: Distribution by Number of Patents
- Figure 10.7 Patent Analysis: Cumulative Distribution by Type of Organization
- Figure 10.8 Leading Industrial Players: Benchmarking by Patent Characteristics (CPC Codes)
- Figure 10.9 Patent Analysis: Distribution by Patent Age
- Figure 10.10 Patent Analysis: Patent Valuation
- Figure 11.1 Organic Nanoparticles: Number of Clinical Trials
- Figure 11.2 Organic Nanoparticles: Extent of Innovation (Number of Patents)
- Figure 11.3 Organic Nanoparticles: Trends in Research Activity (Number of Publications)
- Figure 11.4 Nanoparticle Evaluation Framework: Organic Nanoparticles
- Figure 11.5 Inorganic Nanoparticles: Number of Clinical Trials
- Figure 11.6 Inorganic Nanoparticles: Extent of Innovation (Number of Patents)
- Figure 11.7 Inorganic Nanoparticles: Trends in Research Activity (Number of Publications)
- Figure 11.8 Nanoparticle Evaluation Framework: Inorganic Nanoparticles
- Figure 11.9 Carbon-based Nanoparticles: Cumulative Number of Clinical Trials
- Figure 11.10 Carbon-based Nanoparticles: Extent of Innovation (Number of Patents)
- Figure 11.11 Carbon-based Nanoparticles: Trend in Research Activity (Number of Publications)
- Figure 11.12 Nanoparticle Evaluation Framework: Carbon-based Nanoparticles
- Figure 11.13 Nanoparticle Evaluation Framework: Spider Web Representation
- Figure 12.1 Global Nanoparticle Formulation Services Market, till 2035 (USD Billion)
- Figure 12.2 Nanoparticle Formulation Services Market: Distribution by Type of Nanoparticle Formulated, Current Year and 2035
- Figure 12.3 Nanoparticle Formulation Services Market: Distribution by Type of Organic Nanoparticle Formulated, Current Year and 2035
- Figure 12.4 Nanoparticle Formulation Services Market for Polymeric Nanoparticles, till 2035 (USD Million)
- Figure 12.5 Nanoparticle Formulation Services Market for Lipid Nanoparticles, till 2035 (USD Million)
- Figure 12.6 Nanoparticle Formulation Services Market for Viral Nanoparticles, till 2035 (USD Million)
- Figure 12.7 Nanoparticle Formulation Services Market for Protein-based Nanoparticles, till 2035 (USD Million)
- Figure 12.8 Nanoparticle Formulation Services Market for Other Organic Nanoparticles, till 2035 (USD Million)
- Figure 12.9 Nanoparticle Formulation Services Market for Inorganic Nanoparticles, till 2035 (USD Million)
- Figure 12.10 Nanoparticle Formulation Services Market for Carbon-based Nanoparticles, till 2035 (USD Million)
- Figure 12.11 Nanoparticle Formulation Services Market: Distribution by Scale of Operation, Current Year and 2035
- Figure 12.12 Nanoparticle Formulation Services Market for Preclinical Operations, till 2035 (USD Million)
- Figure 12.13 Nanoparticle Formulation Services Market for Clinical Operations, till 2035 (USD Million)
- Figure 12.14 Nanoparticle Formulation Services Market for Commercial Operations, till 2035 (USD Million)
- Figure 12.15 Nanoparticle Formulation Services Market: Distribution by Key Geographical Regions, Current Year and 2035
- Figure 12.16 Nanoparticle Formulation Services Market in North America, till 2035 (USD Million)
- Figure 12.17 Nanoparticle Formulation Services Market in Europe, till 2035 (USD Million)
- Figure 12.18 Nanoparticle Formulation Services Market in Asia-Pacific, till 2035 (USD Million)
- Figure 12.19 Nanoparticle Formulation Services Market in Middle East and North Africa, till 2035 (USD Million)
- Figure 12.20 Nanoparticle Formulation Services Market in Latin America, till 2035 (USD Million)
- Figure 13.1 Licensing Agreements: Distribution of Financial Components
- Figure 14.1 Concluding Remarks: Overall Technology Landscape
- Figure 14.2 Concluding Remarks: Overall Service Providers Landscape
- Figure 14.3 Concluding Remarks: Partnerships and Collaborations
- Figure 14.4 Concluding Remarks: Patent Analysis
- Figure 14.5 Concluding Remarks: Market Forecast and Opportunity Analysis
目次
NANOPARTICLE FORMULATION MARKET: OVERVIEW
As per Roots Analysis, the global nanoparticle formulation market is estimated to grow from USD 5.1 billion in the current year to USD 15.1 billion by 2035, at a CAGR of 9.4% during the forecast period, till 2035.
The market sizing and opportunity analysis has been segmented across the following parameters:
Type of Nanoparticle Formulated
- Organic Nanoparticles
- Inorganic Nanoparticles
- Carbon-based Nanoparticles
Type of Organic Nanoparticle Formulated
- Polymeric Nanoparticles
- Lipid Nanoparticles
- Viral Nanoparticles
- Protein-based Nanoparticles
- Other Organic Nanoparticles
Scale of Operation
- Preclinical
- Clinical
- Commercial
Key Geographical Regions
- North America
- Europe
- Asia-Pacific
- Middle East and North Africa
- Latin America
NANOPARTICLE FORMULATION MARKET: GROWTH AND TRENDS
Having demonstrated a strong therapeutic potential across a myriad of diseases, nanoparticle-based drugs have emerged as a promising treatment alternative within a short span. In fact, given the current ongoing pace of research, experts believe that remarkable innovations in the field of nanoparticles (in terms of improvement in disease diagnosis and treatment specificity) are likely to revolutionize the pharma industry in the coming years. Furthermore, the recent initiatives focused on nanotechnology for the detection and control of vector-borne diseases, dialysis, and molecular imaging, have further fueled the demand for these nanoparticles. In addition, the nanoparticles can be engineered to achieve optimal delivery and overcome the limitations of biological barriers (systemic, microenvironmental and cellular) in the patient's body owing to their modifiable properties (such as size, shape, surface properties and charge). However, the complex interplay between nanoparticle properties and biological systems requires careful consideration to ensure the safety and efficacy of these nanoscale materials. Various stakeholders, such as contract research organizations, (CROs), and contract development and manufacturing organizations (CDOs / CDMOs) are likely to play a pivotal role in supporting researchers and drug developers to navigate the complexities associated with its design, development and manufacturing. By leveraging the multifaceted expertise in the field, contract service providers can help streamline the nanoparticle development process, reduce costs, and accelerate the translation of promising nanoparticles from lab scale to clinical scale. Driven by technological advancements and the rising demand for nanoparticle-based drugs, the nanoparticle formulation services market is anticipated to witness notable growth in the foreseen future.
NANOPARTICLE FORMULATION MARKET: KEY INSIGHTS
The report delves into the current state of the nanoparticle formulation market and identifies potential growth opportunities within the industry. Some key findings from the report include:
- Presently, more than 100 nanoparticle formulation technologies are being offered by companies across the globe in order to augment the development and manufacturing of nanoparticle-based drugs.
- Close to 80% of technologies are designed for the formulation of organic nanoparticles; of these, nearly 50% are intended for drug delivery via injectable route, primarily targeting oncological disorders.
- The current service providers landscape has over 80 companies offering a wide range of nanoparticle formulation services at various scales of operation.
- The market landscape features the presence of both well-established players and new entrants with the requisite expertise to develop / manufacture nanoparticle-based drugs for an extensive range of application areas.
- Owing to the rise in demand for nanoparticle-based formulations, service providers are continuously expanding their existing capabilities to enhance their respective service portfolios.
- A steady growth in the partnership activity has been observed in recent years; R&D agreements have been the most prominent type of partnership model adopted by players based in the US.
- More than 1,700 patents related to nanoparticle formulation and development have been filed by / granted to various organizations in order to protect intellectual property.
- The nanoparticle formulation services market is likely to grow at a CAGR of ~9% over the next decade, driven by revenues generated from commercial scale operation.
NANOPARTICLE FORMULATION MARKET: KEY SEGMENTS
Organic Nanoparticles are Likely to Dominate the Nanoparticle Formulation Market During the Forecast Period
Based on the type of nanoparticle, the market is segmented into organic nanoparticles, inorganic nanoparticles and carbon-based nanoparticles. At present, organic nanoparticles hold the maximum share of the nanoparticle formulation market. This trend is unlikely to change in the near future.
Protein-based Nanoparticles Segment is the Fastest Growing Segment of the Nanoparticle Formulation Market During the Forecast Period
Based on the type of organic nanoparticle, the market is segmented into polymeric nanoparticles, lipid nanoparticles, viral nanoparticles, protein-based nanoparticles, and other organic nanoparticles. It is worth highlighting that, currently, lipid nanoparticles hold a larger share of the nanoparticle formulation market. However, the nanoparticle formulation market for protein-based nanoparticles is likely to grow at a higher CAGR in the coming decade.
Commercial Operations Occupy the Largest Share of the Nanoparticle Formulation Market
Based on scales of operation, the market is segmented into preclinical, clinical and commercial scales. At present, commercial operations capture the maximum share of the nanoparticle formulation market. It is worth highlighting that the nanoparticle formulation market at the clinical scale is likely to grow at a higher CAGR in the near future.
North America Accounts for the Largest Share of the Market
Based on key geographical regions, the market is segmented into North America, Europe, Asia-Pacific and Rest of the world. The majority share is expected to be captured by service providers based in North America and Europe. It is worth highlighting that, over the years, the market in Asia-Pacific is expected to grow at a higher CAGR.
Example Players in the Nanoparticle Formulation Market
- Ascension Sciences
- DIANT Pharma
- ExonanoRNA
- Nanoform
- NanoVation Therapeutics
- NanoVelos
- NTT Biopharma
- Organoid-X BioTech
- Vaxinano
NANOPARTICLE FORMULATION MARKET: RESEARCH COVERAGE
- Market Sizing and Opportunity Analysis: The report features an in-depth analysis of the nanoparticle formulation market, focusing on key market segments, including [A] type of nanoparticle formulated, [B] type of organic nanoparticle formulated, [C] scale of operation and [D] key geographical regions.
- Market Landscape 1: A comprehensive evaluation of nanoparticle formulation technologies, considering various parameters, such as [A] type of nanoparticle(s) formulated, [B] type of molecule(s) delivered, [C] therapeutic area(s), [D] compatible dosage form(s) and [E] route(s) of administration. Further, the chapter provides information on various technology developers, along with analysis based on multiple parameters, such as [F] year of establishment, [G] company size, [H] location of headquarters and [I] most active players (in terms of number of technologies developed).
- Market Landscape 2: A comprehensive evaluation of nanoparticle formulation service providers, considering various parameters, such as [A] year of establishment, [B] company size (in terms of number of employees), [C] location of headquarters, [D] location of facilities, [E] type of service provider(s), [F] type of nanoparticle(s) formulated, [G] type of service(s) offered, [H] scale of operation and [I] application area(s).
- Technology Competitiveness: A comprehensive competitive analysis of nanoparticle formulation technologies, examining factors, such as [A] developer power, [B] technology strength and [C] technology applicability.
- Company Competitiveness: A comprehensive competitive analysis of nanoparticle formulation service providers, examining factors, such as [A] company strength and [B] service strength.
- Company Profiles: In-depth profiles of key industry players offering technologies and services for nanoparticle formulation across North America, Europe and Asia-Pacific, focusing on [A] company overviews, [B] technology portfolio, [C] service portfolio, [D] recent developments and [E] an informed future outlook.
- Partnerships and Collaborations: An analysis of partnerships established in this sector, since 2018, covering technology licensing agreements, research and development agreements, product development agreements, manufacturing agreements, mergers and acquisitions, technology integration agreements and other relevant agreements.
- Patent Analysis: Detailed analysis of various patents filed / granted related to nanoparticle formulation based on [A] publication year, [B] geographical region, [C] CPC symbols, [D] leading players (in terms of number of patents filled / granted) and [E] type of organization. It also includes a patent benchmarking analysis and a detailed valuation analysis.
- Nanoparticle Evaluation Framework: An insightful framework evaluating types of nanoparticles based on various parameters, such as [A] number of technologies, [B] nanoparticle efficacy, [C] number of clinical trials evaluating nanoparticle-based drugs, [D] extent of innovation, [E] trends in research activity and [F] current global competition. It also provides a value addition matrix for respective types of nanoparticles currently adopted by stakeholders.
- Case Study: A case study of the recent technology licensing agreements, along with information on deal amounts.
KEY QUESTIONS ANSWERED IN THIS REPORT
- How many companies are currently engaged in this market?
- Which are the leading companies in this market?
- What kind of partnership models are commonly adopted by industry stakeholders?
- What factors are likely to influence the evolution of this market?
- What is the current and future market size?
- What is the CAGR of this market?
- How is the current and future market opportunity likely to be distributed across key market segments?
REASONS TO BUY THIS REPORT
- The report provides a comprehensive market analysis, offering detailed revenue projections of the overall market and its specific sub-segments. This information is valuable to both established market leaders and emerging entrants.
- Stakeholders can leverage the report to gain a deeper understanding of the competitive dynamics within the market. By analyzing the competitive landscape, businesses can make informed decisions to optimize their market positioning and develop effective go-to-market strategies.
- The report offers stakeholders a comprehensive overview of the market, including key drivers, barriers, opportunities, and challenges. This information empowers stakeholders to stay abreast of market trends and make data-driven decisions to capitalize on growth prospects.
ADDITIONAL BENEFITS
- Complimentary PPT Insights Packs
- Complimentary Excel Data Packs for all Analytical Modules in the Report
- 10% Free Content Customization
- Detailed Report Walkthrough Session with Research Team
- Free Updated report if the report is 6-12 months old or older
TABLE OF CONTENTS
1. PREFACE
- 1.1. Introduction
- 1.2. Key Market Insights
- 1.3. Scope of the Report
- 1.4. Research Methodology
- 1.5. Frequently Asked Questions
- 1.6. Chapter Outlines
2. EXECUTIVE SUMMARY
3. INTRODUCTION
- 3.1. Chapter Overview
- 3.2. Introduction to Nanoparticles
- 3.3. Classification of Nanoparticles
- 3.3.1. Organic Nanoparticles
- 3.3.2. Inorganic Nanoparticles
- 3.3.3. Carbon-based Nanoparticles
- 3.4. Methods of Nanoparticle Formulation
- 3.5. Applications of Nanoparticle-based Systems
- 3.6. Challenges associated with Nanoparticle Formulation
- 3.7. Need for Outsourcing Nanoparticle Formulation
- 3.8 Concluding Remarks
4. TECHNOLOGY LANDSCAPE
- 4.1. Chapter Overview
- 4.2. Nanoparticle Formulation: Technology Landscape
- 4.2.1. Analysis by Type of Nanoparticle(s) Formulated
- 4.2.2. Analysis by Type of Organic Nanoparticle(s) Formulated
- 4.2.3. Analysis by Type of Inorganic Nanoparticle(s) Formulated
- 4.2.4. Analysis by Type of Molecule(s) Delivered
- 4.2.5. Analysis by Therapeutic Area(s)
- 4.2.6. Analysis by Compatible Dosage Form(s)
- 4.2.7. Analysis by Route(s) of Administration
- 4.3. Nanoparticle Formulation: Technology Developer Landscape
- 4.3.1. Analysis by Year of Establishment
- 4.3.2. Analysis by Company Size
- 4.3.3. Analysis by Location of Headquarters
- 4.3.4. Analysis by Company Size and Location of Headquarters
- 4.3.5. Most Active Players: Analysis by Number of Technologies
5. SERVICE PROVIDERS LANDSCAPE
- 5.1. Chapter Overview
- 5.2. Nanoparticle Formulation: Service Providers Landscape
- 5.2.1. Analysis by Year of Establishment
- 5.2.2. Analysis by Company Size
- 5.2.3. Analysis by Location of Headquarters
- 5.2.4. Analysis by Company Size and Location of Headquarters
- 5.2.5. Analysis by Location of Facilities
- 5.2.6. Analysis by Type of Service Provider(s)
- 5.2.7. Analysis by Type of Nanoparticle(s) Formulated
- 5.2.7.1. Analysis by Type of Organic Nanoparticle(s) Formulated
- 5.2.7.2. Analysis by Type of Inorganic Nanoparticle(s) Formulated
- 5.2.8. Analysis by Type of Service Provider(s) and Type of Nanoparticle(s) Formulated
- 5.2.9. Analysis by Service(s) Offered
- 5.2.10. Analysis by Company Size and Service(s) Offered
- 5.2.11. Analysis by Scale of Operation
- 5.2.12. Analysis by Application Area(s)
6. TECHNOLOGY COMPETITIVENESS ANALYSIS
- 6.1. Chapter Overview
- 6.2. Assumptions / Key Parameters
- 6.3. Methodology
- 6.4. Technology Competitiveness Analysis
- 6.4.1. Nanoparticle Formulation Technologies Offered by Players based in North America
- 6.4.1.1. Nanoparticle Formulation Technologies Offered by Small Players based in North America
- 6.4.1.2. Nanoparticle Formulation Technologies Offered by Mid-sized and Large Players based in North America
- 6.4.2. Nanoparticle Formulation Technologies Offered by Players based in Europe
- 6.4.3. Nanoparticle Formulation Technologies Offered by Players based in Asia-Pacific, Middle East and North Africa, and Rest of the World
- 6.4.1. Nanoparticle Formulation Technologies Offered by Players based in North America
7. COMPANY COMPETITIVENESS ANALYSIS
- 7.1. Chapter Overview
- 7.2. Assumptions / Key Parameters
- 7.3. Methodology
- 7.4. Company Competitiveness Analysis
- 7.4.1. Nanoparticle Formulation Service Providers based in North America
- 7.4.2. Nanoparticle Formulation Service Providers based in Europe
- 7.4.3. Nanoparticle Formulation Service Providers based in Asia-Pacific, Middle East and North Africa
8. COMPANY PROFILES
- 8.1. Chapter Overview
- 8.2. Ascension Sciences
- 8.2.1. Company Overview
- 8.2.2. Technology Portfolio
- 8.2.3. Service Portfolio
- 8.2.4. Recent Developments and Future Outlook
- 8.3. DIANT Pharma
- 8.3.1. Company Overview
- 8.3.2. Technology Portfolio
- 8.3.3. Service Portfolio
- 8.3.4. Recent Developments and Future Outlook
- 8.4. ExonanoRNA
- 8.4.1. Company Overview
- 8.4.2. Technology Portfolio
- 8.4.3. Service Portfolio
- 8.4.4. Recent Developments and Future Outlook
- 8.5. Nanoform
- 8.5.1. Company Overview
- 8.5.2. Technology Portfolio
- 8.5.3. Service Portfolio
- 8.5.4. Recent Developments and Future Outlook
- 8.6. NanoVation Therapeutics
- 8.6.1. Company Overview
- 8.6.2. Technology Portfolio
- 8.6.3. Service Portfolio
- 8.6.4. Recent Developments and Future Outlook
- 8.7. NanoVelos
- 8.7.1. Company Overview
- 8.7.2. Technology Portfolio
- 8.7.3. Service Portfolio
- 8.7.4. Recent Developments and Future Outlook
- 8.8. NTT Biopharma
- 8.8.1. Company Overview
- 8.8.2. Technology Portfolio
- 8.8.3. Service Portfolio
- 8.8.4. Recent Developments and Future Outlook
- 8.9. Organoid-X BioTech
- 8.9.1. Company Overview
- 8.9.2. Technology Portfolio
- 8.9.3. Service Portfolio
- 8.9.4. Recent Developments and Future Outlook
- 8.10. Vaxinano
- 8.10.1. Company Overview
- 8.10.2. Technology Portfolio
- 8.10.3. Service Portfolio
- 8.10.4. Recent Developments and Future Outlook
9. PARTNERSHIPS AND COLLABORATIONS
- 9.1. Chapter Overview
- 9.2. Partnership Models
- 9.3. Nanoparticle Formulation Technologies and Services: Partnerships and Collaborations
- 9.3.1. Analysis by Year of Partnership
- 9.3.2. Analysis by Type of Partnership
- 9.3.3. Analysis by Year and Type of Partnership
- 9.3.4. Analysis by Type of Partner
- 9.3.5. Analysis by Location of Headquarters of Partner
- 9.3.6. Analysis by Type of Partnership and Location of Headquarters of Partner
- 9.3.7. Most Active Players: Analysis by Number of Partnerships
- 9.3.8. Analysis by Geography
- 9.3.8.1. Intercontinental and Intracontinental Deals
- 9.3.8.2. Local and International Deals
10. PATENT ANALYSIS
- 10.1. Chapter Overview
- 10.2. Scope and Methodology
- 10.3. Nanoparticle Formulation Domain: Patent Analysis
- 10.3.1. Analysis by Publication Year
- 10.3.2. Analysis by Type of Patent and Publication Year
- 10.3.3. Analysis by Geography
- 10.3.4. Analysis by CPC Symbols
- 10.3.5. Analysis by Type of Organization
- 10.3.6. Leading Industry Players: Analysis by Number of Patents
- 10.4. Patent Benchmarking Analysis
- 10.4.1. Analysis by Patent Characteristics
- 10.5. Patent Valuation Analysis
11. NANOPARTCLE EVALUATION FRAMEWORK
- 11.1. Chapter Overview
- 11.2. Key Assumptions and Methodology
- 11.3. Organic Nanoparticles
- 11.3.1. Number of Clinical Trials
- 11.3.2 Extent of Innovation
- 11.3.3. Trends in Research Activity
- 11.3.4. Current Global Competition
- 11.3.5. Nanoparticle Evaluation Framework: Organic Nanoparticles
- 11.4. Inorganic Nanoparticles
- 11.4.1. Number of Clinical Trials
- 11.4.2 Extent of Innovation
- 11.4.3. Trends in Research Activity
- 11.4.4. Current Global Competition
- 11.4.5. Nanoparticle Evaluation Framework: Inorganic Nanoparticles
- 11.5. Carbon-based Nanoparticles
- 11.5.1. Number of Clinical Trials
- 11.5.2 Extent of Innovation
- 11.5.3. Trends in Research Activity
- 11.5.4. Current Global Competition
- 11.5.5. Nanoparticle Evaluation Framework: Carbon-based Nanoparticles
- 11.5.6. Nanoparticle Evaluation Framework: Concluding Remarks
12. MARKET FORECAST AND OPPORTUNITY ANALYSIS
- 12.1. Chapter Overview
- 12.2. Key Assumptions and Forecast Methodology
- 12.3. Global Nanoparticle Formulation Services Market, till 2035
- 12.4. Nanoparticle Formulation Services Market: Analysis by Type of Nanoparticle Formulated
- 12.4.1. Nanoparticle Formulation Services Market: Analysis by Type of Organic Nanoparticle Formulated
- 12.4.1.1. Nanoparticle Formulation Services Market for Polymeric Nanoparticles, till 2035
- 12.4.1.2. Nanoparticle Formulation Services Market for Lipid Nanoparticles, till 2035
- 12.4.1.3. Nanoparticle Formulation Services Market for Viral Nanoparticles, till 2035
- 12.4.1.4. Nanoparticle Formulation Services Market for Protein-based Nanoparticles, till 2035
- 12.4.1.5. Nanoparticle Formulation Services Market for Other Organic Nanoparticles, till 2035
- 12.4.2. Nanoparticle Formulation Services Market: Analysis by Inorganic Nanoparticle Formulated
- 12.4.3. Nanoparticle Formulation Services Market: Analysis by Carbon-based Nanoparticle Formulated
- 12.4.1. Nanoparticle Formulation Services Market: Analysis by Type of Organic Nanoparticle Formulated
- 12.5. Nanoparticle Formulation Services Market: Analysis by Scale of Operation
- 12.5.1. Nanoparticle Formulation Services Market for Preclinical Operations, till 2035
- 12.5.2. Nanoparticle Formulation Services Market for Clinical Operations, till 2035
- 12.5.3. Nanoparticle Formulation Services Market for Commercial Operations, till 2035
- 12.6. Nanoparticle Formulation Services Market: Analysis by Key Geographical Regions
- 12.6.1. Nanoparticle Formulation Services Market in North America, till 2035
- 12.6.2. Nanoparticle Formulation Services Market in Europe, till 2035
- 12.6.3. Nanoparticle Formulation Services Market in Asia-Pacific, till 2035
- 12.6.4. Nanoparticle Formulation Services Market in Middle East and North Africa, till 2035
- 12.6.5. Nanoparticle Formulation Services Market in Latin America, till 2035
13. CASE STUDY: TECHNOLOGY LICENSING DEALS
- 13.1. Chapter Overview
- 13.2. Recent Technology Licensing Deals
- 13.3. Concluding Remarks
14. CONCLUSION
15. EXECUTIVE INSIGHTS
16. APPENDIX 1: TABULATED DATA
17. APPENDIX 2: LIST OF COMPANIES AND ORGANIZATIONS
- 発行日
- 発行
- Roots Analysis
- ページ情報
- 英文 270 Pages
- 納期
- 即日から翌営業日


