|
|
市場調査レポート
商品コード
1624830
農業用生物製剤の世界市場:製品タイプ別、製品原料別、適用方法別、作物タイプ別、主要地域別:2035年までの業界動向と世界の予測Agricultural Biologicals Market by Type of Product, Source of Product, Mode of Application Type of Crop Treated and Key Geographical Regions : Industry Trends and Global Forecasts, Till 2035 |
||||||
|
|||||||
カスタマイズ可能
|
|||||||

| 農業用生物製剤の世界市場:製品タイプ別、製品原料別、適用方法別、作物タイプ別、主要地域別:2035年までの業界動向と世界の予測 |
|
出版日: 2025年01月06日
発行: Roots Analysis
ページ情報: 英文 308 Pages
納期: 即日から翌営業日
|

全表示
- 概要
- 図表
- 目次
世界の農業用生物製剤の市場規模は、2035年までの予測期間中に10%のCAGRで拡大し、現在の151億2,000万米ドルから2035年までに435億3,000万米ドルに成長すると予測されています。
農業用生物製剤は、土壌肥沃度、生物活性、植物の成長を高めるために使用される多様な製品(天然由来の微生物、植物抽出物、益虫、その他の有機物由来)を包含します。これらの製品は環境にやさしく、生態系に有害な残留物を残さず、農家や消費者の健康へのリスクを軽減します。農業用生物製剤は、従来の化学肥料や農薬への依存を減らすことを主な目的として、頻繁に使用されています。
例えば、Novozymesのような企業は、Bayerやこの分野で著名な他の企業と共同で、自社の微生物製品が農薬や肥料の効果的な代替品やサプリメントとして機能することを提案しています。この革命は、さまざまなレベルで利害関係者に利益をもたらすと予想されます。将来、消費者は、自分たちの食物が安全で持続可能な方法で栽培されたものであるという保証を得ることになると思われます。さらに、農家は再生農業のための新たなツールを利用できるようになり、気候変動と闘うための炭素隔離など、持続可能なサービスを通じて新たな収入源を開拓できるようになると予想されます。さらに、有機栽培作物への需要の高まり、持続可能な農業慣行への注目の高まり、天然資源の保護に後押しされ、農業用生物製剤市場は今後10年間で安定した成長を遂げると予想されます。
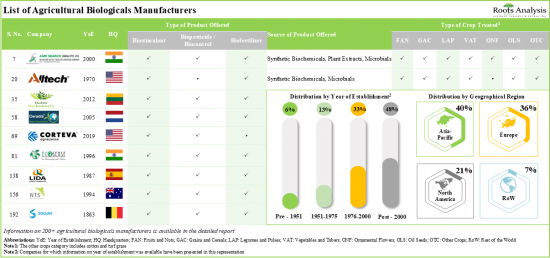
現在、200社以上が持続可能な農業のための農業生物学的製剤を提供しており、2000年以降には105社近くがこの分野に参入しています。
当レポートでは、世界の農業用生物製剤市場について調査し、市場の概要とともに、製品タイプ別、製品原料別、適用方法別、作物タイプ別、地域別の動向、および市場に参入する企業のプロファイルなどを提供しています。
目次
第1章 序文
第2章 調査手法
第3章 経済およびその他のプロジェクト特有の考慮事項
第4章 エグゼクティブサマリー
第5章 イントロダクション
第6章 市場情勢
第7章 企業競争力分析
- 章の概要
- 前提と主要なパラメータ
- 調査手法
- 企業競争力分析:北米の農業用生物製剤メーカー
- 企業競争力分析:欧州の農業用生物製剤メーカー
- 企業競争力分析:アジア太平洋およびその他の地域の農業用生物製剤メーカー
- 企業競争力分析:その他の農業用生物製剤メーカー
第8章 企業プロファイル
第9章 パートナーシップとコラボレーション
第10章 特許分析
第11章 ポーターのファイブフォース分析
第12章 市場への影響分析:促進要因、抑制要因、機会、課題
第13章 世界の農業用生物製剤市場
第14章 農業用生物製剤市場(製品タイプ別)
第15章 農業用生物製剤市場(製品原料別)
第16章 農業用生物製剤市場(適用方法別)
第17章 農業用生物製剤市場(作物タイプ別)
第18章 農業用生物製剤市場(地域別)
第19章 結論
第20章 エグゼクティブ洞察
- 章の概要
- Vegalab
- Acadian Plant Health
- Jiahe Biology
第21章 付録1:表形式のデータ
第22章 付録2:企業・団体一覧
List of Tables
- Table 6.1 List of Agricultural Biological Manufacturers
- Table 6.2 Agricultural Biological Manufacturers: Information on Type of Product Offered
- Table 6.3 Agricultural Biological Manufacturers: Information on Number of Products Offered, Source of Product Offered and Type of Product Formulation
- Table 6.4 Agricultural Biological Manufacturers: Information on Type of Crop Treated
- Table 6.5 Agricultural Biological Manufacturers: Information on Mode of Application
- Table 8.1 Agricultural Biological Providers: List of Companies Profiled
- Table 8.2 Andermatt: Company Overview
- Table 8.3 Andermatt: Agricultural Biologicals Portfolio
- Table 8.4 Andermatt: Recent Developments and Future Outlook
- Table 8.5 Certis Biologicals: Company Overview
- Table 8.6 Certis Biologicals: Agricultural Biologicals Portfolio
- Table 8.7 Certis Biologicals: Recent Developments and Future Outlook
- Table 8.8 Corteva Agriscience: Company Overview
- Table 8.9 Corteva Agriscience: Agricultural Biologicals Portfolio
- Table 8.10 Corteva Agriscience: Recent Developments and Future Outlook
- Table 8.11 Nutri-Tech Solutions: Company Overview
- Table 8.12 Nutri-Tech Solutions: Agricultural Biologicals Portfolio
- Table 8.13 Novozymes: Company Overview
- Table 8.14 Novozymes: Agricultural Biologicals Portfolio
- Table 8.15 Novozymes: Recent Developments and Future Outlook
- Table 8.16 ProFarm: Company Overview
- Table 8.17 ProFarm: Agricultural Biologicals Portfolio
- Table 8.18 ProFarm: Recent Developments and Future Outlook
- Table 8.19 SQM: Company Overview
- Table 8.20 SQM: Agricultural Biologicals Portfolio
- Table 8.21 SQM: Recent Developments and Future Outlook
- Table 8.22 UPL: Company Overview
- Table 8.23 UPL: Agricultural Biologicals Portfolio
- Table 8.24 UPL: Recent Developments and Future Outlook
- Table 8.25 Vegalab: Company Overview
- Table 8.26 Vegalab: Agricultural Biologicals Portfolio
- Table 8.27 AMVAC: Company Overview
- Table 8.28 AMVAC: Agricultural Biologicals Portfolio
- Table 8.29 BASF: Company Overview
- Table 8.30 BASF: Agricultural Biologicals Portfolio
- Table 8.31 Bayer: Company Overview
- Table 8.32 Bayer: Agricultural Biologicals Portfolio
- Table 8.33 BioSafe Systems: Company Overview
- Table 8.34 BioSafe Systems: Agricultural Biologicals Portfolio
- Table 8.35 Brandt: Company Overview
- Table 8.36 Brandt: Agricultural Biologicals Portfolio
- Table 8.37 Chr. Hansen: Company Overview
- Table 8.38 Chr. Hansen: Agricultural Biologicals Portfolio
- Table 8.39 FBSciences: Company Overview
- Table 8.40 FBSciences: Agricultural Biologicals Portfolio
- Table 8.41 Grow Indigo: Company Overview
- Table 8.42 Grow Indigo: Agricultural Biologicals Portfolio
- Table 8.43 Koppert: Company Overview
- Table 8.44 Koppert: Agricultural Biologicals Portfolio
- Table 8.45 Lallemand: Company Overview
- Table 8.46 Lallemand: Agricultural Biologicals Portfolio
- Table 8.47 PI Industries: Company Overview
- Table 8.48 PI Industries: Agricultural Biologicals Portfolio
- Table 8.49 Stoller: Company Overview
- Table 8.50 Stoller: Agricultural Biologicals Portfolio
- Table 8.51 Syngenta: Company Overview
- Table 8.52 Syngenta: Agricultural Biologicals Portfolio
- Table 8.53 Valent Biosciences: Company Overview
- Table 8.54 Valent Biosciences: Agricultural Biologicals Portfolio
- Table 8.55 Verdisian Life Sciences: Company Overview
- Table 8.56 Verdisian Life Sciences: Agricultural Biologicals Portfolio
- Table 9.1 Agricultural Biologicals Market: List of Partnerships and Collaborations, since 2020
- Table 10.1 Patent Analysis: Top CPC Sections
- Table 10.2 Patent Analysis: Top CPC Symbols
- Table 10.3 Patent Analysis: Top CPC Codes
- Table 10.4 Patent Analysis: Summary of Benchmarking Analysis
- Table 10.5 Patent Analysis: Categorization based on Weighted Valuation Scores
- Table 10.6 Patent Portfolio: List of Leading Patents (by Highest Relative Valuation)
- Table 10.7 Patent Portfolio: List of Leading Patents (by Number of Citations)
- Table 20.1 Vegalab: Company Snapshot
- Table 20.2 Acadian Plant Health: Company Snapshot
- Table 20.3 Jiahe Biology: Company Snapshot
- Table 21.1 Agricultural Biologicals Manufacturers: Distribution by Year of Establishment
- Table 21.2 Agricultural Biological Manufacturers: Distribution by Company Size
- Table 21.3 Agricultural Biological Manufacturers: Distribution by Year of Establishment and Company Size
- Table 21.4 Agricultural Biological Manufacturers: Distribution by Location of Headquarters (Region-wise)
- Table 21.5 Agricultural Biological Manufacturers: Distribution by Location of Headquarters (Country-wise)
- Table 21.6 Agricultural Biological Manufacturers: Distribution by Company Size and Location of Headquarters (Region-wise)
- Table 21.7 Agricultural Biological Manufacturers: Distribution by Type of Product Offered
- Table 21.8 Agricultural Biological Manufacturers: Distribution by Type of Biostimulant Offered
- Table 21.9 Agricultural Biological Manufacturers: Distribution by Type of Biopesticide / Biocontrol Offered
- Table 21.10 Agricultural Biological Manufacturers: Distribution by Type of Biofertilizer Offered
- Table 21.11 Agricultural Biological Manufacturers: Distribution by Company Size and Type of Product Offered
- Table 21.12 Agricultural Biological Manufacturers: Distribution by Source of Product Offered
- Table 21.13 Agricultural Biological Manufacturers: Distribution by Type of Product Formulation
- Table 21.14 Agricultural Biological Manufacturers: Distribution by Type of Crop Treated
- Table 21.15 Agricultural Biological Manufacturers: Distribution by Mode of Application
- Table 21.16 Agricultural Biological Manufacturers: Distribution by Number of Products Offered
- Table 21.17 Most Active Players: Distribution by the Number of Products Offered
- Table 21.18 Corteva Agriscience: Annual Revenues, FY 2019 Onwards (USD Million)
- Table 21.19 Novozymes: Annual Revenues, FY 2019 Onwards (DKK Million)
- Table 21.20 UPL: Annual Revenues, FY 2019 Onwards (INR Crore)
- Table 21.21 Partnerships and Collaborations: Distribution by Year of Partnership, since 2020
- Table 21.22 Partnerships and Collaborations: Distribution by Type of Partnership
- Table 21.23 Partnerships and Collaborations: Distribution by Year and Type of Partnership
- Table 21.24 Partnerships and Collaborations: Distribution by Type of Partnership and Company Size
- Table 21.25 Partnerships and Collaborations: Distribution by Focus Area of Partnerships
- Table 21.26 Partnerships and Collaborations: Distribution by Type of Partner
- Table 21.27 Most Active Players: Distribution by Number of Partnerships
- Table 21.28 Partnerships and Collaborations: Local and International Agreements
- Table 21.29 Partnerships and Collaborations: Intracontinental and Intercontinental Agreements
- Table 21.30 Patent Analysis: Distribution by Type of Patent
- Table 21.31 Patent Analysis: Distribution by Patent Publication Year, since 2019
- Table 21.32 Patent Analysis: Distribution by Patent Application Year
- Table 21.33 Patent Analysis: Distribution of Granted Patents and Patent Applications by Publication Year, since 2019
- Table 21.34 Patent Analysis: Distribution by Patent Jurisdiction (Region-wise)
- Table 21.35 Patent Analysis: Distribution by Patent Jurisdiction (Country-wise)
- Table 21.36 Patent Analysis: Distribution by CPC Symbols
- Table 21.37 Patent Analysis: Cumulative Year-wise Distribution by Type of Applicant, since 2019
- Table 21.38 Leading Industry Players: Distribution by Number of Patents
- Table 21.39 Leading Non-Industry Players: Distribution by Number of Patents
- Table 21.40 Leading Individual Assignees: Distribution by Number of Patents
- Table 21.41 Patent Benchmarking Analysis: Distribution of Leading Industry Player by Patent Characteristics (CPC Codes)
- Table 21.42 Patent Analysis: Distribution by Patent Age
- Table 21.43 Agricultural Biologicals: Patent Valuation
- Table 21.44 Global Agricultural Biologicals Market, Historical Trends (since 2019) (USD Billion)
- Table 21.45 Global Agricultural Biologicals Market, Forecasted Estimates (till 2035): Conservative, Base and Optimistic Scenarios (USD Billion)
- Table 21.46 Agricultural Biologicals Market: Distribution by Type of Product, 2019, 2023 and 2035 (USD Billion)
- Table 21.47 Biopesticides / Biocontrols Market: Historical Trends (since 2019) (USD Billion)
- Table 21.48 Biopesticides / Biocontrols Market: Forecasted Estimates (till 2035), Conservative, Base and Optimistic Scenarios (USD Billion)
- Table 21.49 Biofertilizers Market: Historical Trends (since 2019) (USD Billion)
- Table 21.50 Biofertilizers Market: Forecasted Estimates (till 2035), Conservative, Base and Optimistic Scenarios (USD Billion)
- Table 21.51 Biostimulants Market: Historical Trends (since 2019) (USD Billion)
- Table 21.52 Biostimulants Market: Forecasted Estimates (till 2035), Conservative, Base and Optimistic Scenarios (USD Billion)
- Table 21.53 Agricultural Biologicals Market: Distribution by Source of Product, 2019, 2023 and 2035 (USD Billion)
- Table 21.54 Agricultural Biologicals Market for Microbes: Historical Trends (since 2019) (USD Billion)
- Table 21.55 Agricultural Biologicals Market for Microbes: Forecasted Estimates (till 2035), Conservative, Base and Optimistic Scenarios (USD Billion)
- Table 21.56 Agricultural Biologicals Market for Plant Extracts: Historical Trends (since 2019) (USD Billion)
- Table 21.57 Agricultural Biologicals Market for Plant Extracts: Forecasted Estimates (till 2035), Conservative, Base and Optimistic Scenarios (USD Billion)
- Table 21.58 Agricultural Biologicals Market for Other Sources: Historical Trends (since 2019) (USD Billion)
- Table 21.59 Agricultural Biologicals Market for Other Sources: Forecasted Estimates (till 2035), Conservative, Base and Optimistic Scenarios (USD Billion)
- Table 21.60 Agricultural Biologicals Market: Distribution by Mode of Application, 2019, 2023 and 2035 (USD Billion)
- Table 21.61 Agricultural Biologicals Market for Foliar Sprays: Historical Trends (since 2019) (USD Billion)
- Table 21.62 Agricultural Biologicals Market for Foliar Sprays: Forecasted Estimates (till 2035), Conservative, Base and Optimistic Scenarios (USD Billion)
- Table 21.63 Agricultural Biologicals Market for Seed Treatments: Historical Trends (since 2019) (USD Billion)
- Table 21.64 Agricultural Biologicals Market for Seed Treatments: Forecasted Estimates (till 2035), Conservative, Base and Optimistic Scenarios (USD Billion)
- Table 21.65 Agricultural Biologicals Market for Soil Treatments: Historical Trends (since 2019) (USD Billion)
- Table 21.66 Agricultural Biologicals Market for Soil Treatments: Forecasted Estimates (till 2035), Conservative, Base and Optimistic Scenarios (USD Billion)
- Table 21.67 Agricultural Biologicals Market for Other Application Methods: Historical Trends (since 2019) (USD Billion)
- Table 21.68 Agricultural Biologicals Market for Other Application Methods: Forecasted Estimates (till 2035), Conservative, Base and Optimistic Scenarios (USD Billion)
- Table 21.69 Agricultural Biologicals Market: Distribution by Type of Crop Treated, 2019, 2023 and 2035 (USD Billion)
- Table 21.70 Agricultural Biologicals Market for Cereals and Pulses: Historical Trends (since 2019) (USD Billion)
- Table 21.71 Agricultural Biologicals Market for Cereals and Pulses: Forecasted Estimates (till 2035), Conservative, Base and Optimistic Scenarios (USD Billion)
- Table 21.72 Agricultural Biologicals Market for Fruits and Nuts: Historical Trends (since 2019) (USD Billion)
- Table 21.73 Agricultural Biologicals Market for Fruits and Nuts: Forecasted Estimates (till 2035), Conservative, Base and Optimistic Scenarios (USD Billion)
- Table 21.74 Agricultural Biologicals Market for Oilseeds: Historical Trends (since 2019) (USD Billion)
- Table 21.75 Agricultural Biologicals Market for Oilseeds: Forecasted Estimates (till 2035), Conservative, Base and Optimistic Scenarios (USD Billion)
- Table 21.76 Agricultural Biologicals Market for Green Fodder, Vegetables and Tubers: Historical Trends (since 2019) (USD Billion)
- Table 21.77 Agricultural Biologicals Market for Green Fodder, Vegetables and Tubers: Forecasted Estimates (till 2035), Conservative, Base and Optimistic Scenarios (USD Billion)
- Table 21.78 Agricultural Biologicals Market for Industrial Crops, Textile Crops and Others: Historical Trends (since 2019) (USD Billion)
- Table 21.79 Agricultural Biologicals Market for Industrial Crops, Textile Crops and Others: Forecasted Estimates (till 2035), Conservative, Base and Optimistic Scenarios (USD Billion)
- Table 21.80 Agricultural Biologicals Market: Distribution by Key Geographical Regions, 2019, 2023 and 2035 (USD Billion)
- Table 21.81 Agricultural Biologicals Market for North America: Historical Trends (since 2019) (USD Billion)
- Table 21.82 Agricultural Biologicals Market for North America: Forecasted Estimates (till 2035), Conservative, Base and Optimistic Scenarios (USD Billion)
- Table 21.83 Agricultural Biologicals Market for Europe: Historical Trends (since 2019) (USD Billion)
- Table 21.84 Agricultural Biologicals Market for Europe: Forecasted Estimates (till 2035), Conservative, Base and Optimistic Scenarios (USD Billion)
- Table 21.85 Agricultural Biologicals Market for Asia-Pacific: Historical Trends (since 2019) (USD Billion)
- Table 21.86 Agricultural Biologicals Market for Asia-Pacific: Forecasted Estimates (till 2035), Conservative, Base and Optimistic Scenarios (USD Billion)
- Table 21.87 Agricultural Biologicals Market for Latin America: Historical Trends (since 2019) (USD Billion)
- Table 21.88 Agricultural Biologicals Market for Latin America: Forecasted Estimates (till 2035), Conservative, Base and Optimistic Scenarios (USD Billion)
- Table 21.89 Agricultural Biologicals Market for Middle East and North Africa: Historical Trends (since 2019) (USD Billion)
- Table 21.90 Agricultural Biologicals Market for Middle East and North Africa: Forecasted Estimates (till 2035), Conservative, Base and Optimistic Scenarios (USD Billion)
List of Figures
- Figure 2.1 Research Methodology: Research Assumptions
- Figure 2.2 Research Methodology: Project Methodology
- Figure 2.3 Research Methodology: Forecast Methodology
- Figure 2.4 Research Methodology: Robust Quality Control
- Figure 2.5 Research Methodology: Key Market Segmentations
- Figure 3.1 Lessons Learnt from Past Recessions
- Figure 4.1 Executive Summary: Agricultural Biologicals Market Landscape
- Figure 4.2 Executive Summary: Partnerships and Collaborations
- Figure 4.3 Executive Summary: Patent Analysis
- Figure 4.4 Executive Summary: Market Forecast and Opportunity Analysis
- Figure 5.1 Differences between Conventional and Sustainable Agricultural Practices
- Figure 5.2 Types of Agricultural Biologicals
- Figure 5.3 Types of Biostimulants
- Figure 5.4 Types of Biopesticides
- Figure 5.5 Types of Biofertilizers
- Figure 5.6 Advantages of Agricultural Biologicals
- Figure 6.1 Agricultural Biological Manufacturers: Distribution by Year of Establishment
- Figure 6.2 Agricultural Biological Manufacturers: Distribution by Company Size
- Figure 6.3 Agricultural Biological Manufacturers: Distribution by Year of Establishment and Company Size
- Figure 6.4 Agricultural Biological Manufacturers: Distribution by Location of Headquarters (Region)
- Figure 6.5 Agricultural Biological Manufacturers: Distribution by Location of Headquarters (Country)
- Figure 6.6 Agricultural Biological Manufacturers: Distribution by Company Size and Location of Headquarters (Region)
- Figure 6.7 Agricultural Biological Manufacturers: Distribution by Type of Product Offered
- Figure 6.8 Agricultural Biological Manufacturers: Distribution by Type of Biostimulant Offered
- Figure 6.9 Agricultural Biological Manufacturers: Distribution by Type of Biopesticide / Biocontrol Offered
- Figure 6.10 Agricultural Biological Manufacturers: Distribution by Type of Biofertilizer Offered
- Figure 6.11 Agricultural Biological Manufacturers: Distribution by Company Size and Type of Product Offered
- Figure 6.12 Agricultural Biological Manufacturers: Distribution by Source of Product Offered
- Figure 6.13 Agricultural Biological Manufacturers: Distribution by Type of Product Formulation
- Figure 6.14 Agricultural Biological Manufacturers: Distribution by Type of Crop Treated
- Figure 6.15 Agricultural Biological Manufacturers: Distribution by Mode of Application
- Figure 6.16 Agricultural Biological Manufacturers: Distribution by Number of Products Offered
- Figure 6.17 Most Active Players: Distribution by the Number of Products Offered
- Figure 7.1 Company Competitiveness Analysis: Very Small and Small Companies in North America
- Figure 7.2 Company Competitiveness Analysis: Mid-sized Companies in North America
- Figure 7.3 Company Competitiveness Analysis: Large and Very Large Companies in North America
- Figure 7.4 Company Competitiveness Analysis: Very Small and Small Companies in Europe
- Figure 7.5 Company Competitiveness Analysis: Mid-Sized Companies in Europe
- Figure 7.6 Company Competitiveness Analysis: Large and Very Large Companies in Europe
- Figure 7.7 Company Competitiveness Analysis: Very Small and Small Companies in Asia-Pacific and Rest of the World
- Figure 7.8 Company Competitiveness Analysis: Mid-sized Companies in Asia-Pacific and Rest of the World
- Figure 7.9 Company Competitiveness Analysis: Large and Very Large Companies in Asia-Pacific and Rest of the World
- Figure 7.10 Company Competitiveness Analysis: Other Agricultural Biological Manufacturers
- Figure 8.1 Corteva Agriscience: Annual Revenues, FY 2019 Onwards (USD Million)
- Figure 8.2 Novozymes: Annual Revenues, FY 2019 Onwards (DKK Million)
- Figure 8.3 UPL: Annual Revenues, FY 2019 Onwards (INR Crore)
- Figure 9.1 Partnerships and Collaborations: Distribution by Year of Partnership, since 2020
- Figure 9.2 Partnerships and Collaborations: Distribution by Type of Partnership
- Figure 9.3 Partnerships and Collaborations: Distribution by Year and Type of Partnership
- Figure 9.4 Partnerships and Collaborations: Distribution by Type of Partnership and Company Size
- Figure 9.5 Partnerships and Collaborations: Distribution by Focus Area of Partnerships
- Figure 9.6 Partnerships and Collaborations: Distribution by Type of Partner
- Figure 9.7 Most Active Players: Distribution by Number of Partnerships
- Figure 9.8 Partnerships and Collaborations: Local and International Agreements
- Figure 9.9 Partnerships and Collaborations: Intracontinental and Intercontinental Agreements
- Figure 10.1 Patent Analysis: Distribution by Type of Patent
- Figure 10.2 Patent Analysis: Distribution by Patent Publication Year, since 2019
- Figure 10.3 Patent Analysis: Distribution by Patent Application Year
- Figure 10.4 Patent Analysis: Distribution of Granted Patents and Patent Applications by Publication Year, since 2019
- Figure 10.5 Patent Analysis: Distribution by Patent Jurisdiction (Region-wise)
- Figure 10.6 Patent Analysis: Distribution by Patent Jurisdiction (Country-wise)
- Figure 10.7 Patent Analysis: Distribution by CPC Symbols
- Figure 10.8 Patent Analysis: Cumulative Year-wise Distribution by Type of Applicant, since 2019
- Figure 10.9 Leading Industry Players: Distribution by Number of Patents
- Figure 10.10 Leading Non-Industry Players: Distribution by Number of Patents
- Figure 10.11 Leading Individual Assignees: Distribution by Number of Patents
- Figure 10.12 Patent Benchmarking Analysis: Distribution of Leading Industry Player by Patent Characteristics (CPC Codes)
- Figure 10.13 Patent Analysis: Distribution by Patent Age
- Figure 10.14 Agricultural Biologicals: Patent Valuation
- Figure 11.1 Porter's Five Forces: Key Parameters
- Figure 11.2 Threats of New Entrants: Key Factors
- Figure 11.3 Bargaining Power of End-Users: Key Factors
- Figure 11.4 Bargaining Power of Product Developers: Key Factors
- Figure 11.5 Threats of Substitute Products: Key Factors
- Figure 11.6 Rivalry Among Existing Competitors: Key Factors
- Figure 11.7 Porter's Five Forces: Concluding Remarks
- Figure 12.1 Market Impact Analysis: Drivers, Restraints, Opportunities and Challenges
- Figure 13.1 Global Agricultural Biologicals Market, Historical Trends (since 2019) and Forecasted Estimates (till 2035): Base Scenario (USD Billion)
- Figure 13.2 Global Agricultural Biologicals Market, Forecasted Estimates (till 2035), Conservative Scenario (USD Billion)
- Figure 13.3 Global Agricultural Biologicals Market, Forecasted Estimates (till 2035), Optimistic Scenario (USD Billion)
- Figure 14.1 Agricultural Biologicals Market: Distribution by Type of Product, 2019, 2023 and 2035 (USD Billion)
- Figure 14.2 Biopesticides / Biocontrols Market: Historical Trends (since 2019) and Forecasted Estimates (till 2035) (USD Billion)
- Figure 14.3 Biofertilizers Market: Historical Trends (since 2019) and Forecasted Estimates (till 2035) (USD Billion)
- Figure 14.4 Biostimulants Market: Historical Trends (since 2019) and Forecasted Estimates (till 2035) (USD Billion)
- Figure 15.1 Agricultural Biologicals Market: Distribution by Source of Product, 2019, 2023 and 2035 (USD Billion)
- Figure 15.2 Agricultural Biologicals Market for Microbes: Historical Trends (since 2019) and Forecasted Estimates (till 2035) (USD Billion)
- Figure 15.3 Agricultural Biologicals Market for Plant Extracts: Historical Trends (since 2019) and Forecasted Estimates (till 2035) (USD Billion)
- Figure 15.4 Agricultural Biologicals Market for Other Sources: Historical Trends (since 2019) and Forecasted Estimates (till 2035) (USD Billion)
- Figure 16.1 Agricultural Biologicals Market: Distribution by Mode of Application, 2019, 2023 and 2035 (USD Billion)
- Figure 16.2 Agricultural Biologicals Market for Foliar Sprays: Historical Trends (since 2019) and Forecasted Estimates (till 2035) (USD Billion)
- Figure 16.3 Agricultural Biologicals Market for Seed Treatments: Historical Trends (since 2019) and Forecasted Estimates (till 2035) (USD Billion)
- Figure 16.4 Agricultural Biologicals Market for Soil Treatments: Historical Trends (since 2019) and Forecasted Estimates (till 2035) (USD Billion)
- Figure 16.5 Agricultural Biologicals Market for Other Application Methods: Historical Trends (since 2019) and Forecasted Estimates (till 2035) (USD Billion)
- Figure 17.1 Agricultural Biologicals Market: Distribution by Type of Crop Treated, 2019, 2023 and 2035 (USD Billion)
- Figure 17.2 Agricultural Biologicals Market for Cereals and Pulses: Historical Trends (since 2019) and Forecasted Estimates (till 2035) (USD Billion)
- Figure 17.3 Agricultural Biologicals Market for Fruits and Nuts: Historical Trends (since 2019) and Forecasted Estimates (till 2035) (USD Billion)
- Figure 17.4 Agricultural Biologicals Market for Oilseeds: Historical Trends (since 2019) and Forecasted Estimates (till 2035) (USD Billion)
- Figure 17.5 Agricultural Biologicals Market for Green Fodder, Vegetables and Tubers: Historical Trends (since 2019) and Forecasted Estimates (till 2035) (USD Billion)
- Figure 17.6 Agricultural Biologicals Market for Industrial Crops, Textile Crops and Others: Historical Trends (since 2019) and Forecasted Estimates (till 2035) (USD Billion)
- Figure 18.1 Agricultural Biologicals Market: Distribution by Key Geographical Regions, 2019, 2023 and 2035 (USD Billion)
- Figure 18.2 Agricultural Biologicals Market for North America: Historical Trends (since 2019) and Forecasted Estimates (till 2035) (USD Billion)
- Figure 18.3 Agricultural Biologicals Market for Europe: Historical Trends (since 2019) and Forecasted Estimates (till 2035) (USD Billion)
- Figure 18.4 Agricultural Biologicals Market for Asia-Pacific: Historical Trends (since 2019) and Forecasted Estimates (till 2035) (USD Billion)
- Figure 18.5 Agricultural Biologicals Market for Latin America: Historical Trends (since 2019) and Forecasted Estimates (till 2035) (USD Billion)
- Figure 18.6 Agricultural Biologicals Market for Middle East and North Africa: Historical Trends (since 2019) and Forecasted Estimates (till 2035) (USD Billion)
- Figure 19.1 Conclusion: Agricultural Biologicals Market Landscape
- Figure 19.2 Conclusion: Partnerships and Collaborations
- Figure 19.3 Conclusion: Patent Analysis
- Figure 19.4 Conclusion: Porter's Five Forces Analysis
- Figure 19.5 Conclusion: Market Forecast and Opportunity Analysis
AGRICULTURAL BIOLOGICALS MARKET: OVERVIEW
As per Roots Analysis, the global agricultural biologicals market is estimated to grow from USD 15.12 billion in the current year to USD 43.53 billion by 2035, at a CAGR of 10% during the forecast period, till 2035.
The market sizing and opportunity analysis has been segmented across the following parameters:
Type of Product
- Biopesticide / Biocontrol
- Biofertilizer
- Biostimulant
Source of Product
- Microbes
- Plant Extracts
- Other Sources
Mode of Application
- Foliar Sprays
- Seed Treatments
- Soil Treatments
- Other Application Methods
Type of Crop Treated
- Cereals and Pulses
- Fruits and Nuts
- Oilseeds
- Green Fodder, Vegetables and Tubers
- Industrial Crops, Textile Crops and Others
Key Geographical Regions
- North America
- Europe
- Asia-Pacific
- Rest of the World
AGRICULTURAL BIOLOGICALS MARKET: GROWTH AND TRENDS
Agricultural biologicals encompass a diverse array of products (derived from naturally occurring microorganisms, plant extracts, beneficial insects or other organic matter) used for enhancing soil fertility, biological activity, and the growth of plants. These products are environmentally friendly, leave no harmful residues in the ecosystem and mitigate risks to the health of farmers and consumers. Agricultural biologicals are frequently used with the primary objective of reducing the reliance on conventional chemical fertilizers and agrochemicals. For instance, companies like Novozymes, in collaboration with Bayer and other prominent companies in this domain, propose that their microbial products can serve as an effective alternative or supplement for agrochemicals and fertilizers. This revolution is expected to benefit stakeholders at various levels. In the future, consumers are likely to gain assurance that their food is cultivated in a safe and sustainable manner. Additionally, farmers are anticipated to have access to new tools for regenerative agriculture and can explore additional revenue streams through sustainable services, such as carbon sequestration to combat climate change. Further, driven by the rising demand for organically grown crops, growing focus on sustainable agricultural practices and preservation of natural resources, the agricultural biologicals market is anticipated to witness steady growth in the coming decade.
AGRICULTURAL BIOLOGICALS MARKET: KEY INSIGHTS
The report delves into the current state of the agricultural biologicals market and identifies potential growth opportunities within the industry. Some key findings from the report include:
1. Presently, over 200 companies claim to offer agricultural biologicals for sustainable farming; close to 105 such players have entered this domain post - 2000.
2. 40% of the agricultural biological providers offer all three kinds of products for various types of crops; over 85% of such players provide these products as foliar sprays.
3. In pursuit of building a competitive edge in this field, stakeholders are actively upgrading their existing capabilities and adding new competencies in order to enhance their respective product portfolios.
4. The growing interest in this domain is evident from the rise in partnership activity; in fact, 43 partnership deals related to agricultural biologicals were inked recently.
5. Since 2019, more than 1,300 patents have been filed / granted by various stakeholders in order to protect the intellectual property generated within this domain.
6. Driven by the increasing pace of innovation and partnership activity, the market for agricultural biologicals is poised to witness steady growth in the foreseeable future.
7. As a result of the growing demand for organic food products, the agricultural biologicals market is likely to grow at a CAGR of ~10% over the coming years.
8. The agricultural biologicals market is expected to be well distributed across different type of products, source of products, modes of application, type of crops treated and key geographical regions.
AGRICULTURAL BIOLOGICALS MARKET: KEY SEGMENTS
Currently, Biopesticide / Biocontrol Occupies the Largest Share of the Agricultural Biologicals Market
Based on the type of product, the market is segmented into biopesticides / biocontrols, biofertilizers and biostimulants. At present, biopesticide / biocontrol holds the maximum share of the agricultural biologicals market. It is worth highlighting that the agricultural biologicals market for biofertilizer is likely to grow at a relatively higher CAGR.
Plant Extract is the Fastest Growing Segment of the Agricultural Biologicals Market During the Forecast Period
Based on the source of product, the market is segmented into microbes, plant extracts and other sources. At present, microbes hold the maximum share within the agricultural biologicals market. This trend is unlikely to change in the near future.
Foliar Sprays is Likely to Dominate the Agricultural Biologicals Market During the Forecast Period
Based on the mode of application, the market is segmented into foliar sprays, seed treatments, soil treatments and other application methods. Currently, foliar spray holds the maximum share of the agricultural biologicals market. This trend is likely to remain the same in the forthcoming years. It is worth highlighting that the agricultural biologicals market for seed treatments is likely to grow at a relatively higher CAGR.
Currently, Cereals and Pulses Occupy the Largest Share of the Agricultural Biologicals Market
Based on the type of crop treated, the market is segmented into cereals and pulses, fruits and nuts, oilseeds, green fodder, vegetables and tubers, and industrial crops, textile crops and others. It is worth highlighting that, at present, cereals and pulses hold a larger share in the agricultural biologicals market. This trend is likely to remain the same in the coming decade.
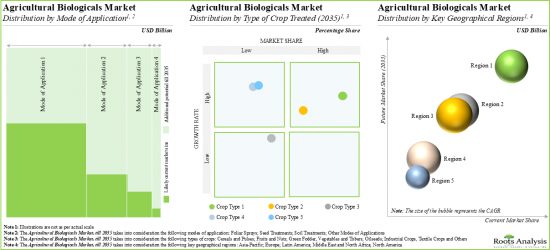
North America Accounts for the Largest Share of the Market
Based on key geographical regions, the market is segmented into North America, Europe, Asia-Pacific, Middle East and North Africa, and Latin America. It is worth highlighting that, over the years, the market in the rest of the world is expected to grow at a higher CAGR.
Example Players in the Agricultural Biologicals Market
- AMVAC
- Andermatt
- BASF SE
- Bayer AG
- BioSafe Systems
- Brandt
- Chr. Hansen
- Certis Biologicals
- Corteva Agriscience
- FBSciences
- Grow Indigo
- Koppert Biological Systems
- Lallemand
- Nutri-Tech Solutions
- Novozymes
- PI Industries
- ProFarm
- SQM
- Stoller
- Syngenta
- UPL
- Vegalab
- Valent Biosciences
- Verdisian Life Sciences
Primary Research Overview
The opinions and insights presented in this study were influenced by discussions conducted with multiple stakeholders. The research report features detailed transcripts of interviews held with the following industry stakeholders:
- President, Vegalab
- Global Director, Acadian Plant Health
- Sales Representative, Jiahe Biology
AGRICULTURAL BIOLOGICALS MARKET: RESEARCH COVERAGE
- Market Sizing and Opportunity Analysis: The report features an in-depth analysis of the agricultural biologicals market, focusing on key market segments, including [A] type of product, [B] source of product, [C] mode of application, [D] type of crop treated and [E] key geographical regions.
- Market Landscape: A comprehensive evaluation of companies offering agricultural biologics, considering various parameters, such as [A] year of establishment, [B] company size (in terms of number of employees), [C] location of headquarters, [D] type of product offered, [E] type of biostimulant offered, [F] type of biopesticide / biocontrol offered, [G] type of biofertilizer offered, [H] source of product offered, [I] type of product formulation, [J] type of crop treated, [K] mode of application, [L] number of products offered and [M] most active players (based on number of products offered).
- Company Competitiveness Analysis: A comprehensive competitive analysis of companies offering agricultural biologicals, examining factors, such as [A] supplier strength and [B] product portfolio strength.
- Company Profiles: In-depth profiles of key industry players offering agricultural biologicals, focusing on [A] company overviews, [B] financial information (if available), [C] product portfolio, [D] recent developments and [E] an informed future outlook.
- Partnerships and Collaborations: An analysis of partnerships established in this sector, since 2020, covering distribution agreements, product development agreements, acquisitions, product development and commercialization agreements, research and development agreements, asset acquisitions, commercialization agreements, supply agreements, product development and distribution agreements, and product integration agreements.
- Patent Analysis: Detailed analysis of various patents filed / granted related to agricultural biologicals based on [A] publication year, [B] geographical region, [C] CPC symbols, [D] leading players (in terms of number of patents filled / granted) and [E] type of organization. It also includes [F] a patent benchmarking analysis and [G] a detailed valuation analysis.
- Porter's Five Forces: A qualitative analysis of the five competitive forces, including threats for new entrants, bargaining power of agricultural biologicals developers, bargaining power of end-users, threats of substitute products and rivalry among existing competitors under an insightful Porter's Five Forces framework.
- Market Impact Analysis: The report analyzes various factors such as drivers, restraints, opportunities, and challenges affecting the market growth.
KEY QUESTIONS ANSWERED IN THIS REPORT
- How many companies are currently engaged in this market?
- Which are the leading companies in this market?
- What kind of partnership models are commonly adopted by industry stakeholders?
- What factors are likely to influence the evolution of this market?
- What is the current and future market size?
- What is the CAGR of this market?
- How is the current and future market opportunity likely to be distributed across key market segments?
REASONS TO BUY THIS REPORT
- The report provides a comprehensive market analysis, offering detailed revenue projections of the overall market and its specific sub-segments. This information is valuable to both established market leaders and emerging entrants.
- Stakeholders can leverage the report to gain a deeper understanding of the competitive dynamics within the market. By analyzing the competitive landscape, businesses can make informed decisions to optimize their market positioning and develop effective go-to-market strategies.
- The report offers stakeholders a comprehensive overview of the market, including key drivers, barriers, opportunities, and challenges. This information empowers stakeholders to stay abreast of market trends and make data-driven decisions to capitalize on growth prospects.
ADDITIONAL BENEFITS
- Complimentary PPT Insights Packs
- Complimentary Excel Data Packs for all Analytical Modules in the Report
- 10% Free Content Customization
- Detailed Report Walkthrough Session with Research Team
- Free Updated report if the report is 6-12 months old or older
TABLE OF CONTENTS
1. PREFACE
- 1.1. Agricultural Biologicals Market Overview
- 1.2. Key Market Insights
- 1.3. Scope of the Report
- 1.4. Research Methodology
- 1.5. Frequently Asked Questions
- 1.6. Chapter Outlines
2. RESEARCH METHODOLOGY
- 2.1. Chapter Overview
- 2.2. Research Assumptions
- 2.3. Project Methodology
- 2.4. Forecast Methodology
- 2.5. Robust Quality Control
- 2.6. Key Market Segmentations
- 2.7. Key Considerations
- 2.7.1. Demographics
- 2.7.2. Economic Factors
- 2.7.3. Government Regulations
- 2.7.4. Supply Chain
- 2.7.5. COVID Impact / Related Factors
- 2.7.6. Market Access
- 2.7.7. Healthcare Policies
- 2.7.8. Industry Consolidation
3. ECONOMIC AND OTHER PROJECT SPECIFIC CONSIDERATIONS
- 3.1. Chapter Overview
- 3.2. Market Dynamics
- 3.2.1. Time Period
- 3.2.1.1. Historical Trends
- 3.2.1.2. Current and Forecasted Estimates
- 3.2.2. Currency Coverage
- 3.2.2.1. Overview of Major Currencies Affecting the Market
- 3.2.2.2. Impact of Currency Fluctuations on the Industry
- 3.2.3. Foreign Exchange Impact
- 3.2.3.1. Evaluation of Foreign Exchange Rates and their Impact on Market
- 3.2.3.2. Strategies for Mitigating Foreign Exchange Risk
- 3.2.4. Recession
- 3.2.4.1. Historical Analysis of Past Recessions and Lessons Learnt
- 3.2.4.2. Assessment of Current Economic Conditions and Potential Impact on the Market
- 3.2.5. Inflation
- 3.2.5.1. Measurement and Analysis of Inflationary Pressures in the Economy
- 3.2.5.2. Potential Impact of Inflation on the Market Evolution
- 3.2.1. Time Period
4. EXECUTIVE SUMMARY
5. INTRODUCTION
- 5.1. Chapter Overview
- 5.2. Sustainable Agriculture
- 5.3. Introduction to Agricultural Biologicals
- 5.3.1. Types of Agricultural Biologicals
- 5.3.1.1. Biostimulants
- 5.3.1.2. Biopesticides / Biocontrols
- 5.3.1.3. Biofertilizers
- 5.3.2. Advantages of Agricultural Biologicals
- 5.3.1. Types of Agricultural Biologicals
- 5.4. Future Perspectives
6. MARKET LANDSCAPE
- 6.1. Chapter Overview
- 6.2. Agricultural Biologicals Manufacturers: Overall Market Landscape
- 6.2.1. Analysis by Year of Establishment
- 6.2.2. Analysis by Company Size
- 6.2.3. Analysis by Year of Establishment and Company Size
- 6.2.4. Analysis by Location of Headquarters
- 6.2.5. Analysis by Company Size and Location of Headquarters
- 6.2.6. Analysis by Type of Product Offered
- 6.2.7. Analysis by Company Size and Type of Product Offered
- 6.2.8. Analysis by Source of Product Offered
- 6.2.9. Analysis by Type of Product Formulation
- 6.2.10. Analysis by Type of Crop Treated
- 6.2.11. Analysis by Mode of Application
- 6.2.12. Analysis by Number of Products Offered
- 6.2.13. Most Active Players: Analysis by Number of Products Offered
7. COMPANY COMPETITIVENESS ANALYSIS
- 7.1. Chapter Overview
- 7.2. Assumptions and Key Parameters
- 7.3. Methodology
- 7.4. Company Competitiveness Analysis: Agricultural Biologicals Manufacturers in North America
- 7.4.1. Very Small and Small Companies in North America
- 7.4.2. Mid-sized Companies in North America
- 7.4.3. Large and Very Large Companies in North America
- 7.5. Company Competitiveness Analysis: Agricultural Biologicals Manufacturers in Europe
- 7.5.1. Very Small and Small Companies in Europe
- 7.5.2. Mid-sized Companies in Europe
- 7.5.3. Large and Very Large Companies in Europe
- 7.6. Company Competitiveness Analysis: Agricultural Biologicals Manufacturers in Asia-Pacific and Rest of the World
- 7.6.1. Very Small and Small Companies in Asia-Pacific and Rest of the World
- 7.6.2. Mid-sized Companies in Asia-Pacific and Rest of the World
- 7.6.3. Large and Very Large Companies in Asia-Pacific and Rest of the World
- 7.7. Company Competitiveness Analysis: Other Agricultural Biologicals Manufacturers
8. COMPANY PROFILES
- 8.1. Chapter Overview
- 8.2. Leading Players in Agricultural Biologicals Market
- 8.2.1. Andermatt
- 8.2.1.1. Company Overview
- 8.2.1.2. Agricultural Biologicals Portfolio
- 8.2.1.3. Recent Developments and Future Outlook
- 8.2.2. Certis Biologicals
- 8.2.2.1. Company Overview
- 8.2.2.2. Agricultural Biologicals Portfolio
- 8.2.2.3. Recent Developments and Future Outlook
- 8.2.3. Corteva Agriscience
- 8.2.3.1. Company Overview
- 8.2.3.2. Financial Information
- 8.2.3.3. Agricultural Biologicals Portfolio
- 8.2.3.4. Recent Developments and Future Outlook
- 8.2.4. Nutri-Tech Solutions
- 8.2.4.1. Company Overview
- 8.2.4.2. Agricultural Biologicals Portfolio
- 8.2.4.3. Recent Developments and Future Outlook
- 8.2.5. Novozymes
- 8.2.5.1. Company Overview
- 8.2.5.2. Financial Information
- 8.2.5.3. Agricultural Biologicals Portfolio
- 8.2.5.4. Recent Developments and Future Outlook
- 8.2.6. ProFarm
- 8.2.6.1. Company Overview
- 8.2.6.2. Agricultural Biologicals Portfolio
- 8.2.6.3. Recent Developments and Future Outlook
- 8.2.7. SQM
- 8.2.7.1. Company Overview
- 8.2.7.2. Agricultural Biologicals Portfolio
- 8.2.7.3. Recent Developments and Future Outlook
- 8.2.8. UPL
- 8.2.8.1. Company Overview
- 8.2.8.2. Financial Information
- 8.2.8.3. Agricultural Biologicals Portfolio
- 8.2.8.4. Recent Developments and Future Outlook
- 8.2.9. Vegalab
- 8.2.9.1. Company Overview
- 8.2.9.2. Agricultural Biologicals Portfolio
- 8.2.9.3. Recent Developments and Future Outlook
- 8.2.1. Andermatt
- 8.3. Other Leading Players in Agricultural Biologicals Market
- 8.3.1. AMVAC
- 8.3.1.1. Company Overview
- 8.3.1.2. Agricultural Biologicals Portfolio
- 8.3.2. BASF
- 8.3.2.1. Company Overview
- 8.3.2.2. Agricultural Biologicals Portfolio
- 8.3.3. Bayer
- 8.3.3.1. Company Overview
- 8.3.3.2. Agricultural Biologicals Portfolio
- 8.3.4. BioSafe Systems
- 8.3.4.1. Company Overview
- 8.3.4.2. Agricultural Biologicals Portfolio
- 8.3.5. Brandt
- 8.3.5.1. Company Overview
- 8.3.5.2. Agricultural Biologicals Portfolio
- 8.3.6. Chr. Hansen
- 8.3.6.1. Company Overview
- 8.3.6.2. Agricultural Biologicals Portfolio
- 8.3.7. FBSciences
- 8.3.7.1. Company Overview
- 8.3.7.2. Agricultural Biologicals Portfolio
- 8.3.8. Grow Indigo
- 8.3.8.1. Company Overview
- 8.3.8.2. Agricultural Biologicals Portfolio
- 8.3.9. Koppert
- 8.3.9.1. Company Overview
- 8.3.9.2. Agricultural Biologicals Portfolio
- 8.3.10. Lallemand
- 8.3.10.1. Company Overview
- 8.3.10.2. Agricultural Biologicals Portfolio
- 8.3.11. PI Industries
- 8.3.11.1. Company Overview
- 8.3.11.2. Agricultural Biologicals Portfolio
- 8.3.12. Stoller
- 8.3.12.1. Company Overview
- 8.3.12.2. Agricultural Biologicals Portfolio
- 8.3.13. Syngenta
- 8.3.13.1. Company Overview
- 8.3.13.2. Agricultural Biologicals Portfolio
- 8.3.14. Valent Biosciences
- 8.3.14.1. Company Overview
- 8.3.14.2. Agricultural Biologicals Portfolio
- 8.3.15. Verdesian Life Sciences
- 8.3.15.1. Company Overview
- 8.3.15.2. Agricultural Biologicals Portfolio
- 8.3.1. AMVAC
9. PARTNERSHIPS AND COLLABORATIONS
- 9.1. Chapter Overview
- 9.2. Partnership Models
- 9.3. Agricultura Biologicals: Recent Partnerships and Collaborations
- 9.3.1. Analysis by Year of Partnership
- 9.3.2. Analysis by Type of Partnership
- 9.3.3. Analysis by Year and Type of Partnership
- 9.3.4. Analysis by Type of Partnership and Company Size
- 9.3.5. Analysis by Focus Area of Partnership
- 9.3.6. Analysis by Type of Partner
- 9.3.7. Most Active Players: Analysis by Number of Partnerships
- 9.3.8. Analysis by Geography
- 9.3.8.1. Local and International Agreements
- 9.3.8.2. Intracontinental and Intercontinental Agreements
10. PATENT ANALYSIS
- 10.1. Chapter Overview
- 10.2. Scope and Methodology
- 10.3. Agricultural Biologicals: Patent Analysis
- 10.3.1. Analysis by Patent Publication Year
- 10.3.2. Analysis by Patent Application Year
- 10.3.3. Analysis of Granted Patents and Patent Applications by Publication Year
- 10.3.4. Analysis by Patent Jurisdiction
- 10.3.5. Analysis by CPC Symbols
- 10.3.6. Analysis by Type of Applicant
- 10.3.7. Leading Industry Players: Analysis by Number of Patents
- 10.3.8. Leading Non-Industry Players: Analysis by Number of Patents
- 10.3.9. Leading Individual Assignees: Analysis by Number of Patents
- 10.4. Agricultural Biologicals: Patent Benchmarking Analysis
- 10.4.1. Analysis by Patent Characteristics
- 10.5. Agricultural Biologicals: Patent Valuation
- 10.6. Leading Patents by Number of Citations
11. PORTER'S FIVE FORCES ANALYSIS
- 11.1. Chapter Overview
- 11.2. Methodology and Assumptions
- 11.3. Key Parameters
- 11.3.1. Threats of New Entrants
- 11.3.2. Bargaining Power of End-Users
- 11.3.3. Bargaining Power of Product Developers
- 11.3.4. Threats of Substitute Products
- 11.3.5. Rivalry Among Existing Competitors
- 11.4. Concluding Remarks
12. MARKET IMPACT ANALYSIS: DRIVERS, RESTRAINTS, OPPORTUNITIES AND CHALLENGES
- 12.1. Chapter Overview
- 12.2. Market Drivers
- 12.3. Market Restraints
- 12.4. Market Opportunities
- 12.5. Market Challenges
- 12.6. Conclusion
13. GLOBAL AGRICULTURAL BIOLOGICALS MARKET
- 13.1. Chapter Overview
- 13.2. Assumptions and Methodology
- 13.3. Global Agricultural Biologicals Market, Historical Trends (since 2019) and Forecasted Estimates (till 2035)
- 13.3.1. Scenario Analysis
- 13.4. Key Market Segmentations
- 13.5. Dynamic Dashboard
14. AGRICULTURAL BIOLOGICALS MARKET, BY TYPE OF PRODUCT
- 14.1. Chapter Overview
- 14.2. Key Assumptions and Methodology
- 14.3. Agricultural Biologicals Market: Distribution by Type of Product, 2019, 2023 and 2035 (USD Billion)
- 14.3.1. Biopesticides / Biocontrols Market: Historical Trends (since 2019) and Future Estimates (till 2035) (USD Billion)
- 14.3.2. Biofertilizers Market: Historical Trends (since 2019) and Future Estimates (till 2035) (USD Billion)
- 14.3.3. Biostimulants Market: Historical Trends (since 2019) and Future Estimates (till 2035) (USD Billion)
- 14.4. Data Triangulation
- 14.4.1. Insights from Primary Research
- 14.4.2. Insights from Secondary Research
15. AGRICULTURAL BIOLOGICALS MARKET, BY SOURCE OF PRODUCT
- 15.1. Chapter Overview
- 15.2. Key Assumptions and Methodology
- 15.3. Agricultural Biologicals Market: Distribution by Source of Product, 2019, 2023 and 2035 (USD Billion)
- 15.3.1. Agricultural Biologicals Market for Microbes: Historical Trends (since 2019) and Future Estimates (till 2035) (USD Billion)
- 15.3.2. Agricultural Biologicals Market for Plant Extracts: Historical Trends (since 2019) and Future Estimates (till 2035) (USD Billion)
- 15.3.3. Agricultural Biologicals Market for Other Sources: Historical Trends (since 2019) and Future Estimates (till 2035) (USD Billion)
- 15.4. Data Triangulation
- 15.4.1. Insights based on Primary Research
- 15.4.2. Insights based on Secondary Research
16. AGRICULTURAL BIOLOGICALS MARKET, BY MODE OF APPLICATION
- 16.1. Chapter Overview
- 16.2. Key Assumptions and Methodology
- 16.3. Agricultural Biologicals Market: Distribution by Mode of Application, 2019, 2023 and 2035 (USD Billion)
- 16.3.1. Agricultural Biologicals Market for Foliar Sprays: Historical Trends (since 2019) and Future Estimates (till 2035) (USD Billion)
- 16.3.2. Agricultural Biologicals Market for Seed Treatments: Historical Trends (since 2019) and Future Estimates (till 2035) (USD Billion)
- 16.3.3. Agricultural Biologicals Market for Soil Treatments: Historical Trends (since 2019) and Future Estimates (till 2035) (USD Billion)
- 16.3.4. Agricultural Biologicals Market for Other Application Methods: Historical Trends (since 2019) and Future Estimates (till 2035) (USD Billion)
- 16.4. Data Triangulation
- 16.4.1. Insights based on Primary Research
- 16.4.2. Insights based on Secondary Research
17. AGRICULTURAL BIOLOGICALS MARKET, BY TYPE OF CROP TREATED
- 17.1. Chapter Overview
- 17.2. Key Assumptions and Methodology
- 17.3. Agricultural Biologicals Market: Distribution by Type of Crop Treated, 2019, 2023 and 2035 (USD Billion)
- 17.3.1. Agricultural Biologicals Market for Cereals and Pulses: Historical Trends (since 2019) and Future Estimates (till 2035) (USD Billion)
- 17.3.2. Agricultural Biologicals Market for Fruits and Nuts: Historical Trends (since 2019) and Future Estimates (till 2035) (USD Billion)
- 17.3.3. Agricultural Biologicals Market for Oilseeds: Historical Trends (since 2019) and Future Estimates (till 2035) (USD Billion)
- 17.3.4. Agricultural Biologicals Market for Green Fodder, Vegetables and Tubers: Historical Trends (since 2019) and Future Estimates (till 2035) (USD Billion)
- 17.3.5. Agricultural Biologicals Market for Industrial Crops, Textile Crops and Others: Historical Trends (since 2019) and Future Estimates (till 2035) (USD Billion)
- 17.4. Data Triangulation
- 17.4.1. Insights based on Primary Research
- 17.4.2. Insights based on Secondary Research
18. AGRICULTURAL BIOLOGICALS MARKET, BY GEOGRAPHY
- 18.1. Chapter Overview
- 18.2. Key Assumptions and Methodology
- 18.3. Agricultural Biologicals Market: Distribution by Key Geographical Regions, 2019, 2023 and 2035 (USD Billion)
- 18.3.1. Agricultural Biologicals Market for North America: Historical Trends (since 2019) and Future Estimates (till 2035) (USD Billion)
- 18.3.2. Agricultural Biologicals Market for Europe: Historical Trends (since 2019) and Future Estimates (till 2035) (USD Billion)
- 18.3.3. Agricultural Biologicals Market for Asia-Pacific: Historical Trends (since 2019) and Future Estimates (till 2035) (USD Billion)
- 18.3.4. Agricultural Biologicals Market for Latin America: Historical Trends (since 2019) and Future Estimates (till 2035) (USD Billion)
- 18.3.5. Agricultural Biologicals Market for Middle East and North Africa: Historical Trends (since 2019) and Future Estimates (till 2035) (USD Billion)
- 18.4. Data Triangulation
- 18.4.1. Insights based on Primary Research
- 18.4.2. Insights based on Secondary Research
19. CONCLUSION
20. EXECUTIVE INSIGHTS
- 20.1. Chapter Overview
- 20.2. Vegalab
- 20.2.1. Company Snapshot
- 20.2.2. Interview Transcript: President
- 20.3. Acadian Plant Health
- 20.3.1. Company Snapshot
- 20.3.2. Interview Transcript: Global Director
- 20.4. Jiahe Biology
- 20.4.1. Company Snapshot
- 20.4.2. Interview Transcript: Sales Representative

