
|
市場調査レポート
商品コード
1919787
臨床試験におけるAI市場 - 2040年までの業界動向と世界の予測 - 試験段階別、対象治療領域別、エンドユーザー別、主要地域別AI in Clinical Trials Market, till 2040: Distribution by Trial Phase, Target Therapeutic Area, End User and Key Geographical Regions: Industry Trends and Global Forecasts |
||||||
カスタマイズ可能
|
|||||||
| 臨床試験におけるAI市場 - 2040年までの業界動向と世界の予測 - 試験段階別、対象治療領域別、エンドユーザー別、主要地域別 |
|
出版日: 2026年01月20日
発行: Roots Analysis
ページ情報: 英文 188 Pages
納期: 即日から翌営業日
|

概要
臨床試験における人工知能(AI)市場の見通し
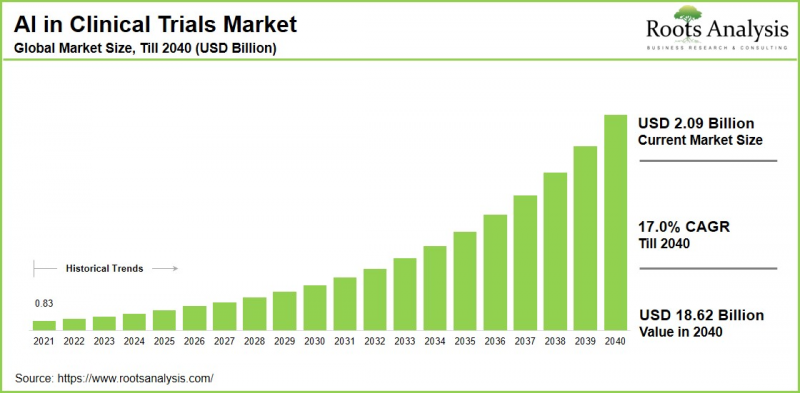
世界の臨床試験における人工知能の市場規模は、現在の20億9,000万米ドルから2040年までに186億2,000万米ドルへ成長し、予測期間(2040年まで)におけるCAGRは17.0%と推定されています。
新規治療法の開発には多大な時間と資金が必要であり、通常10~15年を要します。ヒトにおける有効性と安全性を評価する上で不可欠な臨床試験は、この期間と予算の約50~70%を占めますが、設計上の欠陥、被験者募集の問題、層別化の誤り、高い脱落率により多くの試験が失敗に終わっています。このため、製薬の利害関係者はこうした課題を軽減するため、膨大なデータセットを処理して試験を最適化するAIの能力を活用し、AIの導入を加速させています。
特筆すべきは、人工知能が臨床試験を変革している点です。精密なマッチングによる患者募集の加速、デジタルツインを用いた試験設計の精緻化、電子健康記録(EHR)や画像診断など多面的なデータソースからの安全性・有効性シグナルの抽出を実現します。さらに、報告やモニタリングといった日常業務の自動化も進めています。以上の要因を考慮すると、予測期間中に世界の臨床試験向けAI市場は著しい成長が見込まれます。
上級管理職向け戦略的インサイト
臨床試験におけるAIの主要な役割と応用
AIは、患者募集や試験実施施設の選定から、試験設計、データ管理、結果予測に至るまで、臨床試験の全過程において極めて重要な役割を果たします。主な応用例としては、機械学習を活用した電子健康記録(EHR)や実世界データの分析による精密な患者マッチングが挙げられます。さらに、スクリーニング失敗の削減や登録の迅速化にも活用されています。また、AIはデータクリーニングの自動化、異常値の検出、有害事象の予測、多様なデータセットの継続的分析によるモニタリングの強化を実現します。これにより、効率性の向上、コスト削減、試験成功率の向上が可能となり、個別化医療アプローチの支援にもつながります。
臨床試験市場におけるAI成長を牽引する主要な市場促進要因
臨床試験におけるAI市場は、電子健康記録や遺伝子データの分析による患者募集の効率化など、いくつかの重要な市場促進要因により急速に拡大しています。このアプローチにより、適切な候補者の特定が加速され、試験期間とコストが削減されます。予測分析と機械学習は結果を予測することで試験設計の最適化を可能にし、実世界データの統合は患者行動に関する深い洞察を提供します。さらに、個別化医療への需要の高まり、精密治療の成長、膨大な臨床データセットの管理ニーズが、こうした技術の採用を促進しています。
臨床試験におけるAI市場:業界企業の競合情勢
臨床試験におけるAI市場の競合情勢は、大手企業と中小企業の共存を特徴とする激しい競争が特徴です。IQVIA、Medidata (Dassault Systemes)、IBM Watson Health、Oracle Health Sciences、Phesiといった主要参入企業は、データ分析、患者マッチング、試験最適化のための包括的なプラットフォームを通じて主導的立場にあり、PfizerやNovartisなどの製薬企業との協業も頻繁に行われています。
AiCure、Deep 6 AI、Mendel.ai、Saama Technologies、Unlearn.ai、ConcertAI、Tempus AIなどの新興企業は、リアルタイムモニタリングや予測モデリングといったニッチソリューションで存在感を高めており、医薬品開発の効率化需要の高まりの中で競合を激化させています。
臨床試験におけるAIの進化:業界の新興動向
この分野における新たな動向には、プロセスの自動化、患者マッチングの高度化、予測分析による大幅なコスト削減と期間短縮が含まれます。エージェント型AIは、患者募集から適応型試験におけるリアルタイムリスクモニタリング、プロトコル調整まで、試験ワークフローを自律的に管理します。生成AIとは異なり、意思決定を独立して実行するため、手作業を削減し登録を加速させます。生成AIはプロトコルの草案作成、モデル訓練用合成データセットの生成、電子同意書(eConsent)などの患者向けコンテンツの自動化を行います。過去のデータからシナリオをシミュレートすることで試験設計を最適化し、開発期間を最大50%、コストを25%削減する可能性があります。さらに、デジタルツイン技術はAIと過去のデータを用いて個々の患者の反応をシミュレートし、より小規模でありながら統計的検出力の高い試験を可能にします。
主要な市場課題
臨床試験におけるAI市場は、GDPRやHIPAAなどの厳格なデータプライバシー規制による機微な患者情報の取り扱い難しさ、大幅なカスタマイズと相互運用性基準を要するレガシーシステムとの統合課題など、重大な課題に直面しています。その他の障壁としては、実世界データセットにおける不完全性やバイアスといったデータ品質の問題、AIに精通した臨床医の不足の中でインフラ整備にかかる初期費用の高さが挙げられます。これらの要因により、製薬企業、技術プロバイダー、規制当局が連携し、被験者募集、モニタリング、適応型設計の効率化においてAIの可能性を解き放つ取り組みが求められています。
臨床試験におけるAI市場:主要市場セグメンテーション
試験段階
- 第I相
- 第II相
- 第III相
対象治療領域
- 心血管疾患
- 中枢神経系疾患
- 感染症
- 代謝性疾患
- 腫瘍性疾患
- その他の疾患
エンドユーザー
- 製薬・バイオテクノロジー企業
- その他
地域
- 北米
- 米国
- カナダ
- メキシコ
- その他の北米諸国
- 欧州
- オーストリア
- ベルギー
- デンマーク
- フランス
- ドイツ
- アイルランド
- イタリア
- オランダ
- ノルウェー
- ロシア
- スペイン
- スウェーデン
- スイス
- 英国
- その他の欧州諸国
- アジア
- 中国
- インド
- 日本
- シンガポール
- 韓国
- その他のアジア諸国
- ラテンアメリカ
- ブラジル
- チリ
- コロンビア
- ベネズエラ
- その他のラテンアメリカ諸国
- 中東および北アフリカ
- エジプト
- イラン
- イラク
- イスラエル
- クウェート
- サウジアラビア
- アラブ首長国連邦
- その他中東・北アフリカ諸国
- 世界のその他の地域
- オーストラリア
- ニュージーランド
- その他の国々
臨床試験におけるAI市場:主要市場シェアに関する洞察
治療領域別市場シェア
治療領域別では、世界市場は心血管疾患、中枢神経系疾患、感染症、代謝性疾患、腫瘍性疾患、その他の疾患に分類されます。当社の推定によると、現在、腫瘍性疾患が市場の大部分を占めています。これは、がん臨床試験の規模が大きく複雑であることに起因します。これらの試験では、ゲノム解析、画像診断、電子健康記録から膨大で多様なデータセットが生成され、AIが効率的に分析することで、患者募集の精度が向上します。
地域別市場シェア
当社の推計によりますと、現在アジア太平洋地域が臨床試験におけるAI市場の大きなシェアを占めています。これは、がんや糖尿病などの慢性疾患の負担が増加する中、大規模かつ多様な患者集団が存在し、試験の迅速な患者募集が可能であるためです。さらに、同地域では費用対効果の高い運営体制に加え、規制枠組みの改善、政府のインセンティブ、拡大するバイオテクノロジーインフラが成長を後押ししています。
臨床試験向けAI市場の代表的な参入企業
- AiCure
- Antidote Technologies
- Deep 6 AI
- Innoplexus
- IQVIA
- Median Technologies
- Medidata
- Mendel.ai
- Phesi
- Saama Technologies
- Signant Health
- Trials.ai
臨床試験におけるAI市場:レポートのカバー範囲
当レポートでは、臨床試験におけるAI市場に関する以下のセクションを網羅しています:
- 市場規模と機会分析:臨床試験におけるAI市場の詳細な分析。主な市場セグメントである[A]試験段階、[B]対象治療領域、[C]エンドユーザー、[D]主要地域に焦点を当てています。
- 競合情勢:臨床試験におけるAI市場に参入している企業について、[A]設立年、[B]企業規模、[C]本社所在地、[D]所有構造など、複数の関連パラメータに基づく包括的な分析。
- 企業プロファイル:臨床試験におけるAI市場に参入している主要企業の詳細なプロファイルを提供します。内容は[A]本社所在地、[B]企業規模、[C]企業理念、[D]事業展開地域、[E]経営陣、[F]連絡先、[G]財務情報、[H]事業セグメント、[I]製品ポートフォリオ、[J]最近の動向、および将来展望を含みます。
- メガトレンド:臨床試験におけるAI業界で進行中のメガトレンドを評価します。
- 特許分析:臨床試験におけるAI分野で出願・登録された特許に関する洞察に富んだ分析。関連パラメータ([A]特許の種類、[B]特許公開年、[C]特許の経過年数、[D]主要参入企業)に基づきます。
- 最近の動向:臨床試験におけるAI市場における最近の動向の概要と、[A]取り組みの年、[B]取り組みの種類、[C]地理的分布、[D]最も活発な参入企業といった関連パラメータに基づく分析。
- ポーターのファイブフォース分析:臨床試験におけるAI市場に存在する5つの競争的要因(新規参入業者の脅威、買い手の交渉力、供給企業の交渉力、代替品の脅威、既存競合他社間の競争)に関する分析。
- SWOT分析:当該分野における強み、弱み、機会、脅威を明示する洞察に富んだSWOTフレームワークです。さらにハーベイボール分析を提供し、各SWOTパラメータの相対的な影響度を強調します。
- バリューチェーン分析:臨床試験におけるAI市場に関わる様々な段階と利害関係者に関する情報を提供する、包括的なバリューチェーン分析です。
当レポートで回答する主な質問
- 現在の市場規模と将来の市場規模はどの程度か
- この市場における主要企業はどうか
- この市場の進化に影響を与える可能性のある成長要因は何か
- この業界を形成する主な提携および資金調達の動向はどのようなものか
- 2040年まで高いCAGRで成長が見込まれる地域はどこか
- 現在および将来の市場機会は、主要市場セグメント間でどのように分布する見込みか
目次
第1章 序文
第2章 エグゼクティブサマリー
第3章 イントロダクション
- 章の概要
- AIの進化
- AIのサブフィールド
- ヘルスケアにおけるAIの応用
- 臨床試験におけるAIの応用
- AI導入に伴う課題
- 将来の展望
第4章 競合情勢
- 章の概要
- 臨床試験におけるAI:AIソフトウェアおよびサービスプロバイダーの現状
第5章 企業プロファイル
- 章の概要
- AiCure
- Antidote Technologies
- Deep 6 AI
- Innoplexus
- IQVIA
- Median Technologies
- Medidata
- Mendel.ai
- Phesi
- Saama Technologies
- Signant Health
- Trials.ai
第6章 臨床試験の分析
- 章の概要
- 範囲と調査手法
- 臨床試験におけるAI
第7章 パートナーシップとコラボレーション
- 章の概要
- パートナーシップモデル
- 臨床試験におけるAI:パートナーシップとコラボレーション
第8章 資金調達と投資
- 章の概要
- 資金調達の種類
- 臨床試験におけるAI:資金調達と投資
- 結論
第9章 大手製薬会社の取り組み
- 章の概要
- 範囲と調査手法
- 取り組み年別分析
- 取り組みの種類別の分析
- AIの応用分野別分析
- 対象治療領域別分析
- ベンチマーク分析:大手製薬会社
第10章 臨床試験におけるAI:ユースケース
- 章の概要
- 使用事例1:RocheとAiCureのコラボレーション
- 使用事例2:TakedaとAiCureのコラボレーション
- 使用事例3:Teva PharmaceuticalsとIntelのコラボレーション
- 使用事例4:非公開製薬会社とAntidoteのコラボレーション
- 使用事例5:非公開製薬会社とCognizantのコラボレーション
- 使用事例6:Cedars-Sinai Medical CenterとDeep 6 AIのコラボレーション
- 使用事例7:GlaxoSmithKline (GSK)とPathAIのコラボレーション
- 使用事例8:Bristol Myers Squibb (BMS)とConcert AIのコラボレーション
第11章 価値創造フレームワーク:臨床試験におけるアンメットニーズへの対応戦略ガイド
第12章 コスト削減分析
第13章 市場予測と機会分析
- 章の概要
- 主要な前提と予測調査手法
- 臨床試験市場における世界のAI
- 臨床試験市場におけるAI:試験段階別
- 臨床試験市場におけるAI:対象治療領域別
- 臨床試験市場におけるAI:エンドユーザー別
- 臨床試験市場におけるAI:主要地域別

