|
|
市場調査レポート
商品コード
1619381
パルミトレイン酸の世界市場 - 市場シェアとランキング、全体の売上と需要の予測(2024年~2030年)Palmitoleic Acid - Global Market Share and Ranking, Overall Sales and Demand Forecast 2024-2030 |
||||||
|
|||||||
カスタマイズ可能
適宜更新あり
|
|||||||

| パルミトレイン酸の世界市場 - 市場シェアとランキング、全体の売上と需要の予測(2024年~2030年) |
|
出版日: 2024年12月23日
発行: QYResearch
ページ情報: 英文 125 Pages
納期: 2~3営業日
|

全表示
- 概要
- 図表
- 目次
世界のパルミトオレイン酸の市場規模は、2023年に5,175万米ドルと推定されました。
2030年までに8,087万米ドルに達すると予測され、2024年~2030年の予測期間にCAGRで7.6%の成長が見込まれます。
北米の市場規模は、2023年に624万米ドルでした。2030年までに954万米ドルに達すると予測され、予測期間のCAGRは7.1%です。
アジア太平洋の市場規模は、2023年に3,721万米ドルでした。2030年までに5,843万米ドルに達すると測され、予測期間のCAGRは7.7%です。
欧州の市場規模は、2023年に613万米ドルでした。2030年までに956万米ドルに達すると予測され、予測期間のCAGRは7.5%です。
世界のパルミトオレイン酸の主要企業は、Wiley Companies、Tersus Life Sciences、Aromtech、Ethical Naturals、Aikon、Shanxi Wutai、Yuhangren、Xinjiang Huihuaなどです。2023年、世界の大手5社が収益で約77.74%のシェアを占めました。
当レポートでは、世界のパルミトレイン酸市場について調査分析し、各地域の市場規模と予測、市場シェア、主要メーカーのランキングなどの情報を提供しています。
目次
第1章 市場の概要
- パルミトレイン酸製品のイントロダクション
- 世界のパルミトレイン酸の市場規模の予測
- 世界のパルミトレイン酸の売上金額(2019年~2030年)
- 世界のパルミトレイン酸の売上数量(2019年~2030年)
- 世界のパルミトレイン酸の販売価格(2019年~2030年)
- パルミトレイン酸市場の動向と促進要因
- パルミトレイン酸産業の動向
- パルミトレイン酸市場の促進要因と機会
- パルミトレイン酸市場の課題
- パルミトレイン酸市場の抑制要因
- 前提条件と制限
- 調査目的
- 考慮される年数
第2章 競合分析:企業別
- 世界のパルミトレイン酸企業の収益ランキング(2023年)
- 世界のパルミトレイン酸の収益:企業別(2019年~2024年)
- 世界のパルミトレイン酸の売上数量ランキング(2023年)
- 世界のパルミトレイン酸の売上数量:企業別(2019年~2024年)
- 世界のパルミトレイン酸の平均価格:企業別(2019年~2024年)
- 主要メーカーのパルミトレイン酸の製造拠点と本社
- 主要メーカーのパルミトレイン酸製品
- 主要メーカーの設立日
- パルミトレイン酸市場の競合分析
- パルミトレイン酸の市場集中度(2019年~2024年)
- 世界のパルミトレイン酸の収益の5大メーカー(2023年)
- 世界の主要メーカー:企業タイプ別(Tier 1・Tier 2・Tier 3)(2023年時点のパルミトレイン酸の収益に基づく)
第3章 セグメント:タイプ別
- イントロダクション:タイプ別
- 植物由来
- 海洋由来
- 世界のパルミトレイン酸の売上金額:タイプ別
- 世界のパルミトレイン酸の売上金額:タイプ別(2019年・2023年・2030年)
- 世界のパルミトレイン酸の売上金額:タイプ別(2019年~2030年)
- 世界のパルミトレイン酸の売上金額:タイプ別(2019年~2030年)
- 世界のパルミトレイン酸の売上数量:タイプ別
- 世界のパルミトレイン酸の売上数量:タイプ別(2019年・2023年・2030年)
- 世界のパルミトレイン酸の売上数量:タイプ別(2019年~2030年)
- 世界のパルミトレイン酸の売上数量:タイプ別(2019年~2030年)
- 世界のパルミトレイン酸の平均価格:タイプ別(2019年~2030年)
第4章 セグメント:用途別
- イントロダクション:用途別
- 栄養補助食品
- 医薬品
- その他
- 世界のパルミトレイン酸の売上金額:用途別
- 世界のパルミトレイン酸の売上金額:用途別(2019年・2023年・2030年)
- 世界のパルミトレイン酸の売上金額:用途別(2019年~2030年)
- 世界のパルミトレイン酸の売上金額:用途別(2019年~2030年)
- 世界のパルミトレイン酸の売上数量:用途別
- 世界のパルミトレイン酸の売上数量:用途別(2019年・2023年・2030年)
- 世界のパルミトレイン酸の売上数量:用途別(2019年~2030年)
- 世界のパルミトレイン酸の売上数量:用途別(2019年~2030年)
- 世界のパルミトレイン酸の平均価格:用途別(2019年~2030年)
第5章 セグメント:地域別
- 世界のパルミトレイン酸の売上金額:地域別
- 世界のパルミトレイン酸の売上金額:地域別(2019年・2023年・2030年)
- 世界のパルミトレイン酸の売上金額:地域別(2019年~2024年)
- 世界のパルミトレイン酸の売上金額:地域別(2025年~2030年)
- 世界のパルミトレイン酸の売上金額:地域別(2019年~2030年)
- 世界のパルミトレイン酸の売上数量:地域別
- 世界のパルミトレイン酸の売上数量:地域別(2019年・2023年・2030年)
- 世界のパルミトレイン酸の売上数量:地域別(2019年~2024年)
- 世界のパルミトレイン酸の売上数量:地域別(2025年~2030年)
- 世界のパルミトレイン酸の売上数量:地域別(2019年~2030年)
- 世界のパルミトレイン酸の平均価格:地域別(2019年~2030年)
- 北米
- 北米のパルミトレイン酸の売上金額(2019年~2030年)
- 北米のパルミトレイン酸の売上金額:国別(2023年・2030年)
- 欧州
- 欧州のパルミトレイン酸の売上金額(2019年~2030年)
- 欧州のパルミトレイン酸の売上金額:国別(2023年・2030年)
- アジア太平洋
- アジア太平洋のパルミトレイン酸の売上金額(2019年~2030年)
- アジア太平洋のパルミトレイン酸の売上金額:地域別(2023年・2030年)
- ラテンアメリカ
- ラテンアメリカのパルミトレイン酸の売上金額(2019年~2030年)
- ラテンアメリカのパルミトレイン酸の売上金額:国別(2023年・2030年)
- 中東・アフリカ
第6章 セグメント:主要国/地域別
- 主要国/地域のパルミトレイン酸の売上金額の成長動向(2019年・2023年・2030年)
- 主要国/地域のパルミトレイン酸の売上金額
- 主要国/地域のパルミトレイン酸の売上金額(2019年~2030年)
- 主要国/地域のパルミトレイン酸の売上数量(2019年~2030年)
- 米国
- 米国のパルミトレイン酸の売上金額(2019年~2030年)
- 米国のパルミトレイン酸の売上金額:タイプ別(2023年・2030年)
- 米国のパルミトレイン酸の売上金額:用途別(2023年・2030年)
- 欧州
- 欧州のパルミトレイン酸の売上金額(2019年~2030年)
- 欧州のパルミトレイン酸の売上金額:タイプ別(2023年・2030年)
- 欧州のパルミトレイン酸の売上金額:用途別(2023年・2030年)
- 中国
- 中国のパルミトレイン酸の売上金額(2019年~2030年)
- 中国のパルミトレイン酸の売上金額:タイプ別(2023年・2030年)
- 中国のパルミトレイン酸の売上金額:用途別(2023年・2030年)
- 日本
- 日本のパルミトレイン酸の売上金額(2019年~2030年)
- 日本のパルミトレイン酸の売上金額:タイプ別(2023年・2030年)
- 日本のパルミトレイン酸の売上金額:用途別(2023年・2030年)
- 韓国
- 韓国のパルミトレイン酸の売上金額(2019年~2030年)
- 韓国のパルミトレイン酸の売上金額:タイプ別(2023年・2030年)
- 韓国のパルミトレイン酸の売上金額:用途別(2023年・2030年)
- 東南アジア
- 東南アジアのパルミトレイン酸の売上金額(2019年~2030年)
- 東南アジアのパルミトレイン酸の売上金額:タイプ別(2023年・2030年)
- 東南アジアのパルミトレイン酸の売上金額:用途別(2023年・2030年)
- インド
- インドのパルミトレイン酸の売上金額(2019年~2030年)
- インドのパルミトレイン酸の売上金額:タイプ別(2023年・2030年)
- インドのパルミトレイン酸の売上金額:用途別(2023年・2030年)
第7章 企業プロファイル
- Wiley Companies
- Tersus Life Sciences
- Aromtech
- Ethical Naturals
- Aikon
- Shanxi Wutai
- Yuhangren
- Xinjiang Huihua
第8章 産業チェーン分析
- パルミトレイン酸の産業チェーン
- パルミトレイン酸の上流分析
- 主な原材料
- 原材料の主要サプライヤー
- 製造コスト構造
- 中流分析
- 下流分析(顧客分析)
- 販売モデルと販売チャネル
- パルミトレイン酸の販売モデル
- 販売チャネル
- パルミトレイン酸の販売業者
第9章 調査結果と結論
第10章 付録
List of Tables
- Table 1. Palmitoleic Acid Market Trends
- Table 2. Palmitoleic Acid Market Drivers & Opportunity
- Table 3. Palmitoleic Acid Market Challenges
- Table 4. Palmitoleic Acid Market Restraints
- Table 5. Global Palmitoleic Acid Revenue by Company (2019-2024) & (US$ Million)
- Table 6. Global Palmitoleic Acid Revenue Market Share by Company (2019-2024)
- Table 7. Global Palmitoleic Acid Sales Volume by Company (2019-2024) & (Tons)
- Table 8. Global Palmitoleic Acid Sales Volume Market Share by Company (2019-2024)
- Table 9. Global Market Palmitoleic Acid Price by Company (2019-2024) & (US$/Kg)
- Table 10. Key Manufacturers Palmitoleic Acid Manufacturing Base and Headquarters
- Table 11. Key Manufacturers Palmitoleic Acid Product Type
- Table 12. Key Manufacturers Date of Establishment
- Table 13. Global Palmitoleic Acid Manufacturers Market Concentration Ratio (CR5)
- Table 14. Global Top Manufacturers Market Share by Company Type (Tier 1, Tier 2, and Tier 3) & (based on the Revenue in Palmitoleic Acid as of 2023)
- Table 15. Global Palmitoleic Acid Sales Value by Type: 2019 VS 2023 VS 2030 (US$ Million)
- Table 16. Global Palmitoleic Acid Sales Value by Type (2019-2024) & (US$ Million)
- Table 17. Global Palmitoleic Acid Sales Value by Type (2025-2030) & (US$ Million)
- Table 18. Global Palmitoleic Acid Sales Market Share in Value by Type (2019-2024)
- Table 19. Global Palmitoleic Acid Sales Market Share in Value by Type (2025-2030)
- Table 20. Global Palmitoleic Acid Sales Volume by Type: 2019 VS 2023 VS 2030 (Tons)
- Table 21. Global Palmitoleic Acid Sales Volume by Type (2019-2024) & (Tons)
- Table 22. Global Palmitoleic Acid Sales Volume by Type (2025-2030) & (Tons)
- Table 23. Global Palmitoleic Acid Sales Market Share in Volume by Type (2019-2024)
- Table 24. Global Palmitoleic Acid Sales Market Share in Volume by Type (2025-2030)
- Table 25. Global Palmitoleic Acid Price by Type (2019-2024) & (US$/Kg)
- Table 26. Global Palmitoleic Acid Price by Type (2025-2030) & (US$/Kg)
- Table 27. Global Palmitoleic Acid Sales Value by Application: 2019 VS 2023 VS 2030 (US$ Million)
- Table 28. Global Palmitoleic Acid Sales Value by Application (2019-2024) & (US$ Million)
- Table 29. Global Palmitoleic Acid Sales Value by Application (2025-2030) & (US$ Million)
- Table 30. Global Palmitoleic Acid Sales Market Share in Value by Application (2019-2024)
- Table 31. Global Palmitoleic Acid Sales Market Share in Value by Application (2025-2030)
- Table 32. Global Palmitoleic Acid Sales Volume by Application: 2019 VS 2023 VS 2030 (Tons)
- Table 33. Global Palmitoleic Acid Sales Volume by Application (2019-2024) & (Tons)
- Table 34. Global Palmitoleic Acid Sales Volume by Application (2025-2030) & (Tons)
- Table 35. Global Palmitoleic Acid Sales Market Share in Volume by Application (2019-2024)
- Table 36. Global Palmitoleic Acid Sales Market Share in Volume by Application (2025-2030)
- Table 37. Global Palmitoleic Acid Price by Application (2019-2024) & (US$/Kg)
- Table 38. Global Palmitoleic Acid Price by Application (2025-2030) & (US$/Kg)
- Table 39. Global Palmitoleic Acid Sales Value by Region, (2019 VS 2023 VS 2030) & (US$ Million)
- Table 40. Global Palmitoleic Acid Sales Value by Region (2019-2024) & (US$ Million)
- Table 41. Global Palmitoleic Acid Sales Value by Region (2025-2030) & (US$ Million)
- Table 42. Global Palmitoleic Acid Sales Value by Region (2019-2024) & (%)
- Table 43. Global Palmitoleic Acid Sales Value by Region (2025-2030) & (%)
- Table 44. Global Palmitoleic Acid Sales Volume by Region (Tons): 2019 VS 2023 VS 2030
- Table 45. Global Palmitoleic Acid Sales Volume by Region (2019-2024) & (Tons)
- Table 46. Global Palmitoleic Acid Sales Volume by Region (2025-2030) & (Tons)
- Table 47. Global Palmitoleic Acid Sales Volume by Region (2019-2024) & (%)
- Table 48. Global Palmitoleic Acid Sales Volume by Region (2025-2030) & (%)
- Table 49. Global Palmitoleic Acid Average Price by Region (2019-2024) & (US$/Kg)
- Table 50. Global Palmitoleic Acid Average Price by Region (2025-2030) & (US$/Kg)
- Table 51. Key Countries/Regions Palmitoleic Acid Sales Value Growth Trends, (US$ Million): 2019 VS 2023 VS 2030
- Table 52. Key Countries/Regions Palmitoleic Acid Sales Value, (2019-2024) & (US$ Million)
- Table 53. Key Countries/Regions Palmitoleic Acid Sales Value, (2025-2030) & (US$ Million)
- Table 54. Key Countries/Regions Palmitoleic Acid Sales Volume, (2019-2024) & (Tons)
- Table 55. Key Countries/Regions Palmitoleic Acid Sales Volume, (2025-2030) & (Tons)
- Table 56. Wiley Companies Company Information
- Table 57. Wiley Companies Introduction and Business Overview
- Table 58. Wiley Companies Palmitoleic Acid Sales (Tons), Revenue (US$ Million), Price (US$/Kg) and Gross Margin (2019-2024)
- Table 59. Wiley Companies Palmitoleic Acid Product Offerings
- Table 60. Tersus Life Sciences Company Information
- Table 61. Tersus Life Sciences Introduction and Business Overview
- Table 62. Tersus Life Sciences Palmitoleic Acid Sales (Tons), Revenue (US$ Million), Price (US$/Kg) and Gross Margin (2019-2024)
- Table 63. Tersus Life Sciences Palmitoleic Acid Product Offerings
- Table 64. Aromtech Company Information
- Table 65. Aromtech Introduction and Business Overview
- Table 66. Aromtech Palmitoleic Acid Sales (Tons), Revenue (US$ Million), Price (US$/Kg) and Gross Margin (2019-2024)
- Table 67. Aromtech Palmitoleic Acid Product Offerings
- Table 68. Ethical Naturals Company Information
- Table 69. Ethical Naturals Introduction and Business Overview
- Table 70. Ethical Naturals Palmitoleic Acid Sales (Tons), Revenue (US$ Million), Price (US$/Kg) and Gross Margin (2019-2024)
- Table 71. Ethical Naturals Palmitoleic Acid Product Offerings
- Table 72. Aikon Company Information
- Table 73. Aikon Introduction and Business Overview
- Table 74. Aikon Palmitoleic Acid Sales (Tons), Revenue (US$ Million), Price (US$/Kg) and Gross Margin (2019-2024)
- Table 75. Aikon Palmitoleic Acid Product Offerings
- Table 76. Shanxi Wutai Company Information
- Table 77. Shanxi Wutai Introduction and Business Overview
- Table 78. Shanxi Wutai Palmitoleic Acid Sales (Tons), Revenue (US$ Million), Price (US$/Kg) and Gross Margin (2019-2024)
- Table 79. Shanxi Wutai Palmitoleic Acid Product Offerings
- Table 80. Yuhangren Company Information
- Table 81. Yuhangren Introduction and Business Overview
- Table 82. Yuhangren Palmitoleic Acid Sales (Tons), Revenue (US$ Million), Price (US$/Kg) and Gross Margin (2019-2024)
- Table 83. Yuhangren Palmitoleic Acid Product Offerings
- Table 84. Xinjiang Huihua Company Information
- Table 85. Xinjiang Huihua Introduction and Business Overview
- Table 86. Xinjiang Huihua Palmitoleic Acid Sales (Tons), Revenue (US$ Million), Price (US$/Kg) and Gross Margin (2019-2024)
- Table 87. Xinjiang Huihua Palmitoleic Acid Product Offerings
- Table 88. Key Raw Materials Lists
- Table 89. Raw Materials Key Suppliers Lists
- Table 90. Palmitoleic Acid Downstream Customers
- Table 91. Palmitoleic Acid Distributors List
- Table 92. Research Programs/Design for This Report
- Table 93. Key Data Information from Secondary Sources
- Table 94. Key Data Information from Primary Sources
List of Figures
- Figure 1. Palmitoleic Acid Product Picture
- Figure 2. Global Palmitoleic Acid Sales Value, 2019 VS 2024 VS 2030 (US$ Million)
- Figure 3. Global Palmitoleic Acid Sales Value (2019-2030) & (US$ Million)
- Figure 4. Global Palmitoleic Acid Sales Volume (2019-2030) & (Tons)
- Figure 5. Global Palmitoleic Acid Sales Price (2019-2030) & (US$/Kg)
- Figure 6. Palmitoleic Acid Report Years Considered
- Figure 7. Global Palmitoleic Acid Players Revenue Ranking (2023) & (US$ Million)
- Figure 8. Global Palmitoleic Acid Players Sales Volume Ranking (2023) & (Tons)
- Figure 9. The 5 Largest Manufacturers in the World: Market Share by Palmitoleic Acid Revenue in 2023
- Figure 10. Palmitoleic Acid Market Share by Company Type (Tier 1, Tier 2, and Tier 3): 2019 VS 2023
- Figure 11. Botanical Source Picture
- Figure 12. Marine Source Picture
- Figure 13. Global Palmitoleic Acid Sales Value by Type (2019 VS 2023 VS 2030) & (US$ Million)
- Figure 14. Global Palmitoleic Acid Sales Value Market Share by Type, 2023 & 2030
- Figure 15. Global Palmitoleic Acid Sales Volume by Type (2019 VS 2023 VS 2030) & (Tons)
- Figure 16. Global Palmitoleic Acid Sales Volume Market Share by Type, 2023 & 2030
- Figure 17. Global Palmitoleic Acid Price by Type (2019-2030) & (US$/Kg)
- Figure 18. Product Picture of Dietary Supplements
- Figure 19. Product Picture of Pharmaceuticals
- Figure 20. Product Picture of Cosmetic
- Figure 21. Global Palmitoleic Acid Sales Value by Application (2019 VS 2023 VS 2030) & (US$ Million)
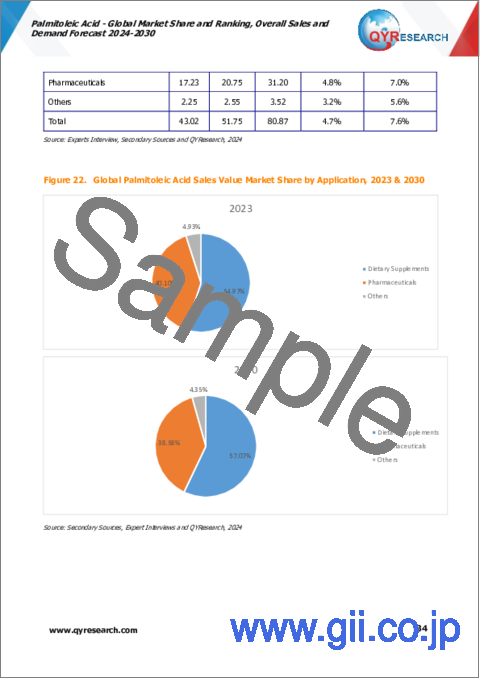
- Figure 22. Global Palmitoleic Acid Sales Value Market Share by Application, 2023 & 2030
- Figure 23. Global Palmitoleic Acid Sales Volume by Application (2019 VS 2023 VS 2030) & (Tons)
- Figure 24. Global Palmitoleic Acid Sales Volume Market Share by Application, 2023 & 2030
- Figure 25. Global Palmitoleic Acid Price by Application (2019-2030) & (US$/Kg)
- Figure 26. North America Palmitoleic Acid Sales Value (2019-2030) & (US$ Million)
- Figure 27. North America Palmitoleic Acid Sales Value by Country (%), 2023 VS 2030
- Figure 28. Europe Palmitoleic Acid Sales Value, (2019-2030) & (US$ Million)
- Figure 29. Europe Palmitoleic Acid Sales Value by Country (%), 2023 VS 2030
- Figure 30. Asia Pacific Palmitoleic Acid Sales Value, (2019-2030) & (US$ Million)
- Figure 31. Asia Pacific Palmitoleic Acid Sales Value by Region (%), 2023 VS 2030
- Figure 32. Latin America Palmitoleic Acid Sales Value, (2019-2030) & (US$ Million)
- Figure 33. Latin America Palmitoleic Acid Sales Value by Country (%), 2023 VS 2030
- Figure 34. Middle East & Africa Palmitoleic Acid Sales Value, (2019-2030) & (US$ Million)
- Figure 35. Middle East & Africa Palmitoleic Acid Sales Value by Country (%), 2023 VS 2030
- Figure 36. United States Palmitoleic Acid Sales Value, (2019-2030) & (US$ Million)
- Figure 37. United States Palmitoleic Acid Sales Value by Type (%), 2023 VS 2030
- Figure 38. United States Palmitoleic Acid Sales Value by Application (%), 2023 VS 2030
- Figure 39. Europe Palmitoleic Acid Sales Value, (2019-2030) & (US$ Million)
- Figure 40. Europe Palmitoleic Acid Sales Value by Type (%), 2023 VS 2030
- Figure 41. Europe Palmitoleic Acid Sales Value by Application (%), 2023 VS 2030
- Figure 42. China Palmitoleic Acid Sales Value, (2019-2030) & (US$ Million)
- Figure 43. China Palmitoleic Acid Sales Value by Type (%), 2023 VS 2030
- Figure 44. China Palmitoleic Acid Sales Value by Application (%), 2023 VS 2030
- Figure 45. Japan Palmitoleic Acid Sales Value, (2019-2030) & (US$ Million)
- Figure 46. Japan Palmitoleic Acid Sales Value by Type (%), 2023 VS 2030
- Figure 47. Japan Palmitoleic Acid Sales Value by Application (%), 2023 VS 2030
- Figure 48. South Korea Palmitoleic Acid Sales Value, (2019-2030) & (US$ Million)
- Figure 49. South Korea Palmitoleic Acid Sales Value by Type (%), 2023 VS 2030
- Figure 50. South Korea Palmitoleic Acid Sales Value by Application (%), 2023 VS 2030
- Figure 51. Southeast Asia Palmitoleic Acid Sales Value, (2019-2030) & (US$ Million)
- Figure 52. Southeast Asia Palmitoleic Acid Sales Value by Type (%), 2023 VS 2030
- Figure 53. Southeast Asia Palmitoleic Acid Sales Value by Application (%), 2023 VS 2030
- Figure 54. India Palmitoleic Acid Sales Value, (2019-2030) & (US$ Million)
- Figure 55. India Palmitoleic Acid Sales Value by Type (%), 2023 VS 2030
- Figure 56. India Palmitoleic Acid Sales Value by Application (%), 2023 VS 2030
- Figure 57. Palmitoleic Acid Industrial Chain
- Figure 58. Palmitoleic Acid Manufacturing Cost Structure
- Figure 59. Bottom-up and Top-down Approaches for This Report
- Figure 60. Data Triangulation
- Figure 61. Key Executives Interviewed
The global market for Palmitoleic Acid was estimated to be worth US$ 51.75 million in 2023. It is forecast to a readjusted size of US$ 80.87 million by 2030 with a CAGR of 7.6% during the forecast period 2024-2030.
North American market for Palmitoleic Acid was valued at $ 6.24 million in 2023. It will reach $ 9.54 million by 2030, at a CAGR of 7.1% during the forecast period of 2024 through 2030.
Asia-Pacific market for Palmitoleic Acid was valued at $ 37.21 million in 2023. It will reach $ 58.43 million by 2030, at a CAGR of 7.7% during the forecast period of 2024 through 2030.
Europe market for Palmitoleic Acid was valued at $ 6.13 million in 2023. It will reach $ 9.56 million by 2030, at a CAGR of 7.5% during the forecast period of 2024 through 2030.
The global key companies of Palmitoleic Acid include Wiley Companies, Tersus Life Sciences, Aromtech, Ethical Naturals, Aikon, Shanxi Wutai, Yuhangren, Xinjiang Huihua, and etc. In 2023, the global five largest players hold a share approximately 77.74% in terms of revenue.
This report aims to provide a comprehensive presentation of the global market for Palmitoleic Acid, focusing on the total sales volume, sales revenue, price, key companies market share and ranking, together with an analysis of Palmitoleic Acid by region & country, by Type, and by Application.
The Palmitoleic Acid market size, estimations, and forecasts are provided in terms of sales volume (Tons) and sales revenue ($ millions), considering 2023 as the base year, with history and forecast data for the period from 2019 to 2030. With both quantitative and qualitative analysis, to help readers develop business/growth strategies, assess the market competitive situation, analyze their position in the current marketplace, and make informed business decisions regarding Palmitoleic Acid.
Market Segmentation
By Company
- Wiley Companies
- Tersus Life Sciences
- Aromtech
- Ethical Naturals
- Aikon
- Shanxi Wutai
- Yuhangren
- Xinjiang Huihua
Segment by Type
- Botanical Source
- Marine Source
Segment by Application
- Dietary Supplements
- Pharmaceuticals
- Others
By Region
- North America
- United States
- Canada
- Asia-Pacific
- China
- Japan
- South Korea
- Southeast Asia
- India
- Australia
- Europe
- Germany
- France
- U.K.
- Italy
- Nordic Countries
- Rest of Europe
- Latin America
- Mexico
- Brazil
- Rest of Latin America
- Middle East & Africa
- Turkey
- Saudi Arabia
- UAE
- Rest of MEA
Chapter Outline
Chapter 1: Introduces the report scope of the report, global total market size (valve, volume and price). This chapter also provides the market dynamics, latest developments of the market, the driving factors and restrictive factors of the market, the challenges and risks faced by manufacturers in the industry, and the analysis of relevant policies in the industry.
Chapter 2: Detailed analysis of Palmitoleic Acid manufacturers competitive landscape, price, sales and revenue market share, latest development plan, merger, and acquisition information, etc.
Chapter 3: Provides the analysis of various market segments by Type, covering the market size and development potential of each market segment, to help readers find the blue ocean market in different market segments.
Chapter 4: Provides the analysis of various market segments by Application, covering the market size and development potential of each market segment, to help readers find the blue ocean market in different downstream markets.
Chapter 5: Sales, revenue of Palmitoleic Acid in regional level. It provides a quantitative analysis of the market size and development potential of each region and introduces the market development, future development prospects, market space, and market size of each country in the world.
Chapter 6: Sales, revenue of Palmitoleic Acid in country level. It provides sigmate data by Type, and by Application for each country/region.
Chapter 7: Provides profiles of key players, introducing the basic situation of the main companies in the market in detail, including product sales, revenue, price, gross margin, product introduction, recent development, etc.
Chapter 8: Analysis of industrial chain, including the upstream and downstream of the industry.
Chapter 9: Conclusion.
Table of Contents
1 Market Overview
- 1.1 Palmitoleic Acid Product Introduction
- 1.2 Global Palmitoleic Acid Market Size Forecast
- 1.2.1 Global Palmitoleic Acid Sales Value (2019-2030)
- 1.2.2 Global Palmitoleic Acid Sales Volume (2019-2030)
- 1.2.3 Global Palmitoleic Acid Sales Price (2019-2030)
- 1.3 Palmitoleic Acid Market Trends & Drivers
- 1.3.1 Palmitoleic Acid Industry Trends
- 1.3.2 Palmitoleic Acid Market Drivers & Opportunity
- 1.3.3 Palmitoleic Acid Market Challenges
- 1.3.4 Palmitoleic Acid Market Restraints
- 1.4 Assumptions and Limitations
- 1.5 Study Objectives
- 1.6 Years Considered
2 Competitive Analysis by Company
- 2.1 Global Palmitoleic Acid Players Revenue Ranking (2023)
- 2.2 Global Palmitoleic Acid Revenue by Company (2019-2024)
- 2.3 Global Palmitoleic Acid Players Sales Volume Ranking (2023)
- 2.4 Global Palmitoleic Acid Sales Volume by Company Players (2019-2024)
- 2.5 Global Palmitoleic Acid Average Price by Company (2019-2024)
- 2.6 Key Manufacturers Palmitoleic Acid Manufacturing Base and Headquarters
- 2.7 Key Manufacturers Palmitoleic Acid Product Offered
- 2.8 Key Manufacturers Date of Establishment
- 2.9 Palmitoleic Acid Market Competitive Analysis
- 2.9.1 Palmitoleic Acid Market Concentration Rate (2019-2024)
- 2.9.2 Global 5 Largest Manufacturers by Palmitoleic Acid Revenue in 2023
- 2.9.3 Global Top Manufacturers by Company Type (Tier 1, Tier 2, and Tier 3) & (based on the Revenue in Palmitoleic Acid as of 2023)
3 Segmentation by Type
- 3.1 Introduction by Type
- 3.1.1 Botanical Source
- 3.1.2 Marine Source
- 3.2 Global Palmitoleic Acid Sales Value by Type
- 3.2.1 Global Palmitoleic Acid Sales Value by Type (2019 VS 2023 VS 2030)
- 3.2.2 Global Palmitoleic Acid Sales Value, by Type (2019-2030)
- 3.2.3 Global Palmitoleic Acid Sales Value, by Type (%) (2019-2030)
- 3.3 Global Palmitoleic Acid Sales Volume by Type
- 3.3.1 Global Palmitoleic Acid Sales Volume by Type (2019 VS 2023 VS 2030)
- 3.3.2 Global Palmitoleic Acid Sales Volume, by Type (2019-2030)
- 3.3.3 Global Palmitoleic Acid Sales Volume, by Type (%) (2019-2030)
- 3.4 Global Palmitoleic Acid Average Price by Type (2019-2030)
4 Segmentation by Application
- 4.1 Introduction by Application
- 4.1.1 Dietary Supplements
- 4.1.2 Pharmaceuticals
- 4.1.3 Others
- 4.2 Global Palmitoleic Acid Sales Value by Application
- 4.2.1 Global Palmitoleic Acid Sales Value by Application (2019 VS 2023 VS 2030)
- 4.2.2 Global Palmitoleic Acid Sales Value, by Application (2019-2030)
- 4.2.3 Global Palmitoleic Acid Sales Value, by Application (%) (2019-2030)
- 4.3 Global Palmitoleic Acid Sales Volume by Application
- 4.3.1 Global Palmitoleic Acid Sales Volume by Application (2019 VS 2023 VS 2030)
- 4.3.2 Global Palmitoleic Acid Sales Volume, by Application (2019-2030)
- 4.3.3 Global Palmitoleic Acid Sales Volume, by Application (%) (2019-2030)
- 4.4 Global Palmitoleic Acid Average Price by Application (2019-2030)
5 Segmentation by Region
- 5.1 Global Palmitoleic Acid Sales Value by Region
- 5.1.1 Global Palmitoleic Acid Sales Value by Region: 2019 VS 2023 VS 2030
- 5.1.2 Global Palmitoleic Acid Sales Value by Region (2019-2024)
- 5.1.3 Global Palmitoleic Acid Sales Value by Region (2025-2030)
- 5.1.4 Global Palmitoleic Acid Sales Value by Region (%), (2019-2030)
- 5.2 Global Palmitoleic Acid Sales Volume by Region
- 5.2.1 Global Palmitoleic Acid Sales Volume by Region: 2019 VS 2023 VS 2030
- 5.2.2 Global Palmitoleic Acid Sales Volume by Region (2019-2024)
- 5.2.3 Global Palmitoleic Acid Sales Volume by Region (2025-2030)
- 5.2.4 Global Palmitoleic Acid Sales Volume by Region (%), (2019-2030)
- 5.3 Global Palmitoleic Acid Average Price by Region (2019-2030)
- 5.4 North America
- 5.4.1 North America Palmitoleic Acid Sales Value, 2019-2030
- 5.4.2 North America Palmitoleic Acid Sales Value by Country (%), 2023 VS 2030
- 5.5 Europe
- 5.5.1 Europe Palmitoleic Acid Sales Value, 2019-2030
- 5.5.2 Europe Palmitoleic Acid Sales Value by Country (%), 2023 VS 2030
- 5.6 Asia Pacific
- 5.6.1 Asia Pacific Palmitoleic Acid Sales Value, 2019-2030
- 5.6.2 Asia Pacific Palmitoleic Acid Sales Value by Region (%), 2023 VS 2030
- 5.7 Latin America
- 5.7.1 Latin America Palmitoleic Acid Sales Value, 2019-2030
- 5.7.2 Latin America Palmitoleic Acid Sales Value by Country (%), 2023 VS 2030
- 5.8 Middle East & Africa
- 5.8.1 Middle East & Africa Palmitoleic Acid Sales Value, 2019-2030
- 5.8.2 Middle East & Africa Palmitoleic Acid Sales Value by Country (%), 2023 VS 2030
6 Segmentation by Key Countries/Regions
- 6.1 Key Countries/Regions Palmitoleic Acid Sales Value Growth Trends, 2019 VS 2023 VS 2030
- 6.2 Key Countries/Regions Palmitoleic Acid Sales Value
- 6.2.1 Key Countries/Regions Palmitoleic Acid Sales Value, 2019-2030
- 6.2.2 Key Countries/Regions Palmitoleic Acid Sales Volume, 2019-2030
- 6.3 United States
- 6.3.1 United States Palmitoleic Acid Sales Value, 2019-2030
- 6.3.2 United States Palmitoleic Acid Sales Value by Type (%), 2023 VS 2030
- 6.3.3 United States Palmitoleic Acid Sales Value by Application, 2023 VS 2030
- 6.4 Europe
- 6.4.1 Europe Palmitoleic Acid Sales Value, 2019-2030
- 6.4.2 Europe Palmitoleic Acid Sales Value by Type (%), 2023 VS 2030
- 6.4.3 Europe Palmitoleic Acid Sales Value by Application, 2023 VS 2030
- 6.5 China
- 6.5.1 China Palmitoleic Acid Sales Value, 2019-2030
- 6.5.2 China Palmitoleic Acid Sales Value by Type (%), 2023 VS 2030
- 6.5.3 China Palmitoleic Acid Sales Value by Application, 2023 VS 2030
- 6.6 Japan
- 6.6.1 Japan Palmitoleic Acid Sales Value, 2019-2030
- 6.6.2 Japan Palmitoleic Acid Sales Value by Type (%), 2023 VS 2030
- 6.6.3 Japan Palmitoleic Acid Sales Value by Application, 2023 VS 2030
- 6.7 South Korea
- 6.7.1 South Korea Palmitoleic Acid Sales Value, 2019-2030
- 6.7.2 South Korea Palmitoleic Acid Sales Value by Type (%), 2023 VS 2030
- 6.7.3 South Korea Palmitoleic Acid Sales Value by Application, 2023 VS 2030
- 6.8 Southeast Asia
- 6.8.1 Southeast Asia Palmitoleic Acid Sales Value, 2019-2030
- 6.8.2 Southeast Asia Palmitoleic Acid Sales Value by Type (%), 2023 VS 2030
- 6.8.3 Southeast Asia Palmitoleic Acid Sales Value by Application, 2023 VS 2030
- 6.9 India
- 6.9.1 India Palmitoleic Acid Sales Value, 2019-2030
- 6.9.2 India Palmitoleic Acid Sales Value by Type (%), 2023 VS 2030
- 6.9.3 India Palmitoleic Acid Sales Value by Application, 2023 VS 2030
7 Company Profiles
- 7.1 Wiley Companies
- 7.1.1 Wiley Companies Company Information
- 7.1.2 Wiley Companies Introduction and Business Overview
- 7.1.3 Wiley Companies Palmitoleic Acid Sales, Revenue, Price and Gross Margin (2019-2024)
- 7.1.4 Wiley Companies Palmitoleic Acid Product Offerings
- 7.2 Tersus Life Sciences
- 7.2.1 Tersus Life Sciences Company Information
- 7.2.2 Tersus Life Sciences Introduction and Business Overview
- 7.2.3 Tersus Life Sciences Palmitoleic Acid Sales, Revenue, Price and Gross Margin (2019-2024)
- 7.2.4 Tersus Life Sciences Palmitoleic Acid Product Offerings
- 7.3 Aromtech
- 7.3.1 Aromtech Company Information
- 7.3.2 Aromtech Introduction and Business Overview
- 7.3.3 Aromtech Palmitoleic Acid Sales, Revenue, Price and Gross Margin (2019-2024)
- 7.3.4 Aromtech Palmitoleic Acid Product Offerings
- 7.4 Ethical Naturals
- 7.4.1 Ethical Naturals Company Information
- 7.4.2 Ethical Naturals Introduction and Business Overview
- 7.4.3 Ethical Naturals Palmitoleic Acid Sales, Revenue, Price and Gross Margin (2019-2024)
- 7.4.4 Ethical Naturals Palmitoleic Acid Product Offerings
- 7.5 Aikon
- 7.5.1 Aikon Company Information
- 7.5.2 Aikon Introduction and Business Overview
- 7.5.3 Aikon Palmitoleic Acid Sales, Revenue, Price and Gross Margin (2019-2024)
- 7.5.4 Aikon Palmitoleic Acid Product Offerings
- 7.6 Shanxi Wutai
- 7.6.1 Shanxi Wutai Company Information
- 7.6.2 Shanxi Wutai Introduction and Business Overview
- 7.6.3 Shanxi Wutai Palmitoleic Acid Sales, Revenue, Price and Gross Margin (2019-2024)
- 7.6.4 Shanxi Wutai Palmitoleic Acid Product Offerings
- 7.7 Yuhangren
- 7.7.1 Yuhangren Company Information
- 7.7.2 Yuhangren Introduction and Business Overview
- 7.7.3 Yuhangren Palmitoleic Acid Sales, Revenue, Price and Gross Margin (2019-2024)
- 7.7.4 Yuhangren Palmitoleic Acid Product Offerings
- 7.8 Xinjiang Huihua
- 7.8.1 Xinjiang Huihua Company Information
- 7.8.2 Xinjiang Huihua Introduction and Business Overview
- 7.8.3 Xinjiang Huihua Palmitoleic Acid Sales, Revenue, Price and Gross Margin (2019-2024)
- 7.8.4 Xinjiang Huihua Palmitoleic Acid Product Offerings
8 Industry Chain Analysis
- 8.1 Palmitoleic Acid Industrial Chain
- 8.2 Palmitoleic Acid Upstream Analysis
- 8.2.1 Key Raw Materials
- 8.2.2 Raw Materials Key Suppliers
- 8.2.3 Manufacturing Cost Structure
- 8.3 Midstream Analysis
- 8.4 Downstream Analysis (Customers Analysis)
- 8.5 Sales Model and Sales Channels
- 8.5.1 Palmitoleic Acid Sales Model
- 8.5.2 Sales Channel
- 8.5.3 Palmitoleic Acid Distributors
9 Research Findings and Conclusion
10 Appendix
- 10.1 Research Methodology
- 10.1.1 Methodology/Research Approach
- 10.1.2 Data Source
- 10.2 Author Details
- 10.3 Disclaimer

