|
|
市場調査レポート
商品コード
1462829
ターンテーブル - 世界市場のシェアとランキング、全体の売上と需要の予測(2024年~2030年)Turntables - Global Market Share and Ranking, Overall Sales and Demand Forecast 2024-2030 |
||||||

|
|||||||
カスタマイズ可能
適宜更新あり
|
|||||||

| ターンテーブル - 世界市場のシェアとランキング、全体の売上と需要の予測(2024年~2030年) |
|
出版日: 2024年04月13日
発行: QYResearch
ページ情報: 英文 165 Pages
納期: 2~3営業日
|

全表示
- 概要
- 図表
- 目次
世界のターンテーブルの市場規模は、2023年に3億6,085万米ドルと推定され、2030年までに5億3,065万米ドルに達すると予測され、2024年~2030年の予測期間にCAGRで5.59%の成長が見込まれます。
北米の市場規模は、2023年に1億6,619万米ドルであり、2030年までに2億4,925万米ドルに達する見込みで、予測期間のCAGRは5.97%です。
アジア太平洋の市場規模は、2023年に2,939万米ドルであり、2030年までに4,039万米ドルに達する見込みで、予測期間のCAGRは4.55%です。
欧州の市場規模は、2023年に1億4,852万米ドルであり、2030年までに2億1,626万米ドルに達する見込みで、予測期間のCAGRは5.36%です。
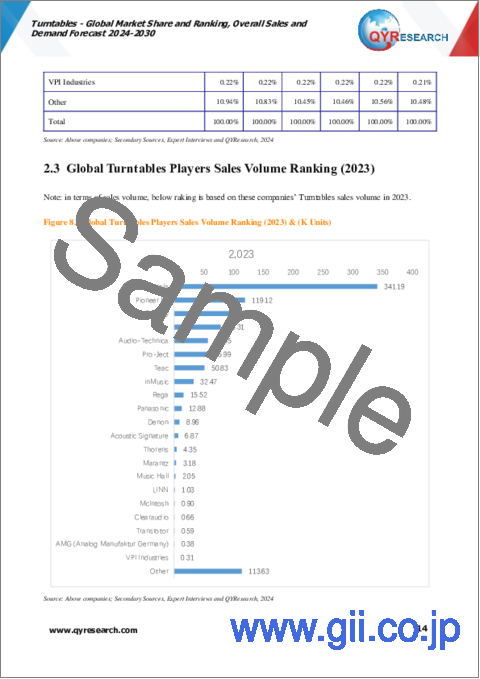
世界のターンテーブルの主要企業は、Pro-Ject、Victrola、Pioneer DJ、Panasonic、Crosley、Sony、Teac、Audio-Technica、Regaなどです。2023年、世界の主要5社が収益で約57.87%のシェアを占めました。
当レポートでは、世界のターンテーブル市場について調査分析し、各地域の市場規模と予測、企業プロファイル、技術動向、新製品開発などの情報を提供しています。
目次
第1章 市場の概要
- ターンテーブル製品のイントロダクション
- 世界のターンテーブルの市場規模の予測
- 世界のターンテーブルの売上金額(2019年~2030年)
- 世界のターンテーブルの売上数量(2019年~2030年)
- 世界のターンテーブルの販売価格(2019年~2030年)
- ターンテーブル市場の動向と促進要因
- ターンテーブル産業の動向
- ターンテーブル市場の促進要因と機会
- ターンテーブル市場の課題
- ターンテーブル市場の抑制要因
- 前提条件と制限
- 調査目的
- 考慮される年数
第2章 競合分析:企業別
- 世界のターンテーブル企業の収益ランキング(2023年)
- 世界のターンテーブルの収益:企業別(2019年~2024年)
- 世界のターンテーブル企業の売上数量ランキング(2023年)
- 世界のターンテーブルの売上数量:企業別(2019年~2024年)
- 世界のターンテーブルの平均価格:企業別(2019年~2024年)
- 主要メーカーのターンテーブル製造拠点とサービス地域
- 主要ターンテーブルメーカーの設立時期
- ターンテーブル市場競合分析
- ターンテーブルの市場集中度(2019年~2024年)
- 世界のターンテーブル収益の5大・10大メーカー(2023年)
- 世界の主要メーカー:企業タイプ別(Tier 1・Tier 2・Tier 3)(2023年時点のターンテーブルの収益に基づく)
- 合併と買収、拡大
第3章 セグメント:タイプ別
- イントロダクション:タイプ別
- ダイレクトドライブ
- ベルトドライブ
- その他
- 世界のターンテーブルの売上金額:タイプ別
- 世界のターンテーブルの売上金額:タイプ別(2019年・2023年・2030年)
- 世界のターンテーブルの売上金額:タイプ別(2019年~2030年)
- 世界のターンテーブルの売上金額:タイプ別(2019年~2030年)
- 世界のターンテーブルの売上数量:タイプ別
- 世界のターンテーブルの売上数量:タイプ別(2019年・2023年・2030年)
- 世界のターンテーブルの売上数量:タイプ別(2019年~2030年)
- 世界のターンテーブルの売上数量:タイプ別(2019年~2030年)
- 世界のターンテーブルの平均価格:タイプ別(2019年~2030年)
第4章 セグメント:用途別
- イントロダクション:用途別
- 商業
- 家庭
- 世界のターンテーブルの売上金額:用途別
- 世界のターンテーブルの売上金額:用途別(2019年・2023年・2030年)
- 世界のターンテーブルの売上金額:用途別(2019年~2030年)
- 世界のターンテーブルの売上金額:用途別(2019年~2030年)
- 世界のターンテーブルの売上数量:用途別
- 世界のターンテーブルの売上数量:用途別(2019年・2023年・2030年)
- 世界のターンテーブルの売上数量:用途別(2019年~2030年)
- 世界のターンテーブルの売上数量:用途別(2019年~2030年)
- 世界のターンテーブルの平均価格:用途別(2019年~2030年)
第5章 セグメント:地域別
- 世界のターンテーブルの売上金額:地域別
- 世界のターンテーブルの売上金額:地域別(2019年・2023年・2030年)
- 世界のターンテーブルの売上金額:地域別(2019年~2024年)
- 世界のターンテーブルの売上金額:地域別(2025年~2030年)
- 世界のターンテーブルの売上金額:地域別(2019年~2030年)
- 世界のターンテーブルの売上数量:地域別
- 世界のターンテーブルの売上数量:地域別(2019年・2023年・2030年)
- 世界のターンテーブルの売上数量:地域別(2019年~2024年)
- 世界のターンテーブルの売上数量:地域別(2025年~2030年)
- 世界のターンテーブルの売上数量:地域別(2019年~2030年)
- 世界のターンテーブルの平均価格:地域別(2019年~2030年)
- 北米
- 北米のターンテーブルの売上金額(2019年~2030年)
- 北米のターンテーブルの売上金額:国別(2023年・2030年)
- 欧州
- 欧州のターンテーブルの売上金額(2019年~2030年)
- 欧州のターンテーブルの売上金額:国別(2023年・2030年)
- アジア太平洋
- アジア太平洋のターンテーブルの売上金額(2019年~2030年)
- アジア太平洋のターンテーブルの売上金額:地域別(2023年・2030年)
- ラテンアメリカ
- ラテンアメリカのターンテーブルの売上金額(2019年~2030年)
- ラテンアメリカのターンテーブルの売上金額:国別(2023年・2030年)
- 中東・アフリカ
第6章 セグメント:主要国/地域別
- 主要国/地域のターンテーブルの売上金額の成長動向(2019年・2023年・2030年)
- 主要国/地域のターンテーブルの売上金額
- 主要国/地域のターンテーブルの売上金額(2019年~2030年)
- 主要国/地域のターンテーブルの売上数量(2019年~2030年)
- 米国
- 米国のターンテーブルの売上金額(2019年~2030年)
- 米国のターンテーブルの売上金額:タイプ別(2023年・2030年)
- 米国のターンテーブルの売上金額:用途別(2023年・2030年)
- 欧州
- 欧州のターンテーブルの売上金額(2019年~2030年)
- 欧州のターンテーブルの売上金額:タイプ別(2023年・2030年)
- 欧州のターンテーブルの売上金額:用途別(2023年・2030年)
- 中国
- 中国のターンテーブルの売上金額(2019年~2030年)
- 中国のターンテーブルの売上金額:タイプ別(2023年・2030年)
- 中国のターンテーブルの売上金額:用途別(2023年・2030年)
- 日本
- 日本のターンテーブルの売上金額(2019年~2030年)
- 日本のターンテーブルの売上金額:タイプ別(2023年・2030年)
- 日本のターンテーブルの売上金額:用途別(2023年・2030年)
- 韓国
- 韓国のターンテーブルの売上金額(2019年~2030年)
- 韓国のターンテーブルの売上金額:タイプ別(2023年・2030年)
- 韓国のターンテーブルの売上金額:用途別(2023年・2030年)
- 東南アジア
- 東南アジアのターンテーブルの売上金額(2019年~2030年)
- 東南アジアのターンテーブルの売上金額:タイプ別(2023年・2030年)
- 東南アジアのターンテーブルの売上金額:用途別(2023年・2030年)
- インド
- インドのターンテーブルの売上金額(2019年~2030年)
- インドのターンテーブルの売上金額:タイプ別(2023年・2030年)
- インドのターンテーブルの売上金額:用途別(2023年・2030年)
第7章 企業プロファイル
- Pro-Ject
- Victrola
- Pioneer DJ
- Panasonic
- Crosley
- Sony
- Teac
- Audio-Technica
- Rega
- LINN
- InMusic
- Marantz
- Mclntosh
- AMG (Analog Manufaktur Germany)
- Thorens
- Acoustic Signature
- Denon
- Transrotor
- Clearaudio
- Music Hall
- VPI Industries
第8章 産業チェーン分析
- ターンテーブルの産業チェーン
- ターンテーブルの上流分析
- 主な原材料
- 原材料の主要サプライヤー
- 製造コスト構造
- 中流分析
- 下流分析(顧客分析)
- 販売モデルと販売チャネル
- ターンテーブルの販売モデル
- 販売チャネル
- ターンテーブルの販売業者
第9章 調査結果と結論
第10章 付録
List of Tables
- Table 1. Turntables Market Trends
- Table 2. Turntables Market Drivers & Opportunity
- Table 3. Turntables Market Challenges
- Table 4. Turntables Market Restraints
- Table 5. Global Turntables Revenue by Company (2019-2024) & (US$ Million)
- Table 6. Global Turntables Revenue Market Share by Company (2019-2024)
- Table 7. Global Turntables Sales Volume by Company (2019-2024) & (K Units)
- Table 8. Global Turntables Sales Volume Market Share by Company (2019-2024)
- Table 9. Global Market Turntables Price by Company (2019-2024) & (US$/Unit)
- Table 10. Key Manufacturers Turntables Manufacturing Base and Area Served
- Table 11. Key Turntables Manufacturers Established Time
- Table 12. Global Turntables Manufacturers Market Concentration Ratio (CR5)
- Table 13. Global Top Manufacturers Market Share by Company Type (Tier 1, Tier 2, and Tier 3) & (based on the Revenue in Turntables as of 2023)
- Table 14. Global Turntables Sales Value by Type: 2019 VS 2023 VS 2030 (US$ Million)
- Table 15. Global Turntables Sales Value by Type (2019-2024) & (US$ Million)
- Table 16. Global Turntables Sales Value by Type (2025-2030) & (US$ Million)
- Table 17. Global Turntables Sales Market Share in Value by Type (2019-2024)
- Table 18. Global Turntables Sales Market Share in Value by Type (2025-2030)
- Table 19. Global Turntables Sales Volume by Type: 2019 VS 2023 VS 2030 (K Units)
- Table 20. Global Turntables Sales Volume by Type (2019-2024) & (K Units)
- Table 21. Global Turntables Sales Volume by Type (2025-2030) & (K Units)
- Table 22. Global Turntables Sales Market Share in Value by Type (2019-2024)
- Table 23. Global Turntables Sales Market Share in Value by Type (2025-2030)
- Table 24. Global Turntables Price by Type (2019-2024) & (US$/Unit)
- Table 25. Global Turntables Price by Type (2025-2030) & (US$/Unit)
- Table 26. Global Turntables Sales Value by Application: 2019 VS 2023 VS 2030 (US$ Million)
- Table 27. Global Turntables Sales Value by Application (2019-2024) & (US$ Million)
- Table 28. Global Turntables Sales Value by Application (2025-2030) & (US$ Million)
- Table 29. Global Turntables Sales Market Share in Value by Application (2019-2024)
- Table 30. Global Turntables Sales Market Share in Value by Application (2025-2030)
- Table 31. Global Turntables Sales Volume by Application: 2019 VS 2023 VS 2030 (K Units)
- Table 32. Global Turntables Sales Volume by Application (2019-2024) & (K Units)
- Table 33. Global Turntables Sales Volume by Application (2025-2030) & (K Units)
- Table 34. Global Turntables Sales Market Share in Value by Application (2019-2024)
- Table 35. Global Turntables Sales Market Share in Value by Application (2025-2030)
- Table 36. Global Turntables Price by Application (2019-2024) & (US$/Unit)
- Table 37. Global Turntables Price by Application (2025-2030) & (US$/Unit)
- Table 38. Global Turntables Sales Value by Region, (2019 VS 2023 VS 2030) & (US$ Million)
- Table 39. Global Turntables Sales Value by Region (2019-2024) & (US$ Million)
- Table 40. Global Turntables Sales Value by Region (2025-2030) & (US$ Million)
- Table 41. Global Turntables Sales Value by Region (2019-2024) & (%)
- Table 42. Global Turntables Sales Value by Region (2025-2030) & (%)
- Table 43. Global Turntables Sales Volume by Region (K Units): 2019 VS 2023 VS 2030
- Table 44. Global Turntables Sales Volume by Region (2019-2024) & (K Units)
- Table 45. Global Turntables Sales Volume by Region (2025-2030) & (K Units)
- Table 46. Global Turntables Sales Volume by Region (2019-2024) & (%)
- Table 47. Global Turntables Sales Volume by Region (2025-2030) & (%)
- Table 48. Global Turntables Average Price by Region (2019-2024) & (US$/Unit)
- Table 49. Global Turntables Average Price by Region (2025-2030) & (US$/Unit)
- Table 50. Key Countries/Regions Turntables Sales Value Growth Trends, (US$ Million): 2019 VS 2023 VS 2030
- Table 51. Key Countries/Regions Turntables Sales Value, (2019-2024) & (US$ Million)
- Table 52. Key Countries/Regions Turntables Sales Value, (2025-2030) & (US$ Million)
- Table 53. Key Countries/Regions Turntables Sales Volume, (2019-2024) & (K Units)
- Table 54. Key Countries/Regions Turntables Sales Volume, (2025-2030) & (K Units)
- Table 55. Pro-Ject Basic Information, Manufacturing Base, Sales Area and Its Competitors
- Table 56. Pro-Ject Turntables Sales (K Units), Revenue (US$ Million), Price (US$/Unit) and Gross Margin (%) (2019-2024)
- Table 57. Victrola Basic Information, Manufacturing Base, Sales Area and Its Competitors
- Table 58. Victrola Turntables Sales (K Units), Revenue (US$ Million), Price (US$/Unit) and Gross Margin (%) (2019-2024)
- Table 59. Pioneer DJ Basic Information, Manufacturing Base, Sales Area and Its Competitors
- Table 60. Pioneer DJ Turntables Sales (K Units), Revenue (US$ Million), Price (US$/Unit) and Gross Margin (%) (2019-2024)
- Table 61. Panasonic Basic Information, Manufacturing Base, Sales Area and Its Competitors
- Table 62. Panasonic Turntables Sales (K Units), Revenue (US$ Million), Price (US$/Unit) and Gross Margin (%) (2019-2024)
- Table 63. Crosley Basic Information, Manufacturing Base, Sales Area and Its Competitors
- Table 64. Crosley Turntables Sales (K Units), Revenue (US$ Million), Price (US$/Unit) and Gross Margin (%) (2019-2024)
- Table 65. Sony Basic Information, Manufacturing Base, Sales Area and Its Competitors
- Table 66. Sony Turntables Sales (K Units), Revenue (US$ Million), Price (US$/Unit) and Gross Margin (%) (2019-2024)
- Table 67. Teac Basic Information, Manufacturing Base, Sales Area and Its Competitors
- Table 68. Teac Turntables Sales (K Units), Revenue (US$ Million), Price (US$/Unit) and Gross Margin (%) (2019-2024)
- Table 69. Audio-Technica Basic Information, Manufacturing Base, Sales Area and Its Competitors
- Table 70. Audio-Technica Turntables Sales (K Units), Revenue (US$ Million), Price (US$/Unit) and Gross Margin (%) (2019-2024)
- Table 71. Rega Basic Information, Manufacturing Base, Sales Area and Its Competitors
- Table 72. Rega Turntables Sales (K Units), Revenue (US$ Million), Price (US$/Unit) and Gross Margin (%) (2019-2024)
- Table 73. LINN Basic Information, Manufacturing Base, Sales Area and Its Competitors
- Table 74. LINN Turntables Sales (K Units), Revenue (US$ Million), Price (US$/Unit) and Gross Margin (%) (2019-2024)
- Table 75. InMusic Basic Information, Manufacturing Base, Sales Area and Its Competitors
- Table 76. InMusic Turntables Sales (K Units), Revenue (US$ Million), Price (US$/Unit) and Gross Margin (%) (2019-2024)
- Table 77. Marantz Basic Information, Manufacturing Base, Sales Area and Its Competitors
- Table 78. Marantz Turntables Sales (K Units), Revenue (US$ Million), Price (US$/Unit) and Gross Margin (%) (2019-2024)
- Table 79. Mclntosh Basic Information, Manufacturing Base, Sales Area and Its Competitors
- Table 80. Mclntosh Turntables Sales (K Units), Revenue (US$ Million), Price (US$/Unit) and Gross Margin (%) (2019-2024)
- Table 81. AMG (Analog Manufaktur Germany) Basic Information, Manufacturing Base, Sales Area and Its Competitors
- Table 82. AMG (Analog Manufaktur Germany) Turntables Sales (K Units), Revenue (US$ Million), Price (US$/Unit) and Gross Margin (%) (2019-2024)
- Table 83. Thorens Basic Information, Manufacturing Base, Sales Area and Its Competitors
- Table 84. Thorens Turntables Sales (K Units), Revenue (US$ Million), Price (US$/Unit) and Gross Margin (%) (2019-2024)
- Table 85. Acoustic Signature Basic Information, Manufacturing Base, Sales Area and Its Competitors
- Table 86. Acoustic Signature Turntables Sales (K Units), Revenue (US$ Million), Price (US$/Unit) and Gross Margin (%) (2019-2024)
- Table 87. Denon Basic Information, Manufacturing Base, Sales Area and Its Competitors
- Table 88. Denon Turntables Sales (K Units), Revenue (US$ Million), Price (US$/Unit) and Gross Margin (%) (2019-2024)
- Table 89. Transrotor Basic Information, Manufacturing Base, Sales Area and Its Competitors
- Table 90. Transrotor Turntables Sales (K Units), Revenue (US$ Million), Price (US$/Unit) and Gross Margin (%) (2019-2024)
- Table 91. Clearaudio Basic Information, Manufacturing Base, Sales Area and Its Competitors
- Table 92. Clearaudio Turntables Sales (K Units), Revenue (US$ Million), Price (US$/Unit) and Gross Margin (%) (2019-2024)
- Table 93. Music Hall Basic Information, Manufacturing Base, Sales Area and Its Competitors
- Table 94. Music Hall Turntables Sales (K Units), Revenue (US$ Million), Price (US$/Unit) and Gross Margin (%) (2019-2024)
- Table 95. VPI Industries Basic Information, Manufacturing Base, Sales Area and Its Competitors
- Table 96. VPI Industries Turntables Sales (K Units), Revenue (US$ Million), Price (US$/Unit) and Gross Margin (%) (2019-2024)
- Table 97. Raw Materials Key Suppliers Examples Lists
- Table 98. Turntables Key Players List
- Table 99. Turntables Distributors Examples List
- Table 100. Research Programs/Design for This Report
- Table 101. Key Data Information from Secondary Sources
- Table 102. Key Data Information from Primary Sources
List of Figures
- Figure 1. Turntables Product Picture
- Figure 2. Global Turntables Sales Value, 2019 VS 2024 VS 2030 (US$ Million)
- Figure 3. Global Turntables Sales Value (2019-2030) & (US$ Million)
- Figure 4. Global Turntables Sales Volume (2019-2030) & (K Units)
- Figure 5. Global Turntables Sales Price (2019-2030) & (US$/Unit)
- Figure 6. Turntables Report Years Considered
- Figure 7. Global Turntables Players Revenue Ranking (2023) & (US$ Million)
- Figure 8. Global Turntables Players Sales Volume Ranking (2023) & (K Units)
- Figure 9. The 5 and 10 Largest Manufacturers in the World: Market Share by Turntables Revenue in 2023
- Figure 10. Turntables Market Share by Company Type (Tier 1, Tier 2, and Tier 3): 2023
- Figure 11. Direct-drive Picture
- Figure 12. Belt-drive Picture
- Figure 13. Others Picture
- Figure 14. Global Turntables Sales Value by Type (2019 VS 2023 VS 2030) & (US$ Million)
- Figure 15. Global Turntables Sales Value Market Share by Type, 2019- 2030
- Figure 16. Global Turntables Sales Volume by Type (2019 VS 2023 VS 2030) & (K Units)
- Figure 17. Global Turntables Sales Volume Market Share by Type, 2019-2030
- Figure 18. Global Turntables Price by Type (2019-2030) & (US$/Unit)
- Figure 19. Product Picture of Commercial
- Figure 20. Product Picture of Household
- Figure 21. Global Turntables Sales Value by Application (2019 VS 2023 VS 2030) & (US$ Million)
- Figure 22. Global Turntables Sales Value Market Share by Application, 2023 & 2030
- Figure 23. Global Turntables Sales Volume by Application (2019 VS 2023 VS 2030) & (K Units)
- Figure 24. Global Turntables Sales Volume Market Share by Application, 2023 & 2030
- Figure 25. Global Turntables Price by Application (2019-2030) & (US$/Unit)
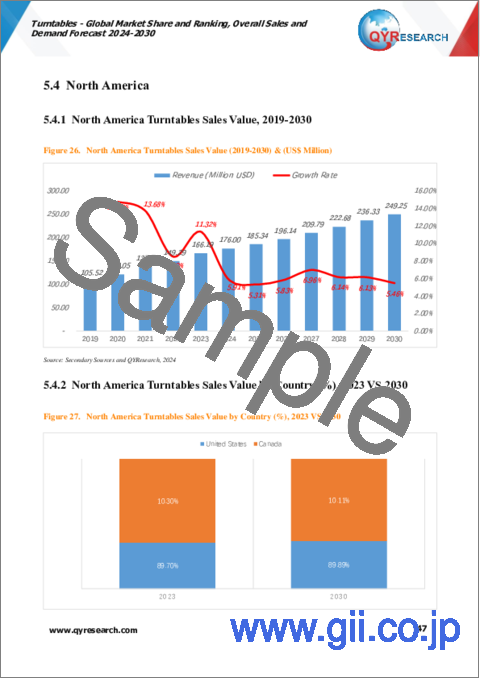
- Figure 26. North America Turntables Sales Value (2019-2030) & (US$ Million)
- Figure 27. North America Turntables Sales Value by Country (%), 2023 VS 2030
- Figure 28. Europe Turntables Sales Value, (2019-2030) & (US$ Million)
- Figure 29. Europe Turntables Sales Value by Country (%), 2023 VS 2030
- Figure 30. Asia Pacific Turntables Sales Value, (2019-2030) & (US$ Million)
- Figure 31. Asia Pacific Turntables Sales Value by Region (%), 2023 VS 2030
- Figure 32. South America Turntables Sales Value, (2019-2030) & (US$ Million)
- Figure 33. South America Turntables Sales Value by Country (%), 2023 VS 2030
- Figure 34. Middle East & Africa Turntables Sales Value, (2019-2030) & (US$ Million)
- Figure 35. Middle East & Africa Turntables Sales Value by Country (%), 2023 VS 2030
- Figure 36. United States Turntables Sales Value, (2019-2030) & (US$ Million)
- Figure 37. United States Turntables Sales Value by Type (%), 2023 VS 2030
- Figure 38. United States Turntables Sales Value by Application (%), 2023 VS 2030
- Figure 39. Europe Turntables Sales Value, (2019-2030) & (US$ Million)
- Figure 40. Europe Turntables Sales Value by Type (%), 2023 VS 2030
- Figure 41. Europe Turntables Sales Value by Application (%), 2023 VS 2030
- Figure 42. China Turntables Sales Value, (2019-2030) & (US$ Million)
- Figure 43. China Turntables Sales Value by Type (%), 2023 VS 2030
- Figure 44. China Turntables Sales Value by Application (%), 2023 VS 2030
- Figure 45. Japan Turntables Sales Value, (2019-2030) & (US$ Million)
- Figure 46. Japan Turntables Sales Value by Type (%), 2023 VS 2030
- Figure 47. Japan Turntables Sales Value by Application (%), 2023 VS 2030
- Figure 48. South Korea Turntables Sales Value, (2019-2030) & (US$ Million)
- Figure 49. South Korea Turntables Sales Value by Type (%), 2023 VS 2030
- Figure 50. South Korea Turntables Sales Value by Application (%), 2023 VS 2030
- Figure 51. Southeast Asia Turntables Sales Value, (2019-2030) & (US$ Million)
- Figure 52. Southeast Asia Turntables Sales Value by Type (%), 2023 VS 2030
- Figure 53. Southeast Asia Turntables Sales Value by Application (%), 2023 VS 2030
- Figure 54. India Turntables Sales Value, (2019-2030) & (US$ Million)
- Figure 55. India Turntables Sales Value by Type (%), 2023 VS 2030
- Figure 56. India Turntables Sales Value by Application (%), 2023 VS 2030
- Figure 57. Turntables Juke Box E Product Picture Examples of Pro-Ject
- Figure 58. Turntables Product Picture Examples of Victrola
- Figure 59. Turntables PLX-500 Product Picture Examples of Pioneer DJ
- Figure 60. Turntables SL-1200G Product Picture Examples of Panasonic
- Figure 61. Turntables SL-1200G Product Specification Examples of Panasonic
- Figure 62. Turntables C6 Product Picture Examples of Crosley
- Figure 63. Turntables PS-LX310BT Product Picture Examples of Sony
- Figure 64. Turntables PS-LX310BT Product Specification Examples of Sony
- Figure 65. Turntables TN-3B-SE Product Picture Examples of Teac
- Figure 66. Turntables AT-LP60XBT Product Picture Examples of Audio-Technica
- Figure 67. Turntables Planar 1 Product Picture Examples of Rega
- Figure 68. Turntables Planar 1 Product Specification Examples of Rega
- Figure 69. Turntables Sondek LP12 Product Picture Examples of LINN
- Figure 70. Turntables Ion Air LP(TM) Black Product Picture Examples of InMusic
- Figure 71. Turntables TT-15S1 Product Picture Examples of Marantz
- Figure 72. Turntables TT-15S1 Product Specification Examples of Marantz
- Figure 73. Turntables MT2 Product Picture Examples of Mclntosh
- Figure 74. Turntables Product Picture Examples of AMG (Analog Manufaktur Germany)
- Figure 75. Turntables TD 124 DD Product Picture Examples of Thorens
- Figure 76. Turntables Double X NEO Product Picture Examples of Acoustic Signature
- Figure 77. Turntables DP-300F Product Picture Examples of Denon
- Figure 78. Turntables Leonardo 40/60 TMD Product Picture Examples of Transrotor
- Figure 79. Turntables CONCEPT Product Picture Examples of Clearaudio
- Figure 80. Turntables MMF-5.3WH Product Picture Examples of Music Hall
- Figure 81. Turntables MMF-5.3WH Product Specification Examples of Music Hall
- Figure 82. Turntables Scout 21 Product Picture Examples of VPI Industries
- Figure 83. Turntables Industrial Chain
- Figure 84. Turntables Manufacturing Cost Structure
- Figure 85. Channels of Distribution
- Figure 86. Bottom-up and Top-down Approaches for This Report
- Figure 87. Data Triangulation
- Figure 88. Key Executives Interviewed
The global market for Turntables was estimated to be worth US$ 360.85 million in 2023 and is forecast to a readjusted size of US$ 530.65 million by 2030 with a CAGR of 5.59% during the forecast period 2024-2030.
North American market for Turntables was valued at $ 166.19 million in 2023 and will reach $ 249.25 million by 2030, at a CAGR of 5.97% during the forecast period of 2024 through 2030.
Asia-Pacific market for Turntables was valued at $ 29.39 million in 2023 and will reach $ 40.39 million by 2030, at a CAGR of 4.55% during the forecast period of 2024 through 2030.
Europe market for Turntables was valued at $ 148.52 million in 2023 and will reach $ 216.26 million by 2030, at a CAGR of 5.36% during the forecast period of 2024 through 2030.
The global key companies of Turntables include Pro-Ject, Victrola, Pioneer DJ, Panasonic, Crosley, Sony, Teac, Audio-Technica, and Rega, etc. In 2023, the global five largest players hold a share approximately 57.87% in terms of revenue.
This report aims to provide a comprehensive presentation of the global market for Turntables, focusing on the total sales volume, sales revenue, price, key companies market share and ranking, together with an analysis of Turntables by region & country, by Type, and by Application.
The Turntables market size, estimations, and forecasts are provided in terms of sales volume (K Units) and sales revenue ($ millions), considering 2023 as the base year, with history and forecast data for the period from 2019 to 2030. With both quantitative and qualitative analysis, to help readers develop business/growth strategies, assess the market competitive situation, analyze their position in the current marketplace, and make informed business decisions regarding Turntables.
Market Segmentation
By Company
- Pro-Ject
- Victrola
- Pioneer DJ
- Panasonic
- Crosley
- Sony
- Teac
- Audio-Technica
- Rega
- LINN
- inMusic
- Marantz
- Mclntosh
- AMG (Analog Manufaktur Germany)
- Thorens
- Acoustic Signature
- Denon
- Transrotor
- Clearaudio
- Music Hall
- VPI Industries
Segment by Type
- Direct-drive
- Belt-drive
- Others
Segment by Application
- Commercial
- Household
By Region
- North America
- United States
- Canada
- Asia-Pacific
- China
- Japan
- South Korea
- Southeast Asia
- India
- China Taiwan
- Rest of Asia-Pacific
- Europe
- Germany
- UK
- France
- Sweden
- Italy
- Rest of Europe
- Latin America
- Mexico
- Brazil
- Rest of Latin America
- Middle East & Africa
- Turkey
- Saudi Arabia
- UAE
- Rest of MEA
Chapter Outline
Chapter 1: Introduces the report scope of the report, global total market size (valve, volume and price). This chapter also provides the market dynamics, latest developments of the market, the driving factors and restrictive factors of the market, the challenges and risks faced by manufacturers in the industry, and the analysis of relevant policies in the industry.
Chapter 2: Detailed analysis of Turntables manufacturers competitive landscape, price, sales and revenue market share, latest development plan, merger, and acquisition information, etc.
Chapter 3: Provides the analysis of various market segments by Type, covering the market size and development potential of each market segment, to help readers find the blue ocean market in different market segments.
Chapter 4: Provides the analysis of various market segments by Application, covering the market size and development potential of each market segment, to help readers find the blue ocean market in different downstream markets.
Chapter 5: Sales, revenue of Turntables in regional level. It provides a quantitative analysis of the market size and development potential of each region and introduces the market development, future development prospects, market space, and market size of each country in the world.
Chapter 6: Sales, revenue of Turntables in country level. It provides sigmate data by Type, and by Application for each country/region.
Chapter 7: Provides profiles of key players, introducing the basic situation of the main companies in the market in detail, including product sales, revenue, price, gross margin, product introduction, recent development, etc.
Chapter 8: Analysis of industrial chain, including the upstream and downstream of the industry.
Chapter 9: Conclusion.
Table of Contents
1 Market Overview
- 1.1 Turntables Product Introduction
- 1.2 Global Turntables Market Size Forecast
- 1.2.1 Global Turntables Sales Value (2019-2030)
- 1.2.2 Global Turntables Sales Volume (2019-2030)
- 1.2.3 Global Turntables Sales Price (2019-2030)
- 1.3 Turntables Market Trends & Drivers
- 1.3.1 Turntables Industry Trends
- 1.3.2 Turntables Market Drivers & Opportunity
- 1.3.3 Turntables Market Challenges
- 1.3.4 Turntables Market Restraints
- 1.4 Assumptions and Limitations
- 1.5 Study Objectives
- 1.6 Years Considered
2 Competitive Analysis by Company
- 2.1 Global Turntables Players Revenue Ranking (2023)
- 2.2 Global Turntables Revenue by Company (2019-2024)
- 2.3 Global Turntables Players Sales Volume Ranking (2023)
- 2.4 Global Turntables Sales Volume by Company Players (2019-2024)
- 2.5 Global Turntables Average Price by Company (2019-2024)
- 2.6 Key Manufacturers Turntables Manufacturing Base and Area Served
- 2.7 Key Turntables Manufacturers Established Time
- 2.8 Turntables Market Competitive Analysis
- 2.8.1 Turntables Market Concentration Rate (2019-2024)
- 2.8.2 Global 5 and 10 Largest Manufacturers by Turntables Revenue in 2023
- 2.8.3 Global Top Manufacturers by Company Type (Tier 1, Tier 2, and Tier 3) & (based on the Revenue in Turntables as of 2023)
- 2.9 Mergers & Acquisitions, Expansion
3 Segmentation by Type
- 3.1 Introduction by Type
- 3.1.1 Direct-drive
- 3.1.2 Belt-drive
- 3.1.3 Others
- 3.2 Global Turntables Sales Value by Type
- 3.2.1 Global Turntables Sales Value by Type (2019 VS 2023 VS 2030)
- 3.2.2 Global Turntables Sales Value, by Type (2019-2030)
- 3.2.3 Global Turntables Sales Value, by Type (%) (2019-2030)
- 3.3 Global Turntables Sales Volume by Type
- 3.3.1 Global Turntables Sales Volume by Type (2019 VS 2023 VS 2030)
- 3.3.2 Global Turntables Sales Volume, by Type (2019-2030)
- 3.3.3 Global Turntables Sales Volume, by Type (%) (2019-2030)
- 3.4 Global Turntables Average Price by Type (2019-2030)
4 Segmentation by Application
- 4.1 Introduction by Application
- 4.1.1 Commercial
- 4.1.2 Household
- 4.2 Global Turntables Sales Value by Application
- 4.2.1 Global Turntables Sales Value by Application (2019 VS 2023 VS 2030)
- 4.2.2 Global Turntables Sales Value, by Application (2019-2030)
- 4.2.3 Global Turntables Sales Value, by Application (%) (2019-2030)
- 4.3 Global Turntables Sales Volume by Application
- 4.3.1 Global Turntables Sales Volume by Application (2019 VS 2023 VS 2030)
- 4.3.2 Global Turntables Sales Volume, by Application (2019-2030)
- 4.3.3 Global Turntables Sales Volume, by Application (%) (2019-2030)
- 4.4 Global Turntables Average Price by Application (2019-2030)
5 Segmentation by Region
- 5.1 Global Turntables Sales Value by Region
- 5.1.1 Global Turntables Sales Value by Region: 2019 VS 2023 VS 2030
- 5.1.2 Global Turntables Sales Value by Region (2019-2024)
- 5.1.3 Global Turntables Sales Value by Region (2025-2030)
- 5.1.4 Global Turntables Sales Value by Region (%), (2019-2030)
- 5.2 Global Turntables Sales Volume by Region
- 5.2.1 Global Turntables Sales Volume by Region: 2019 VS 2023 VS 2030
- 5.2.2 Global Turntables Sales Volume by Region (2019-2024)
- 5.2.3 Global Turntables Sales Volume by Region (2025-2030)
- 5.2.4 Global Turntables Sales Volume by Region (%), (2019-2030)
- 5.3 Global Turntables Average Price by Region (2019-2030)
- 5.4 North America
- 5.4.1 North America Turntables Sales Value, 2019-2030
- 5.4.2 North America Turntables Sales Value by Country (%), 2023 VS 2030
- 5.5 Europe
- 5.5.1 Europe Turntables Sales Value, 2019-2030
- 5.5.2 Europe Turntables Sales Value by Country (%), 2023 VS 2030
- 5.6 Asia Pacific
- 5.6.1 Asia Pacific Turntables Sales Value, 2019-2030
- 5.6.2 Asia Pacific Turntables Sales Value by Region (%), 2023 VS 2030
- 5.7 Latin America
- 5.7.1 Latin America Turntables Sales Value, 2019-2030
- 5.7.2 Latin America Turntables Sales Value by Country (%), 2023 VS 2030
- 5.8 Middle East & Africa
- 5.8.1 Middle East & Africa Turntables Sales Value, 2019-2030
- 5.8.2 Middle East & Africa Turntables Sales Value by Country (%), 2023 VS 2030
6 Segmentation by Key Countries/Regions
- 6.1 Key Countries/Regions Turntables Sales Value Growth Trends, 2019 VS 2023 VS 2030
- 6.2 Key Countries/Regions Turntables Sales Value
- 6.2.1 Key Countries/Regions Turntables Sales Value, 2019-2030
- 6.2.2 Key Countries/Regions Turntables Sales Volume, 2019-2030
- 6.3 United States
- 6.3.1 United States Turntables Sales Value, 2019-2030
- 6.3.2 United States Turntables Sales Value by Type (%), 2023 VS 2030
- 6.3.3 United States Turntables Sales Value by Application, 2023 VS 2030
- 6.4 Europe
- 6.4.1 Europe Turntables Sales Value, 2019-2030
- 6.4.2 Europe Turntables Sales Value by Type (%), 2023 VS 2030
- 6.4.3 Europe Turntables Sales Value by Application, 2023 VS 2030
- 6.5 China
- 6.5.1 China Turntables Sales Value, 2019-2030
- 6.5.2 China Turntables Sales Value by Type (%), 2023 VS 2030
- 6.5.3 China Turntables Sales Value by Application, 2023 VS 2030
- 6.6 Japan
- 6.6.1 Japan Turntables Sales Value, 2019-2030
- 6.6.2 Japan Turntables Sales Value by Type (%), 2023 VS 2030
- 6.6.3 Japan Turntables Sales Value by Application, 2023 VS 2030
- 6.7 South Korea
- 6.7.1 South Korea Turntables Sales Value, 2019-2030
- 6.7.2 South Korea Turntables Sales Value by Type (%), 2023 VS 2030
- 6.7.3 South Korea Turntables Sales Value by Application, 2023 VS 2030
- 6.8 Southeast Asia
- 6.8.1 Southeast Asia Turntables Sales Value, 2019-2030
- 6.8.2 Southeast Asia Turntables Sales Value by Type (%), 2023 VS 2030
- 6.8.3 Southeast Asia Turntables Sales Value by Application, 2023 VS 2030
- 6.9 India
- 6.9.1 India Turntables Sales Value, 2019-2030
- 6.9.2 India Turntables Sales Value by Type (%), 2023 VS 2030
- 6.9.3 India Turntables Sales Value by Application, 2023 VS 2030
7 Company Profiles
- 7.1 Pro-Ject
- 7.1.1 Company Basic Information, Manufacturing Base, Sales Area and Its Competitors
- 7.1.2 Turntables Product Overview
- 7.1.3 Pro-Ject Turntables Sales (K Units), Revenue (US$ Million), Price (US$/Unit) and Gross Margin (%) (2019-2024)
- 7.1.4 Main Business/Business Overview
- 7.2 Victrola
- 7.2.1 Company Basic Information, Manufacturing Base, Sales Area and Its Competitors
- 7.2.2 Turntables Product Overview
- 7.2.3 Victrola Turntables Sales (K Units), Revenue (US$ Million), Price (US$/Unit) and Gross Margin (%) (2019-2024)
- 7.2.4 Main Business/Business Overview
- 7.3 Pioneer DJ
- 7.3.1 Company Basic Information, Manufacturing Base, Sales Area and Its Competitors
- 7.3.2 Turntables Product Overview
- 7.3.3 Pioneer DJ Turntables Sales (K Units), Revenue (US$ Million), Price (US$/Unit) and Gross Margin (%) (2019-2024)
- 7.3.4 Main Business/Business Overview
- 7.4 Panasonic
- 7.4.1 Company Basic Information, Manufacturing Base, Sales Area and Its Competitors
- 7.4.2 Turntables Product Overview
- 7.4.3 Panasonic Turntables Sales (K Units), Revenue (US$ Million), Price (US$/Unit) and Gross Margin (%) (2019-2024)
- 7.4.4 Main Business/Business Overview
- 7.5 Crosley
- 7.5.1 Company Basic Information, Manufacturing Base, Sales Area and Its Competitors
- 7.5.2 Turntables Product Overview
- 7.5.3 Crosley Turntables Sales (K Units), Revenue (US$ Million), Price (US$/Unit) and Gross Margin (%) (2019-2024)
- 7.5.4 Main Business/Business Overview
- 7.6 Sony
- 7.6.1 Company Basic Information, Manufacturing Base, Sales Area and Its Competitors
- 7.6.2 Turntables Product Overview
- 7.6.3 Sony Turntables Sales (K Units), Revenue (US$ Million), Price (US$/Unit) and Gross Margin (%) (2019-2024)
- 7.6.4 Main Business/Business Overview
- 7.7 Teac
- 7.7.1 Company Basic Information, Manufacturing Base, Sales Area and Its Competitors
- 7.7.2 Turntables Product Overview
- 7.7.3 Teac Turntables Sales (K Units), Revenue (US$ Million), Price (US$/Unit) and Gross Margin (%) (2019-2024)
- 7.7.4 Main Business/Business Overview
- 7.8 Audio-Technica
- 7.8.1 Company Basic Information, Manufacturing Base, Sales Area and Its Competitors
- 7.8.2 Turntables Product Overview
- 7.8.3 Audio-Technica Turntables Sales (K Units), Revenue (US$ Million), Price (US$/Unit) and Gross Margin (%) (2019-2024)
- 7.8.4 Main Business/Business Overview
- 7.9 Rega
- 7.9.1 Company Basic Information, Manufacturing Base, Sales Area and Its Competitors
- 7.9.2 Turntables Product Overview
- 7.9.3 Rega Turntables Sales (K Units), Revenue (US$ Million), Price (US$/Unit) and Gross Margin (%) (2019-2024)
- 7.9.4 Main Business/Business Overview
- 7.10 LINN
- 7.10.1 Company Basic Information, Manufacturing Base, Sales Area and Its Competitors
- 7.10.2 Turntables Product Overview
- 7.10.3 LINN Turntables Sales (K Units), Revenue (US$ Million), Price (US$/Unit) and Gross Margin (%) (2019-2024)
- 7.10.4 Main Business/Business Overview
- 7.11 InMusic
- 7.11.1 Company Basic Information, Manufacturing Base, Sales Area and Its Competitors
- 7.11.2 Turntables Product Overview
- 7.11.3 InMusic Turntables Sales (K Units), Revenue (US$ Million), Price (US$/Unit) and Gross Margin (%) (2019-2024)
- 7.11.4 Main Business/Business Overview
- 7.12 Marantz
- 7.12.1 Company Basic Information, Manufacturing Base, Sales Area and Its Competitors
- 7.12.2 Turntables Product Overview
- 7.12.3 Marantz Turntables Sales (K Units), Revenue (US$ Million), Price (US$/Unit) and Gross Margin (%) (2019-2024)
- 7.12.4 Main Business/Business Overview
- 7.13 Mclntosh
- 7.13.1 Company Basic Information, Manufacturing Base, Sales Area and Its Competitors
- 7.13.2 Turntables Product Overview
- 7.13.3 Mclntosh Turntables Sales (K Units), Revenue (US$ Million), Price (US$/Unit) and Gross Margin (%) (2019-2024)
- 7.13.4 Main Business/Business Overview
- 7.14 AMG (Analog Manufaktur Germany)
- 7.14.1 Company Basic Information, Manufacturing Base, Sales Area and Its Competitors
- 7.14.2 Turntables Product Overview
- 7.14.3 AMG (Analog Manufaktur Germany) Turntables Sales (K Units), Revenue (US$ Million), Price (US$/Unit) and Gross Margin (%) (2019-2024)
- 7.14.4 Main Business/Business Overview
- 7.15 Thorens
- 7.15.1 Company Basic Information, Manufacturing Base, Sales Area and Its Competitors
- 7.15.2 Turntables Product Overview
- 7.15.3 Thorens Turntables Sales (K Units), Revenue (US$ Million), Price (US$/Unit) and Gross Margin (%) (2019-2024)
- 7.15.4 Main Business/Business Overview
- 7.16 Acoustic Signature
- 7.16.1 Company Basic Information, Manufacturing Base, Sales Area and Its Competitors
- 7.16.2 Turntables Product Overview
- 7.16.3 Acoustic Signature Turntables Sales (K Units), Revenue (US$ Million), Price (US$/Unit) and Gross Margin (%) (2019-2024)
- 7.16.4 Main Business/Business Overview
- 7.17 Denon
- 7.17.1 Company Basic Information, Manufacturing Base, Sales Area and Its Competitors
- 7.17.2 Turntables Product Overview
- 7.17.3 Denon Turntables Sales (K Units), Revenue (US$ Million), Price (US$/Unit) and Gross Margin (%) (2019-2024)
- 7.17.4 Main Business/Business Overview
- 7.18 Transrotor
- 7.18.1 Company Basic Information, Manufacturing Base, Sales Area and Its Competitors
- 7.18.2 Turntables Product Overview
- 7.18.3 Transrotor Turntables Sales (K Units), Revenue (US$ Million), Price (US$/Unit) and Gross Margin (%) (2019-2024)
- 7.18.4 Main Business/Business Overview
- 7.19 Clearaudio
- 7.19.1 Company Basic Information, Manufacturing Base, Sales Area and Its Competitors
- 7.19.2 Turntables Product Overview
- 7.19.3 Clearaudio Turntables Sales (K Units), Revenue (US$ Million), Price (US$/Unit) and Gross Margin (%) (2019-2024)
- 7.19.4 Main Business/Business Overview
- 7.20 Music Hall
- 7.20.1 Company Basic Information, Manufacturing Base, Sales Area and Its Competitors
- 7.20.2 Turntables Product Overview
- 7.20.3 Music Hall Turntables Sales (K Units), Revenue (US$ Million), Price (US$/Unit) and Gross Margin (%) (2019-2024)
- 7.20.4 Main Business/Business Overview
- 7.21 VPI Industries
- 7.21.1 Company Basic Information, Manufacturing Base, Sales Area and Its Competitors
- 7.21.2 Turntables Product Overview
- 7.21.3 VPI Industries Turntables Sales (K Units), Revenue (US$ Million), Price (US$/Unit) and Gross Margin (%) (2019-2024)
- 7.21.4 Main Business/Business Overview
8 Industry Chain Analysis
- 8.1 Turntables Industrial Chain
- 8.2 Turntables Upstream Analysis
- 8.2.1 Key Raw Materials
- 8.2.2 Raw Materials Key Suppliers
- 8.2.3 Manufacturing Cost Structure
- 8.3 Midstream Analysis
- 8.4 Downstream Analysis (Customers Analysis)
- 8.5 Sales Model and Sales Channels
- 8.5.1 Turntables Sales Model
- 8.5.2 Sales Channel
- 8.5.3 Turntables Distributors
9 Research Findings and Conclusion
10 Appendix
- 10.1 Research Methodology
- 10.1.1 Methodology/Research Approach
- 10.1.2 Data Source
- 10.2 Author Details
- 10.3 Disclaimer
