|
|
市場調査レポート
商品コード
1453594
空気エネルギー空調の世界市場:市場シェアおよびランキング・全体の売上および需要予測 (2024-2030年)Air Energy Eir Conditioning - Global Market Share and Ranking, Overall Sales and Demand Forecast 2024-2030 |
||||||
|
|||||||
カスタマイズ可能
適宜更新あり
|
|||||||

| 空気エネルギー空調の世界市場:市場シェアおよびランキング・全体の売上および需要予測 (2024-2030年) |
|
出版日: 2024年03月20日
発行: QYResearch
ページ情報: 英文 162 Pages
納期: 2~3営業日
|

全表示
- 概要
- 図表
- 目次
世界の空気エネルギー空調の市場規模は、2023年の32億7,376万米ドルから、予測期間中は8.50%のCAGRで推移し、2030年には57億216万米ドルの規模に成長すると予測されています。
北米市場は2023年の1億4,336万米ドルから、同期間中に7.05%のCAGRで推移し、2030年には2億2,540万米ドルに達すると予測されています。欧州市場は2023年の12億2,508万米ドルから、9.45%のCAGRで推移し、2030年には 22億4,038万米ドルの規模に成長すると予測されています。アジア太平洋市場は2023年の18億3,450万米ドルから、8.09%のCAGRで推移し、2030年には31億3,650万米ドルに達すると予測されています。
当レポートでは、世界の空気エネルギー空調の市場を調査し、市場および製品の概要、市場成長への各種影響因子の分析、市場規模の推移・予測、タイプ別・用途別、地域・主要国別の詳細分析、競合環境、市場シェア、ランキング、主要企業のプロファイルなどをまとめています。
目次
第1章 市場概要
- 空気エネルギー空調:製品概要
- 世界市場の規模・予測
- 市場動向・促進要因
- 産業動向
- 市場促進要因・機会
- 市場課題
- 市場抑制要因
- 前提と制限
- 調査目的
- 調査年数
第2章 競合分析:企業別
- 主要企業の収益ランキング
- 収益:企業別
- 主要企業の販売数ランキング
- 販売数:企業別
- 平均価格:企業別
- 主要製造業者:製造拠点・本社
- 主要製造業者:提供製品
- 主要製造業者:量産開始日
- 競合分析
- M&A・拡大
第3章 タイプ別セグメント
- タイプ別概要
- 統合型
- 分割型
- 販売額
- 販売額:2019 vs 2023 vs 2030
- 販売額の推移・予測
- 販売額の推移・予測 (%)
- 販売数
- 販売数:2019 vs 2023 vs 2030
- 販売数の推移・予測
- 販売数の推移・予測 (%)
- 平均価格の推移・予測
第4章 用途別セグメント
- 用途別概要
- 家庭用
- 商用
- その他
- 販売額
- 販売額:2019 vs 2023 vs 2030
- 販売額の推移・予測
- 販売額の推移・予測 (%)
- 販売数
- 販売数:2019 vs 2023 vs 2030
- 販売数の推移・予測
- 販売数の推移・予測 (%)
- 平均価格の推移・予測
第5章 地域別セグメント
- 販売額
- 販売額:2019 vs 2023 vs 2030
- 販売額の推移・予測
- 販売額の推移・予測 (%)
- 販売数
- 販売数:2019 vs 2023 vs 2030
- 販売数の推移・予測
- 販売数の推移・予測 (%)
- 平均価格の推移・予測
- 北米
- 欧州
- アジア太平洋
第6章 主要国/地域別セグメント
- 主要国/地域別の成長動向:2019 vs 2023 vs 2030
- 主要国・地域別の販売額
- 米国
- 欧州
- 中国
- 日本
- 韓国
- インド
- 東南アジア
第7章 企業プロファイル
- Haier
- PHNIX
- OUTES
- Tongyi
- Midea
- JOHNSON CONTROLS
- Nuentai New Energy Technology
- AMA
- NIBE
- BOSCH
- Hisense
- Power World
- TCL
- Gree Electric
- DAIKIN
第8章 産業チェーン分析
- 産業チェーン
- 上流分析
- 中流分析
- 下流分析(顧客分析)
- 販売モデルと販売チャネル
第9章 調査結果・総論
第10章 付録
List of Tables
- Table 1. Air Energy Air Conditioning Market Trends
- Table 2. Air Energy Air Conditioning Market Drivers & Opportunity
- Table 3. Air Energy Air Conditioning Market Challenges
- Table 4. Air Energy Air Conditioning Market Restraints
- Table 5. Global Air Energy Air Conditioning Revenue by Company (2019-2024) & (US$ Million)
- Table 6. Global Air Energy Air Conditioning Revenue Market Share by Company (2019-2024)
- Table 7. Global Air Energy Air Conditioning Sales Volume by Company (2019-2024) & (K Units)
- Table 8. Global Air Energy Air Conditioning Sales Volume Market Share by Company (2019-2024)
- Table 9. Global Market Air Energy Air Conditioning Price by Company (2019-2024) & (US$/Unit)
- Table 10. Key Manufacturers Air Energy Air Conditioning Manufacturing Base and Headquarters
- Table 11. Key Manufacturers Air Energy Air Conditioning Product Type
- Table 12. Key Manufacturers Time to Begin Mass Production of Air Energy Air Conditioning
- Table 13. Global Air Energy Air Conditioning Manufacturers Market Concentration Ratio (CR5 and HHI)
- Table 14. Global Top Manufacturers Market Share by Company Type (Tier 1, Tier 2, and Tier 3) & (based on the Revenue in Air Energy Air Conditioning as of 2023)
- Table 15. Mergers & Acquisitions, Expansion Plans
- Table 16. Global Air Energy Air Conditioning Sales Value by Type: 2019 VS 2023 VS 2030 (US$ Million)
- Table 17. Global Air Energy Air Conditioning Sales Value by Type (2019-2024) & (US$ Million)
- Table 18. Global Air Energy Air Conditioning Sales Value by Type (2025-2030) & (US$ Million)
- Table 19. Global Air Energy Air Conditioning Sales Market Share in Value by Type (2019-2024)
- Table 20. Global Air Energy Air Conditioning Sales Market Share in Value by Type (2025-2030)
- Table 21. Global Air Energy Air Conditioning Sales Volume by Type: 2019 VS 2023 VS 2030 (K Units)
- Table 22. Global Air Energy Air Conditioning Sales Volume by Type (2019-2024) & (K Units)
- Table 23. Global Air Energy Air Conditioning Sales Volume by Type (2025-2030) & (K Units)
- Table 24. Global Air Energy Air Conditioning Sales Market Share in Volume by Type (2019-2024)
- Table 25. Global Air Energy Air Conditioning Sales Market Share in Value by Type (2025-2030)
- Table 26. Global Air Energy Air Conditioning Price by Type (2019-2024) & (US$/Unit)
- Table 27. Global Air Energy Air Conditioning Price by Type (2025-2030) & (US$/Unit)
- Table 28. Global Air Energy Air Conditioning Sales Value by Application: 2019 VS 2023 VS 2030 (US$ Million)
- Table 29. Global Air Energy Air Conditioning Sales Value by Application (2019-2024) & (US$ Million)
- Table 30. Global Air Energy Air Conditioning Sales Value by Application (2025-2030) & (US$ Million)
- Table 31. Global Air Energy Air Conditioning Sales Market Share in Value by Application (2019-2024)
- Table 32. Global Air Energy Air Conditioning Sales Market Share in Value by Application (2025-2030)
- Table 33. Global Air Energy Air Conditioning Sales Volume by Application: 2019 VS 2023 VS 2030 (K Units)
- Table 34. Global Air Energy Air Conditioning Sales Volume by Application (2019-2024) & (K Units)
- Table 35. Global Air Energy Air Conditioning Sales Volume by Application (2025-2030) & (K Units)
- Table 36. Global Air Energy Air Conditioning Sales Market Share in Volume by Application (2019-2024)
- Table 37. Global Air Energy Air Conditioning Sales Market Share in Value by Application (2025-2030)
- Table 38. Global Air Energy Air Conditioning Price by Application (2019-2024) & (US$/Unit)
- Table 39. Global Air Energy Air Conditioning Price by Application (2025-2030) & (US$/Unit)
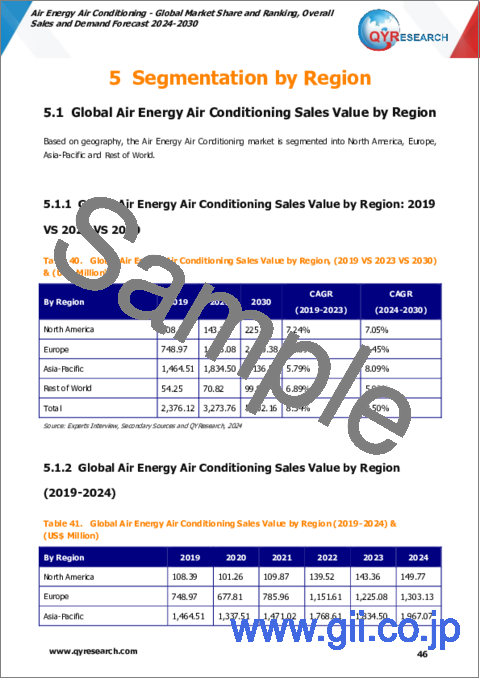
- Table 40. Global Air Energy Air Conditioning Sales Value by Region, (2019 VS 2023 VS 2030) & (US$ Million)
- Table 41. Global Air Energy Air Conditioning Sales Value by Region (2019-2024) & (US$ Million)
- Table 42. Global Air Energy Air Conditioning Sales Value by Region (2025-2030) & (US$ Million)
- Table 43. Global Air Energy Air Conditioning Sales Value by Region (2019-2024) & (%)
- Table 44. Global Air Energy Air Conditioning Sales Value by Region (2025-2030) & (%)
- Table 45. Global Air Energy Air Conditioning Sales Volume by Region (K Units): 2019 VS 2023 VS 2030
- Table 46. Global Air Energy Air Conditioning Sales Volume by Region (2019-2024) & (K Units)
- Table 47. Global Air Energy Air Conditioning Sales Volume by Region (2025-2030) & (K Units)
- Table 48. Global Air Energy Air Conditioning Sales Volume by Region (2019-2024) & (%)
- Table 49. Global Air Energy Air Conditioning Sales Volume by Region (2025-2030) & (%)
- Table 50. Global Air Energy Air Conditioning Average Price by Region (2019-2024) & (US$/Unit)
- Table 51. Global Air Energy Air Conditioning Average Price by Region (2025-2030) & (US$/Unit)
- Table 52. Key Countries/Regions Air Energy Air Conditioning Sales Value GRest of Worldth Trends, (US$ Million): 2019 VS 2023 VS 2030
- Table 53. Key Countries/Regions Air Energy Air Conditioning Sales Value, (2019-2024) & (US$ Million)
- Table 54. Key Countries/Regions Air Energy Air Conditioning Sales Value, (2025-2030) & (US$ Million)
- Table 55. Key Countries/Regions Air Energy Air Conditioning Sales Volume, (2019-2024) & (K Units)
- Table 56. Key Countries/Regions Air Energy Air Conditioning Sales Volume, (2025-2030) & (K Units)
- Table 57. Haier Company Information
- Table 58. Haier Introduction and Business Overview
- Table 59. Haier Air Energy Air Conditioning Sales (K Units), Revenue (US$ Million), Price (US$/Unit) and Gross Margin (2019-2024)
- Table 60. Haier Air Energy Air Conditioning Product Offerings
- Table 61. PHNIX Company Information
- Table 62. PHNIX Introduction and Business Overview
- Table 63. PHNIX Air Energy Air Conditioning Sales (K Units), Revenue (US$ Million), Price (US$/Unit) and Gross Margin (2019-2024)
- Table 64. PHNIX Air Energy Air Conditioning Product Offerings
- Table 65. PHNIX Recent Development
- Table 66. OUTES Company Information
- Table 67. OUTES Introduction and Business Overview
- Table 68. OUTES Air Energy Air Conditioning Sales (K Units), Revenue (US$ Million), Price (US$/Unit) and Gross Margin (2019-2024)
- Table 69. OUTES Air Energy Air Conditioning Product Offerings
- Table 70. Tongyi Company Information
- Table 71. Tongyi Introduction and Business Overview
- Table 72. Tongyi Air Energy Air Conditioning Sales (K Units), Revenue (US$ Million), Price (US$/Unit) and Gross Margin (2019-2024)
- Table 73. Tongyi Air Energy Air Conditioning Product Offerings
- Table 74. Midea Company Information
- Table 75. Midea Introduction and Business Overview
- Table 76. Midea Air Energy Air Conditioning Sales (K Units), Revenue (US$ Million), Price (US$/Unit) and Gross Margin (2019-2024)
- Table 77. Midea Air Energy Air Conditioning Product Offerings
- Table 78. JOHNSON CONTROLS Company Information
- Table 79. JOHNSON CONTROLS Introduction and Business Overview
- Table 80. JOHNSON CONTROLS Air Energy Air Conditioning Sales (K Units), Revenue (US$ Million), Price (US$/Unit) and Gross Margin (2019-2024)
- Table 81. JOHNSON CONTROLS Air Energy Air Conditioning Product Offerings
- Table 82. Nuentai New Energy Technology Company Information
- Table 83. Nuentai New Energy Technology Introduction and Business Overview
- Table 84. Nuentai New Energy Technology Air Energy Air Conditioning Sales (K Units), Revenue (US$ Million), Price (US$/Unit) and Gross Margin (2019-2024)
- Table 85. Nuentai New Energy Technology Air Energy Air Conditioning Product Offerings
- Table 86. Nuentai New Energy Technology Recent Development
- Table 87. AMA Company Information
- Table 88. AMA Introduction and Business Overview
- Table 89. AMA Air Energy Air Conditioning Sales (K Units), Revenue (US$ Million), Price (US$/Unit) and Gross Margin (2019-2024)
- Table 90. AMA Air Energy Air Conditioning Product Offerings
- Table 91. NIBE Company Information
- Table 92. NIBE Introduction and Business Overview
- Table 93. NIBE Air Energy Air Conditioning Sales (K Units), Revenue (US$ Million), Price (US$/Unit) and Gross Margin (2019-2024)
- Table 94. NIBE Air Energy Air Conditioning Product Offerings
- Table 95. NIBE Recent Development
- Table 96. BOSCH Company Information
- Table 97. BOSCH Introduction and Business Overview
- Table 98. BOSCH Air Energy Air Conditioning Sales (K Units), Revenue (US$ Million), Price (US$/Unit) and Gross Margin (2019-2024)
- Table 99. BOSCH Air Energy Air Conditioning Product Offerings
- Table 100. Hisense Company Information
- Table 101. Hisense Introduction and Business Overview
- Table 102. Hisense Air Energy Air Conditioning Sales (K Units), Revenue (US$ Million), Price (US$/Unit) and Gross Margin (2019-2024)
- Table 103. Hisense Air Energy Air Conditioning Product Offerings
- Table 104. Hisense Recent Development
- Table 105. Power World Company Information
- Table 106. Power World Introduction and Business Overview
- Table 107. Power World Air Energy Air Conditioning Sales (K Units), Revenue (US$ Million), Price (US$/Unit) and Gross Margin (2019-2024)
- Table 108. Power World Air Energy Air Conditioning Product Offerings
- Table 109. TCL Company Information
- Table 110. TCL Introduction and Business Overview
- Table 111. TCL Air Energy Air Conditioning Sales (K Units), Revenue (US$ Million), Price (US$/Unit) and Gross Margin (2019-2024)
- Table 112. TCL Air Energy Air Conditioning Product Offerings
- Table 113. Gree Electric Company Information
- Table 114. Gree Electric Introduction and Business Overview
- Table 115. Gree Electric Air Energy Air Conditioning Sales (K Units), Revenue (US$ Million), Price (US$/Unit) and Gross Margin (2019-2024)
- Table 116. Gree Electric Air Energy Air Conditioning Product Offerings
- Table 117. Gree Electric Recent Development
- Table 118. DAIKIN Company Information
- Table 119. DAIKIN Introduction and Business Overview
- Table 120. DAIKIN Air Energy Air Conditioning Sales (K Units), Revenue (US$ Million), Price (US$/Unit) and Gross Margin (2019-2024)
- Table 121. DAIKIN Air Energy Air Conditioning Product Offerings
- Table 122. DAIKIN Recent Development
- Table 123. Key Raw Materials Lists
- Table 124. Raw Materials Key Suppliers Lists
- Table 125. Air Energy Air Conditioning Downstream Customers
- Table 126. Air Energy Air Conditioning Distributors List
- Table 127. Research Programs/Design for This Report
- Table 128. Key Data Information from Secondary Sources
- Table 129. Key Data Information from Primary Sources
List of Figures
- Figure 1. Air Energy Air Conditioning Product Picture
- Figure 2. Global Air Energy Air Conditioning Sales Value, 2019 VS 2023 VS 2030 (US$ Million)
- Figure 3. Global Air Energy Air Conditioning Sales Value (2019-2030) & (US$ Million)
- Figure 4. Global Air Energy Air Conditioning Sales Volume (2019-2030) & (K Units)
- Figure 5. Global Air Energy Air Conditioning Sales Price (2019-2030) & (US$/Unit)
- Figure 6. Air Energy Air Conditioning Report Years Considered
- Figure 7. Global Air Energy Air Conditioning Players Revenue Ranking (2023) & (US$ Million)
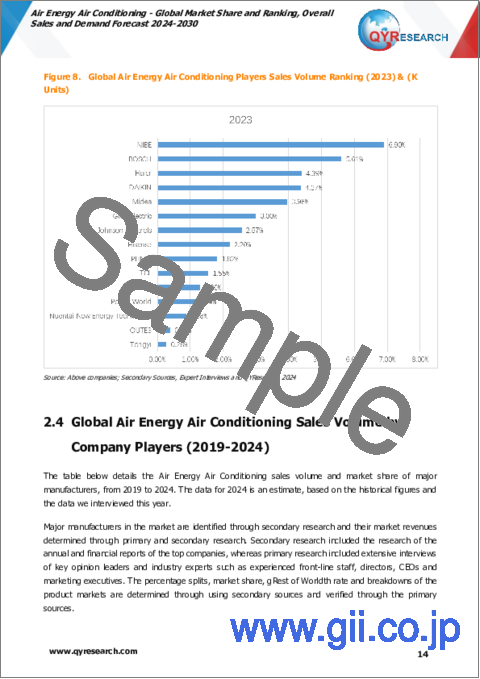
- Figure 8. Global Air Energy Air Conditioning Players Sales Volume Ranking (2023) & (K Units)
- Figure 9. The 3 and 5 Largest Manufacturers in the World: Market Share by Air Energy Air Conditioning Revenue in 2023
- Figure 10. Air Energy Air Conditioning Market Share by Company Type (Tier 1, Tier 2, and Tier 3): 2019 VS 2023
- Figure 11. Integrated Picture
- Figure 12. Split Type Picture
- Figure 13. Global Air Energy Air Conditioning Sales Value by Type (2019 VS 2023 VS 2030) & (US$ Million)
- Figure 14. Global Air Energy Air Conditioning Sales Value Market Share by Type, 2023 & 2030
- Figure 15. Global Air Energy Air Conditioning Sales Volume by Type (2019 VS 2023 VS 2030) & (K Units)
- Figure 16. Global Air Energy Air Conditioning Sales Volume Market Share by Type, 2023 & 2030
- Figure 17. Global Air Energy Air Conditioning Price by Type (2019-2030) & (US$/Unit)
- Figure 18. Product Picture of Residence
- Figure 19. Product Picture of Commercial
- Figure 20. Product Picture of Other
- Figure 21. Global Air Energy Air Conditioning Sales Value by Application (2019 VS 2023 VS 2030) & (US$ Million)
- Figure 22. Global Air Energy Air Conditioning Sales Value Market Share by Application, 2023 & 2030
- Figure 23. Global Air Energy Air Conditioning Sales Volume by Application (2019 VS 2023 VS 2030) & (K Units)
- Figure 24. Global Air Energy Air Conditioning Sales Volume Market Share by Application, 2023 & 2030
- Figure 25. Global Air Energy Air Conditioning Price by Application (2019-2030) & (US$/Unit)
- Figure 26. North America Air Energy Air Conditioning Sales Value (2019-2030) & (US$ Million)
- Figure 27. North America Air Energy Air Conditioning Sales Value by Country (%), 2023 VS 2030
- Figure 28. Europe Air Energy Air Conditioning Sales Value, (2019-2030) & (US$ Million)
- Figure 29. Europe Air Energy Air Conditioning Sales Value by Country (%), 2023 VS 2030
- Figure 30. Asia Pacific Air Energy Air Conditioning Sales Value, (2019-2030) & (US$ Million)
- Figure 31. Asia Pacific Air Energy Air Conditioning Sales Value by Region (%), 2023 VS 2030
- Figure 32. Key Countries/Regions Air Energy Air Conditioning Sales Value (%), (2019-2030)
- Figure 33. Key Countries/Regions Air Energy Air Conditioning Sales Volume (%), (2019-2030)
- Figure 34. United States Air Energy Air Conditioning Sales Value, (2019-2030) & (US$ Million)
- Figure 35. United States Air Energy Air Conditioning Sales Value by Type (%), 2023 VS 2030
- Figure 36. United States Air Energy Air Conditioning Sales Value by Application (%), 2023 VS 2030
- Figure 37. Europe Air Energy Air Conditioning Sales Value, (2019-2030) & (US$ Million)
- Figure 38. Europe Air Energy Air Conditioning Sales Value by Type (%), 2023 VS 2030
- Figure 39. Europe Air Energy Air Conditioning Sales Value by Application (%), 2023 VS 2030
- Figure 40. China Air Energy Air Conditioning Sales Value, (2019-2030) & (US$ Million)
- Figure 41. China Air Energy Air Conditioning Sales Value by Type (%), 2023 VS 2030
- Figure 42. China Air Energy Air Conditioning Sales Value by Application (%), 2023 VS 2030
- Figure 43. Japan Air Energy Air Conditioning Sales Value, (2019-2030) & (US$ Million)
- Figure 44. Japan Air Energy Air Conditioning Sales Value by Type (%), 2023 VS 2030
- Figure 45. Japan Air Energy Air Conditioning Sales Value by Application (%), 2023 VS 2030
- Figure 46. South Korea Air Energy Air Conditioning Sales Value, (2019-2030) & (US$ Million)
- Figure 47. South Korea Air Energy Air Conditioning Sales Value by Type (%), 2023 VS 2030
- Figure 48. South Korea Air Energy Air Conditioning Sales Value by Application (%), 2023 VS 2030
- Figure 49. India Air Energy Air Conditioning Sales Value, (2019-2030) & (US$ Million)
- Figure 50. India Air Energy Air Conditioning Sales Value by Type (%), 2023 VS 2030
- Figure 51. India Air Energy Air Conditioning Sales Value by Application (%), 2023 VS 2030
- Figure 52. Southeast Asia Air Energy Air Conditioning Sales Value, (2019-2030) & (US$ Million)
- Figure 53. Southeast Asia Air Energy Air Conditioning Sales Value by Type (%), 2023 VS 2030
- Figure 54. Southeast Asia Air Energy Air Conditioning Sales Value by Application (%), 2023 VS 2030
- Figure 55. Air Energy Air Conditioning Industrial Chain
- Figure 56. Air Energy Air Conditioning Manufacturing Cost Structure
- Figure 57. Channels of Distribution (Direct Sales, and Distribution)
- Figure 58. Bottom-up and Top-down Approaches for This Report
- Figure 59. Data Triangulation
- Figure 60. Key Executives Interviewed
The global market for Air Energy Air Conditioning was estimated to be worth US$ 3,273.76 million in 2023 and is forecast to a readjusted size of US$ 5,702.16 million by 2030 with a CAGR of 8.50% during the forecast period 2024-2030.
North American market for Air Energy Air Conditioning was valued at $ 143.36 million in 2023 and will reach $ 225.40 million by 2030, at a CAGR of 7.05% during the forecast period of 2024 through 2030.
Europe market for Air Energy Air Conditioning was valued at $ 1225.08 million in 2023 and will reach $ 2240.38 million by 2030, at a CAGR of 9.45% during the forecast period of 2024 through 2030.
Asia-Pacific market for Air Energy Air Conditioning was valued at $ 1834.50 million in 2023 and will reach $ 3136.50 million by 2030, at a CAGR of 8.09% during the forecast period of 2024 through 2030.
The global key companies of Air Energy Air Conditioning include Haier, PHNIX, OUTES, Tongyi, Midea, JOHNSON CONTROLS, Nuentai New Energy Technology, AMA, and NIBE, etc. In 2023, the global five largest players hold a share approximately 30.60% in terms of revenue.
This report aims to provide a comprehensive presentation of the global market for Air Energy Air Conditioning, focusing on the total sales volume, sales revenue, price, key companies market share and ranking, together with an analysis of Air Energy Air Conditioning by region & country, by Type, and by Application.
The Air Energy Air Conditioning market size, estimations, and forecasts are provided in terms of sales volume (K Units) and sales revenue ($ millions), considering 2023 as the base year, with history and forecast data for the period from 2019 to 2030. With both quantitative and qualitative analysis, to help readers develop business/gRest of Worldth strategies, assess the market competitive situation, analyze their position in the current marketplace, and make informed business decisions regarding Air Energy Air Conditioning.
Market Segmentation
By Company
- Haier
- PHNIX
- OUTES
- Tongyi
- Midea
- JOHNSON CONTROLS
- Nuentai New Energy Technology
- AMA
- NIBE
- BOSCH
- Hisense
- Power World
- TCL
- Gree Electric
- DAIKIN
Segment by Type
- Integrated
- Split Type
Segment by Application
- Residence
- Commercial
- Other
By Region
- North America
- United States
- Canada
- Mexico
- Asia-Pacific
- China
- Japan
- South Korea
- Southeast Asia
- India
- Rest of Asia-Pacific
- Europe
- Germany
- France
- U.K.
- Italy
- Rest of Europe
- Rest of World
Chapter Outline
Chapter 1: Introduces the report scope of the report, global total market size (valve, volume and price). This chapter also provides the market dynamics, latest developments of the market, the driving factors and restrictive factors of the market, the challenges and risks faced by manufacturers in the industry, and the analysis of relevant policies in the industry.
Chapter 2: Detailed analysis of Air Energy Air Conditioning manufacturers competitive landscape, price, sales and revenue market share, latest development plan, merger, and acquisition information, etc.
Chapter 3: Provides the analysis of various market segments by Type, covering the market size and development potential of each market segment, to help readers find the blue ocean market in different market segments.
Chapter 4: Provides the analysis of various market segments by Application, covering the market size and development potential of each market segment, to help readers find the blue ocean market in different downstream markets.
Chapter 5: Sales, revenue of Air Energy Air Conditioning in regional level. It provides a quantitative analysis of the market size and development potential of each region and introduces the market development, future development prospects, market space, and market size of each country in the world.
Chapter 6: Sales, revenue of Air Energy Air Conditioning in country level. It provides sigmate data by Type, and by Application for each country/region.
Chapter 7: Provides profiles of key players, introducing the basic situation of the main companies in the market in detail, including product sales, revenue, price, gross margin, product introduction, recent development, etc.
Chapter 8: Analysis of industrial chain, including the upstream and downstream of the industry.
Chapter 9: Conclusion.
Table of Contents
1 Market Overview
- 1.1 Air Energy Air Conditioning Product Introduction
- 1.2 Global Air Energy Air Conditioning Market Size Forecast
- 1.2.1 Global Air Energy Air Conditioning Sales Value (2019-2030)
- 1.2.2 Global Air Energy Air Conditioning Sales Volume (2019-2030)
- 1.2.3 Global Air Energy Air Conditioning Sales Price (2019-2030)
- 1.3 Air Energy Air Conditioning Market Trends & Drivers
- 1.3.1 Air Energy Air Conditioning Industry Trends
- 1.3.2 Air Energy Air Conditioning Market Drivers & Opportunity
- 1.3.3 Air Energy Air Conditioning Market Challenges
- 1.3.4 Air Energy Air Conditioning Market Restraints
- 1.4 Assumptions and Limitations
- 1.5 Study Objectives
- 1.6 Years Considered
2 Competitive Analysis by Company
- 2.1 Global Air Energy Air Conditioning Players Revenue Ranking (2023)
- 2.2 Global Air Energy Air Conditioning Revenue by Company (2019-2024)
- 2.3 Global Air Energy Air Conditioning Players Sales Volume Ranking (2023)
- 2.4 Global Air Energy Air Conditioning Sales Volume by Company Players (2019-2024)
- 2.5 Global Air Energy Air Conditioning Average Price by Company (2019-2024)
- 2.6 Key Manufacturers Air Energy Air Conditioning Manufacturing Base and Headquarters
- 2.7 Key Manufacturers Air Energy Air Conditioning Product Offered
- 2.8 Key Manufacturers Time to Begin Mass Production of Air Energy Air Conditioning
- 2.9 Air Energy Air Conditioning Market Competitive Analysis
- 2.9.1 Air Energy Air Conditioning Market Concentration Rate (2019-2024)
- 2.9.2 Global 3 and 5 Largest Manufacturers by Air Energy Air Conditioning Revenue in 2023
- 2.9.3 Global Top Manufacturers by Company Type (Tier 1, Tier 2, and Tier 3) & (based on the Revenue in Air Energy Air Conditioning as of 2023)
- 2.10 Mergers & Acquisitions, Expansion
3 Segmentation by Type
- 3.1 Introduction by Type
- 3.1.1 Integrated
- 3.1.2 Split Type
- 3.2 Global Air Energy Air Conditioning Sales Value by Type
- 3.2.1 Global Air Energy Air Conditioning Sales Value by Type (2019 VS 2023 VS 2030)
- 3.2.2 Global Air Energy Air Conditioning Sales Value, by Type (2019-2030)
- 3.2.3 Global Air Energy Air Conditioning Sales Value, by Type (%) (2019-2030)
- 3.3 Global Air Energy Air Conditioning Sales Volume by Type
- 3.3.1 Global Air Energy Air Conditioning Sales Volume by Type (2019 VS 2023 VS 2030)
- 3.3.2 Global Air Energy Air Conditioning Sales Volume, by Type (2019-2030)
- 3.3.3 Global Air Energy Air Conditioning Sales Volume, by Type (%) (2019-2030)
- 3.4 Global Air Energy Air Conditioning Average Price by Type (2019-2030)
4 Segmentation by Application
- 4.1 Introduction by Application
- 4.1.1 Residence
- 4.1.2 Commercial
- 4.1.3 Other
- 4.2 Global Air Energy Air Conditioning Sales Value by Application
- 4.2.1 Global Air Energy Air Conditioning Sales Value by Application (2019 VS 2023 VS 2030)
- 4.2.2 Global Air Energy Air Conditioning Sales Value, by Application (2019-2030)
- 4.2.3 Global Air Energy Air Conditioning Sales Value, by Application (%) (2019-2030)
- 4.3 Global Air Energy Air Conditioning Sales Volume by Application
- 4.3.1 Global Air Energy Air Conditioning Sales Volume by Application (2019 VS 2023 VS 2030)
- 4.3.2 Global Air Energy Air Conditioning Sales Volume, by Application (2019-2030)
- 4.3.3 Global Air Energy Air Conditioning Sales Volume, by Application (%) (2019-2030)
- 4.4 Global Air Energy Air Conditioning Average Price by Application (2019-2030)
5 Segmentation by Region
- 5.1 Global Air Energy Air Conditioning Sales Value by Region
- 5.1.1 Global Air Energy Air Conditioning Sales Value by Region: 2019 VS 2023 VS 2030
- 5.1.2 Global Air Energy Air Conditioning Sales Value by Region (2019-2024)
- 5.1.3 Global Air Energy Air Conditioning Sales Value by Region (2025-2030)
- 5.1.4 Global Air Energy Air Conditioning Sales Value by Region (%), (2019-2030)
- 5.2 Global Air Energy Air Conditioning Sales Volume by Region
- 5.2.1 Global Air Energy Air Conditioning Sales Volume by Region: 2019 VS 2023 VS 2030
- 5.2.2 Global Air Energy Air Conditioning Sales Volume by Region (2019-2024)
- 5.2.3 Global Air Energy Air Conditioning Sales Volume by Region (2025-2030)
- 5.2.4 Global Air Energy Air Conditioning Sales Volume by Region (%), (2019-2030)
- 5.3 Global Air Energy Air Conditioning Average Price by Region (2019-2030)
- 5.4 North America
- 5.4.1 North America Air Energy Air Conditioning Sales Value, 2019-2030
- 5.4.2 North America Air Energy Air Conditioning Sales Value by Country (%), 2023 VS 2030
- 5.5 Europe
- 5.5.1 Europe Air Energy Air Conditioning Sales Value, 2019-2030
- 5.5.2 Europe Air Energy Air Conditioning Sales Value by Country (%), 2023 VS 2030
- 5.6 Asia Pacific
- 5.6.1 Asia Pacific Air Energy Air Conditioning Sales Value, 2019-2030
- 5.6.2 Asia Pacific Air Energy Air Conditioning Sales Value by Region (%), 2023 VS 2030
6 Segmentation by Key Countries/Regions
- 6.1 Key Countries/Regions Air Energy Air Conditioning Sales Value GRest of Worldth Trends, 2019 VS 2023 VS 2030
- 6.2 Key Countries/Regions Air Energy Air Conditioning Sales Value
- 6.2.1 Key Countries/Regions Air Energy Air Conditioning Sales Value, 2019-2030
- 6.2.2 Key Countries/Regions Air Energy Air Conditioning Sales Volume, 2019-2030
- 6.3 United States
- 6.3.1 United States Air Energy Air Conditioning Sales Value, 2019-2030
- 6.3.2 United States Air Energy Air Conditioning Sales Value by Type (%), 2023 VS 2030
- 6.3.3 United States Air Energy Air Conditioning Sales Value by Application, 2023 VS 2030
- 6.4 Europe
- 6.4.1 Europe Air Energy Air Conditioning Sales Value, 2019-2030
- 6.4.2 Europe Air Energy Air Conditioning Sales Value by Type (%), 2023 VS 2030
- 6.4.3 Europe Air Energy Air Conditioning Sales Value by Application, 2023 VS 2030
- 6.5 China
- 6.5.1 China Air Energy Air Conditioning Sales Value, 2019-2030
- 6.5.2 China Air Energy Air Conditioning Sales Value by Type (%), 2023 VS 2030
- 6.5.3 China Air Energy Air Conditioning Sales Value by Application, 2023 VS 2030
- 6.6 Japan
- 6.6.1 Japan Air Energy Air Conditioning Sales Value, 2019-2030
- 6.6.2 Japan Air Energy Air Conditioning Sales Value by Type (%), 2023 VS 2030
- 6.6.3 Japan Air Energy Air Conditioning Sales Value by Application, 2023 VS 2030
- 6.7 South Korea
- 6.7.1 South Korea Air Energy Air Conditioning Sales Value, 2019-2030
- 6.7.2 South Korea Air Energy Air Conditioning Sales Value by Type (%), 2023 VS 2030
- 6.7.3 South Korea Air Energy Air Conditioning Sales Value by Application, 2023 VS 2030
- 6.8 India
- 6.8.1 India Air Energy Air Conditioning Sales Value, 2019-2030
- 6.8.2 India Air Energy Air Conditioning Sales Value by Type (%), 2023 VS 2030
- 6.8.3 India Air Energy Air Conditioning Sales Value by Application, 2023 VS 2030
- 6.9 Southeast Asia
- 6.9.1 Southeast Asia Air Energy Air Conditioning Sales Value, 2019-2030
- 6.9.2 Southeast Asia Air Energy Air Conditioning Sales Value by Type (%), 2023 VS 2030
- 6.9.3 Southeast Asia Air Energy Air Conditioning Sales Value by Application, 2023 VS 2030
7 Company Profiles
- 7.1 Haier
- 7.1.1 Haier Company Information
- 7.1.2 Haier Introduction and Business Overview
- 7.1.3 Haier Air Energy Air Conditioning Sales, Revenue, Price and Gross Margin (2019-2024)
- 7.1.4 Haier Air Energy Air Conditioning Product Offerings
- 7.2 PHNIX
- 7.2.1 PHNIX Company Information
- 7.2.2 PHNIX Introduction and Business Overview
- 7.2.3 PHNIX Air Energy Air Conditioning Sales, Revenue, Price and Gross Margin (2019-2024)
- 7.2.4 PHNIX Air Energy Air Conditioning Product Offerings
- 7.2.5 PHNIX Recent Development
- 7.3 OUTES
- 7.3.1 OUTES Company Information
- 7.3.2 OUTES Introduction and Business Overview
- 7.3.3 OUTES Air Energy Air Conditioning Sales, Revenue, Price and Gross Margin (2019-2024)
- 7.3.4 OUTES Air Energy Air Conditioning Product Offerings
- 7.4 Tongyi
- 7.4.1 Tongyi Company Information
- 7.4.2 Tongyi Introduction and Business Overview
- 7.4.3 Tongyi Air Energy Air Conditioning Sales, Revenue, Price and Gross Margin (2019-2024)
- 7.4.4 Tongyi Air Energy Air Conditioning Product Offerings
- 7.5 Midea
- 7.5.1 Midea Company Information
- 7.5.2 Midea Introduction and Business Overview
- 7.5.3 Midea Air Energy Air Conditioning Sales, Revenue, Price and Gross Margin (2019-2024)
- 7.5.4 Midea Air Energy Air Conditioning Product Offerings
- 7.6 JOHNSON CONTROLS
- 7.6.1 JOHNSON CONTROLS Company Information
- 7.6.2 JOHNSON CONTROLS Introduction and Business Overview
- 7.6.3 JOHNSON CONTROLS Air Energy Air Conditioning Sales, Revenue, Price and Gross Margin (2019-2024)
- 7.6.4 JOHNSON CONTROLS Air Energy Air Conditioning Product Offerings
- 7.7 Nuentai New Energy Technology
- 7.7.1 Nuentai New Energy Technology Company Information
- 7.7.2 Nuentai New Energy Technology Introduction and Business Overview
- 7.7.3 Nuentai New Energy Technology Air Energy Air Conditioning Sales, Revenue, Price and Gross Margin (2019-2024)
- 7.7.4 Nuentai New Energy Technology Air Energy Air Conditioning Product Offerings
- 7.7.5 Nuentai New Energy Technology Recent Development
- 7.8 AMA
- 7.8.1 AMA Company Information
- 7.8.2 AMA Introduction and Business Overview
- 7.8.3 AMA Air Energy Air Conditioning Sales, Revenue, Price and Gross Margin (2019-2024)
- 7.8.4 AMA Air Energy Air Conditioning Product Offerings
- 7.9 NIBE
- 7.9.1 NIBE Company Information
- 7.9.2 NIBE Introduction and Business Overview
- 7.9.3 NIBE Air Energy Air Conditioning Sales, Revenue, Price and Gross Margin (2019-2024)
- 7.9.4 NIBE Air Energy Air Conditioning Product Offerings
- 7.9.5 NIBE Recent Development
- 7.10 BOSCH
- 7.10.1 BOSCH Company Information
- 7.10.2 BOSCH Introduction and Business Overview
- 7.10.3 BOSCH Air Energy Air Conditioning Sales, Revenue, Price and Gross Margin (2019-2024)
- 7.10.4 BOSCH Air Energy Air Conditioning Product Offerings
- 7.11 Hisense
- 7.11.1 Hisense Company Information
- 7.11.2 Hisense Introduction and Business Overview
- 7.11.3 Hisense Air Energy Air Conditioning Sales, Revenue, Price and Gross Margin (2019-2024)
- 7.11.4 Hisense Air Energy Air Conditioning Product Offerings
- 7.11.5 Hisense Recent Development
- 7.12 Power World
- 7.12.1 Power World Company Information
- 7.12.2 Power World Introduction and Business Overview
- 7.12.3 Power World Air Energy Air Conditioning Sales, Revenue, Price and Gross Margin (2019-2024)
- 7.12.4 Power World Air Energy Air Conditioning Product Offerings
- 7.13 TCL
- 7.13.1 TCL Company Information
- 7.13.2 TCL Introduction and Business Overview
- 7.13.3 TCL Air Energy Air Conditioning Sales, Revenue, Price and Gross Margin (2019-2024)
- 7.13.4 TCL Air Energy Air Conditioning Product Offerings
- 7.14 Gree Electric
- 7.14.1 Gree Electric Company Information
- 7.14.2 Gree Electric Introduction and Business Overview
- 7.14.3 Gree Electric Air Energy Air Conditioning Sales, Revenue, Price and Gross Margin (2019-2024)
- 7.14.4 Gree Electric Air Energy Air Conditioning Product Offerings
- 7.14.5 Gree Electric Recent Development
- 7.15 DAIKIN
- 7.15.1 DAIKIN Company Information
- 7.15.2 DAIKIN Introduction and Business Overview
- 7.15.3 DAIKIN Air Energy Air Conditioning Sales, Revenue, Price and Gross Margin (2019-2024)
- 7.15.4 DAIKIN Air Energy Air Conditioning Product Offerings
- 7.15.5 DAIKIN Recent Development
8 Industry Chain Analysis
- 8.1 Air Energy Air Conditioning Industrial Chain
- 8.2 Air Energy Air Conditioning Upstream Analysis
- 8.2.1 Key Raw Materials
- 8.2.2 Raw Materials Key Suppliers
- 8.2.3 Manufacturing Cost Structure
- 8.3 Midstream Analysis
- 8.4 Downstream Analysis (Customers Analysis)
- 8.5 Sales Model and Sales Channels
- 8.5.1 Air Energy Air Conditioning Sales Model
- 8.5.2 Sales Channel
- 8.5.3 Air Energy Air Conditioning Distributors
9 Research Findings and Conclusion
10 Appendix
- 10.1 Research Methodology
- 10.1.1 Methodology/Research Approach
- 10.1.2 Data Source
- 10.2 Author Details
- 10.3 Disclaimer

