|
|
市場調査レポート
商品コード
1415275
魚選別機の世界市場:2023年Global Fish Grader Market Research Report 2023 |
||||||
|
|
|||||||
カスタマイズ可能
適宜更新あり
|
|||||||


| 魚選別機の世界市場:2023年 |
|
出版日: 2024年01月23日
発行: QYResearch
ページ情報: 英文 146 Pages
納期: 2~3営業日
|

- 全表示
- 概要
- 図表
- 目次
世界の魚選別機市場規模は、2022年の1億1,738万米ドルから、予測期間中は3.60%のCAGRで推移し、2029年には1億5,520万米ドルに達すると予想されています。
北米市場は、2023年の2,509万米ドルから、3.42%のCAGRで推移し、2029年には3,070万米ドルに達すると予測されています。アジア太平洋市場は、2023年の1,919万米ドルから、5.59%のCAGRで推移し、2029年には2,660万米ドルに達すると予測されています。
当レポートでは、世界の魚選別機の市場を調査し、市場の定義と概要、市場成長への各種影響因子の分析、市場規模の推移・予測、タイプ・用途別の内訳、地域・主要国別の詳細分析、競合環境、主要企業のプロファイルなどをまとめています。
目次
第1章 魚選別機:市場概要
- 製品の定義
- 魚選別機:タイプ別
- 成長率分析:2022 vs 2029
- 大型魚選別機
- 小型魚選別機
- 魚選別機:用途別
- 成長率分析:2022 vs 2029
- 冷凍魚
- 新鮮魚
- 世界市場の成長見通し
- 製造額の推移・予測
- 製造能力の推移・予測
- 製造数の推移・予測
- 平均価格の推移・予測
- 前提・制限
第2章 市場の競合情勢:製造業者別
- 製造数の市場シェア:製造業者別
- 製造額の市場シェア:製造業者別
- 世界の主要企業:業界ランキング
- 市場シェア:企業タイプ別
- 平均価格:製造業者別
- 世界の主要製造業者:製造拠点および本社
- 世界の主要製造業者:設立日
- 競合情勢・動向
- M&A・拡大
第3章 魚選別機の製造動向:地域別
- 製造額の推計・予測:2018 vs 2022 vs 2029
- 製造額の推移・予測・市場シェア
- 製造数の推計・予測:2018 vs 2022 vs 2029
- 製造数の推移・予測・市場シェア
- 価格分析
- 製造額・製造数・前年比成長率
- 欧州
- 日本
- 中国
第4章 魚選別機の消費動向:地域別
- 消費数の推計・予測:2018 vs 2022 vs 2029
- 消費数の推移・予測
- 北米
- 欧州
- アジア太平洋
- ラテンアメリカ・中東・アフリカ
第5章 タイプ別セグメント
- 製造数の推移の推移・予測・市場シェア
- 製造額の推移の推移・予測・市場シェア
- 価格の推移・予測
第6章 用途別セグメント
- 製造数の推移の推移・予測・市場シェア
- 製造額の推移の推移・予測・市場シェア
- 価格の推移・予測
第7章 主要企業の概要
- Marel
- BAADER
- ANRITSU INFIVIS
- Cabinplant
- MARELEC
- VAKI
- MMC First Process
- FAIVRE
- Carsoe (KM Fish Machinery)
- Zhuhai Dahang
- Palinox
- AGK Kronawitter GmbH
- Afak Techniek
- IRAS A/S
- Aquamerik
- Guangdong Shanan
- UTEX
- Zhongshan Jingliang
第8章 産業チェーン・販売チャネルの分析
- 業界チェーン分析
- 主要原材料
- 製造モード・プロセス
- 販売・マーケティング
- 顧客
第9章 魚選別機:市場力学
- 業界動向
- 市場促進要因
- 市場の課題
- 市場抑制要因
第10章 調査結果・総論
第11章 調査手法・データソース
List of Tables
- Table 1. Global Fish Grader Market Value by Type, (US$ Million) & (2022 VS 2029)
- Table 2. Global Fish Grader Market Value by Application, (US$ Million) & (2022 VS 2029)
- Table 3. Global Fish Grader Production by Manufacturers (2018-2023) & (Units)
- Table 4. Global Fish Grader Production Market Share by Manufacturers (2018-2023)
- Table 5. Global Fish Grader Production Value by Manufacturers (2018-2023) & (US$ Million)
- Table 6. Global Fish Grader Production Value Share by Manufacturers (2018-2023)
- Table 7. Global Key Players of Fish Grader, Industry Ranking, 2021 VS 2022
- Table 8. Global Company Type (Tier 1, Tier 2, and Tier 3) & (based on the Production Value in Fish Grader as of 2022)
- Table 9. Global Market Fish Grader Average Price by Manufacturers (K US$/Unit) & (2018-2023)
- Table 10. Global Key Manufacturers of Fish Grader, Manufacturing Sites & Headquarters
- Table 11. Global Key Manufacturers of Fish Grader, Date of Established
- Table 12. Global Fish Grader Manufacturers Market Concentration Ratio (CR5 and HHI)
- Table 13. Mergers & Acquisitions, Expansion Plans
- Table 14. Global Fish Grader Production Value Growth Rate by Region: 2018 VS 2022 VS 2029 (US$ Million)
- Table 15. Global Fish Grader Production Value (US$ Million) by Region (2018-2023)
- Table 16. Global Fish Grader Production Value Market Share by Region (2018-2023)
- Table 17. Global Fish Grader Production Value (US$ Million) Forecast by Region (2024-2029)
- Table 18. Global Fish Grader Production Value Market Share Forecast by Region (2024-2029)
- Table 19. Global Fish Grader Production Comparison by Region: 2018 VS 2022 VS 2029 (Units)
- Table 20. Global Fish Grader Production (Units) by Region (2018-2023)
- Table 21. Global Fish Grader Production Market Share by Region (2018-2023)
- Table 22. Global Fish Grader Production (Units) Forecast by Region (2024-2029)
- Table 23. Global Fish Grader Production Market Share Forecast by Region (2024-2029)
- Table 24. Global Fish Grader Market Average Price (K US$/Unit) by Region (2018-2023)
- Table 25. Global Fish Grader Market Average Price (K US$/Unit) by Region (2024-2029)
- Table 26. Global Fish Grader Consumption Growth Rate by Region: 2018 VS 2022 VS 2029 (Units)
- Table 27. Global Fish Grader Consumption by Region (2018-2023) & (Units)
- Table 28. Global Fish Grader Consumption Market Share by Region (2018-2023)
- Table 29. Global Fish Grader Forecasted Consumption by Region (2024-2029) & (Units)
- Table 30. Global Fish Grader Forecasted Consumption Market Share by Region (2018-2023)
- Table 31. North America Fish Grader Consumption Growth Rate by Country: 2018 VS 2022 VS 2029 (Units)
- Table 32. North America Fish Grader Consumption by Country (2018-2023) & (Units)
- Table 33. North America Fish Grader Consumption by Country (2024-2029) & (Units)
- Table 34. Europe Fish Grader Consumption Growth Rate by Country: 2018 VS 2022 VS 2029 (Units)
- Table 35. Europe Fish Grader Consumption by Country (2018-2023) & (Units)
- Table 36. Europe Fish Grader Consumption by Country (2024-2029) & (Units)
- Table 37. Asia Pacific Fish Grader Consumption Growth Rate by Country: 2018 VS 2022 VS 2029 (Units)
- Table 38. Asia Pacific Fish Grader Consumption by Region (2018-2023) & (Units)
- Table 39. Asia Pacific Fish Grader Consumption by Region (2024-2029) & (Units)
- Table 40. Latin America, Middle East & Africa Fish Grader Consumption Growth Rate by Country: 2018 VS 2022 VS 2029 (Units)
- Table 41. Latin America, Middle East & Africa Fish Grader Consumption by Country (2018-2023) & (Units)
- Table 42. Latin America, Middle East & Africa Fish Grader Consumption by Country (2024-2029) & (Units)
- Table 43. Global Fish Grader Production (Units) by Type (2018-2023)
- Table 44. Global Fish Grader Production (Units) by Type (2024-2029)
- Table 45. Global Fish Grader Production Market Share by Type (2018-2023)
- Table 46. Global Fish Grader Production Market Share by Type (2024-2029)
- Table 47. Global Fish Grader Production Value (US$ Million) by Type (2018-2023)
- Table 48. Global Fish Grader Production Value (US$ Million) by Type (2024-2029)
- Table 49. Global Fish Grader Production Value Market Share by Type (2018-2023)
- Table 50. Global Fish Grader Production Value Market Share by Type (2024-2029)
- Table 51. Global Fish Grader Price (K US$/Unit) by Type (2018-2023)
- Table 52. Global Fish Grader Price (K US$/Unit) by Type (2024-2029)
- Table 53. Global Fish Grader Production (Units) by Application (2018-2023)
- Table 54. Global Fish Grader Production (Units) by Application (2024-2029)
- Table 55. Global Fish Grader Production Market Share by Application (2018-2023)
- Table 56. Global Fish Grader Production Market Share by Application (2024-2029)
- Table 57. Global Fish Grader Production Value (US$ Million) by Application (2018-2023)
- Table 58. Global Fish Grader Production Value (US$ Million) by Application (2024-2029)
- Table 59. Global Fish Grader Production Value Market Share by Application (2018-2023)
- Table 60. Global Fish Grader Production Value Market Share by Application (2024-2029)
- Table 61. Global Fish Grader Price (K US$/Unit) by Application (2018-2023)
- Table 62. Global Fish Grader Price (K US$/Unit) by Application (2024-2029)
- Table 63. Marel Fish Grader Company Information
- Table 64. Marel Fish Grader Specification and Application
- Table 65. Marel Fish Grader Production (Units), Value (US$ Million), Price (K US$/Unit) and Gross Margin (2018-2023)
- Table 66. Marel Main Business and Markets Served
- Table 67. Marel Recent Developments/Updates
- Table 68. BAADER Fish Grader Company Information
- Table 69. BAADER Fish Grader Specification and Application
- Table 70. BAADER Fish Grader Production (Units), Value (US$ Million), Price (K US$/Unit) and Gross Margin (2018-2023)
- Table 71. BAADER Main Business and Markets Served
- Table 72. BAADER Recent Developments/Updates
- Table 73. ANRITSU INFIVIS Fish Grader Company Information
- Table 74. ANRITSU INFIVIS Fish Grader Specification and Application
- Table 75. ANRITSU INFIVIS Fish Grader Production (Units), Value (US$ Million), Price (K US$/Unit) and Gross Margin (2018-2023)
- Table 76. ANRITSU INFIVIS Main Business and Markets Served
- Table 77. Cabinplant Fish Grader Company Information
- Table 78. Cabinplant Fish Grader Specification and Application
- Table 79. Cabinplant Fish Grader Production (Units), Value (US$ Million), Price (K US$/Unit) and Gross Margin (2018-2023)
- Table 80. Cabinplant Recent Developments/Updates
- Table 81. MARELEC Fish Grader Company Information
- Table 82. MARELEC Fish Grader Specification and Application
- Table 83. MARELEC Fish Grader Production (Units), Value (US$ Million), Price (K US$/Unit) and Gross Margin (2018-2023)
- Table 84. MARELEC Recent Developments/Updates
- Table 85. VAKI Fish Grader Company Information
- Table 86. VAKI Fish Grader Specification and Application
- Table 87. VAKI Fish Grader Production (Units), Value (US$ Million), Price (K US$/Unit) and Gross Margin (2018-2023)
- Table 88. VAKI Main Business and Markets Served
- Table 89. VAKI Recent Developments/Updates
- Table 90. MMC First Process Fish Grader Company Information
- Table 91. MMC First Process Fish Grader Specification and Application
- Table 92. MMC First Process Fish Grader Production (Units), Value (US$ Million), Price (K US$/Unit) and Gross Margin (2018-2023)
- Table 93. MMC First Process Main Business and Markets Served
- Table 94. FAIVRE Fish Grader Company Information
- Table 95. FAIVRE Fish Grader Specification and Application
- Table 96. FAIVRE Fish Grader Production (Units), Value (US$ Million), Price (K US$/Unit) and Gross Margin (2018-2023)
- Table 97. FAIVRE Main Business and Markets Served
- Table 98. Carsoe (KM Fish Machinery) Fish Grader Company Information
- Table 99. Carsoe (KM Fish Machinery) Fish Grader Specification and Application
- Table 100. Carsoe (KM Fish Machinery) Fish Grader Production (Units), Value (US$ Million), Price (K US$/Unit) and Gross Margin (2018-2023)
- Table 101. Carsoe (KM Fish Machinery) Main Business and Markets Served
- Table 102. Carsoe (KM Fish Machinery) Recent Developments/Updates
- Table 103. Zhuhai Dahang Fish Grader Company Information
- Table 104. Zhuhai Dahang Fish Grader Specification and Application
- Table 105. Zhuhai Dahang Fish Grader Production (Units), Value (US$ Million), Price (K US$/Unit) and Gross Margin (2018-2023)
- Table 106. Palinox Fish Grader Company Information
- Table 107. Palinox Fish Grader Specification and Application
- Table 108. Palinox Fish Grader Production (Units), Value (US$ Million), Price (K US$/Unit) and Gross Margin (2018-2023)
- Table 109. Palinox Main Business and Markets Served
- Table 110. AGK Kronawitter GmbH Fish Grader Company Information
- Table 111. AGK Kronawitter GmbH Fish Grader Specification and Application
- Table 112. AGK Kronawitter GmbH Fish Grader Production (Units), Value (US$ Million), Price (K US$/Unit) and Gross Margin (2018-2023)
- Table 113. Afak Techniek Fish Grader Company Information
- Table 114. Afak Techniek Fish Grader Specification and Application
- Table 115. Afak Techniek Fish Grader Production (Units), Value (US$ Million), Price (K US$/Unit) and Gross Margin (2018-2023)
- Table 116. Afak Techniek Main Business and Markets Served
- Table 117. IRAS A/S Fish Grader Company Information
- Table 118. IRAS A/S Fish Grader Specification and Application
- Table 119. IRAS A/S Fish Grader Production (Units), Value (US$ Million), Price (K US$/Unit) and Gross Margin (2018-2023)
- Table 120. IRAS A/S Main Business and Markets Served
- Table 121. Aquamerik Fish Grader Company Information
- Table 122. Aquamerik Fish Grader Specification and Application
- Table 123. Aquamerik Fish Grader Production (Units), Value (US$ Million), Price (K US$/Unit) and Gross Margin (2018-2023)
- Table 124. Aquamerik Main Business and Markets Served
- Table 125. Guangdong Shanan Fish Grader Company Information
- Table 126. Guangdong Shanan Fish Grader Specification and Application
- Table 127. Guangdong Shanan Fish Grader Production (Units), Value (US$ Million), Price (K US$/Unit) and Gross Margin (2018-2023)
- Table 128. UTEX Fish Grader Company Information
- Table 129. UTEX Fish Grader Specification and Application
- Table 130. UTEX Fish Grader Production (Units), Value (US$ Million), Price (K US$/Unit) and Gross Margin (2018-2023)
- Table 131. UTEX Main Business and Markets Served
- Table 132. Zhongshan Jingliang Fish Grader Company Information
- Table 133. Zhongshan Jingliang Fish Grader Specification and Application
- Table 134. Zhongshan Jingliang Fish Grader Production (Units), Value (US$ Million), Price (K US$/Unit) and Gross Margin (2018-2023)
- Table 135. Key Raw Materials Lists
- Table 136. Raw Materials Key Suppliers Lists
- Table 137. Fish Grader Distributors List
- Table 138. Fish Grader Customers List
- Table 139. Fish Grader Market Trends
- Table 140. Fish Grader Market Drivers
- Table 141. Fish Grader Market Challenges
- Table 142. Fish Grader Market Restraints
- Table 143. Research Programs/Design for This Report
- Table 144. Key Data Information from Secondary Sources
- Table 145. Key Data Information from Primary Sources
- Table 146. Authors List of This Report
- Table 147. QYR Business Unit and Senior & Team Lead Analysts
List of Figures
- Figure 1. Product Picture of Fish Grader
- Figure 2. Global Fish Grader Market Value by Type, (US$ Million) & (2018 VS 2022 VS 2029)
- Figure 3. Global Fish Grader Market Share by Type: 2022 VS 2029
- Figure 4. Large Scale Fish Grader Product Picture
- Figure 5. Compact Fish Grader Product Picture
- Figure 6. Global Fish Grader Market Value by Application, (US$ Million) & (2022 VS 2029)
- Figure 7. Global Fish Grader Market Share by Application: 2022 VS 2029
- Figure 8. Frozen Fish
- Figure 9. Fresh Fish
- Figure 10. Global Fish Grader Production Value (US$ Million), 2018 VS 2022 VS 2029
- Figure 11. Global Fish Grader Production Value (US$ Million) & (2018-2029)
- Figure 12. Global Fish Grader Production Capacity (Units) & (2018-2029)
- Figure 13. Global Fish Grader Production (Units) & (2018-2029)
- Figure 14. Global Fish Grader Average Price (K US$/Unit) & (2018-2029)
- Figure 15. Fish Grader Report Years Considered
- Figure 16. Fish Grader Production Share by Manufacturers in 2022
- Figure 17. Fish Grader Market Share by Company Type (Tier 1, Tier 2, and Tier 3): 2018 VS 2022
- Figure 18. The Global 3 and 5 Largest Players: Market Share by Fish Grader Revenue in 2022
- Figure 19. Global Fish Grader Production Value Comparison by Region: 2018 VS 2022 VS 2029 (US$ Million)
- Figure 20. Global Fish Grader Production Value Market Share by Region: 2018 - 2029
- Figure 21. Global Fish Grader Production Comparison by Region: 2018 VS 2022 VS 2029 (Units)
- Figure 22. Global Fish Grader Production Market Share by Region: 2018 - 2029
- Figure 23. Europe Fish Grader Production Value (US$ Million) Growth Rate (2018-2029)
- Figure 24. Japan Fish Grader Production Value (US$ Million) Growth Rate (2018-2029)
- Figure 25. China Fish Grader Production Value (US$ Million) Growth Rate (2018-2029)
- Figure 26. Global Fish Grader Consumption by Region: 2018 VS 2022 VS 2029 (Units)
- Figure 27. Global Fish Grader Consumption Market Share by Region: 2018 - 2029
- Figure 28. North America Fish Grader Consumption and Growth Rate (2018-2029) & (Units)
- Figure 29. North America Fish Grader Consumption Market Share by Country (2018-2029)
- Figure 30. U.S. Fish Grader Consumption and Growth Rate (2018-2029) & (Units)
- Figure 31. Canada Fish Grader Consumption and Growth Rate (2018-2029) & (Units)
- Figure 32. Europe Fish Grader Consumption and Growth Rate (2018-2029) & (Units)
- Figure 33. Europe Fish Grader Consumption Market Share by Country (2018-2029)
- Figure 34. Norway Fish Grader Consumption and Growth Rate (2018-2029) & (Units)
- Figure 35. Russia Fish Grader Consumption and Growth Rate (2018-2029) & (Units)
- Figure 36. Iceland Fish Grader Consumption and Growth Rate (2018-2029) & (Units)
- Figure 37. France Fish Grader Consumption and Growth Rate (2018-2029) & (Units)
- Figure 38. Netherlands Fish Grader Consumption and Growth Rate (2018-2029) & (Units)
- Figure 39. Asia Pacific Fish Grader Consumption and Growth Rate (2018-2029) & (Units)
- Figure 40. Asia Pacific Fish Grader Consumption Market Share by Region (2024-2029)
- Figure 41. China Fish Grader Consumption and Growth Rate (2018-2029) & (Units)
- Figure 42. Japan Fish Grader Consumption and Growth Rate (2018-2029) & (Units)
- Figure 43. South Korea Fish Grader Consumption and Growth Rate (2018-2029) & (Units)
- Figure 44. India Fish Grader Consumption and Growth Rate (2018-2029) & (Units)
- Figure 45. Southeast Asia Fish Grader Consumption and Growth Rate (2018-2029) & (Units)
- Figure 46. Latin America, Middle East & Africa Fish Grader Consumption and Growth Rate (2018-2029) & (Units)
- Figure 47. Latin America, Middle East & Africa Fish Grader Consumption Market Share by Country (2018-2029)
- Figure 48. Peru Fish Grader Consumption and Growth Rate (2018-2029) & (Units)
- Figure 49. Chile Fish Grader Consumption and Growth Rate (2018-2029) & (Units)
- Figure 50. Mexico Fish Grader Consumption and Growth Rate (2018-2029) & (Units)
- Figure 51. Global Production Market Share of Fish Grader by Type (2018-2029)
- Figure 52. Global Production Value Market Share of Fish Grader by Type (2018-2029)
- Figure 53. Global Fish Grader Price (K US$/Unit) by Type (2018-2029)
- Figure 54. Global Production Market Share of Fish Grader by Application (2018-2029)
- Figure 55. Global Production Value Market Share of Fish Grader by Application (2018-2029)
- Figure 56. Global Fish Grader Price (K US$/Unit) by Application (2018-2029)
- Figure 57. Fish Grader Value Chain
- Figure 58. Distributors Profiles
- Figure 59. Bottom-up and Top-down Approaches for This Report
- Figure 60. Data Triangulation
The global Fish Grader market was valued at US$ 117.38 million in 2022 and is anticipated to reach US$ 155.20 million by 2029, witnessing a CAGR of 3.60% during the forecast period 2023-2029.
North American market for Fish Grader is estimated to increase from $ 25.09 million in 2023 to reach $ 30.70 million by 2029, at a CAGR of 3.42 % during the forecast period of 2023 through 2029.
Asia-Pacific market for Fish Grader is estimated to increase from $ 19.19 million in 2023 to reach $ 26.60 million by 2029, at a CAGR of 5.59 % during the forecast period of 2023 through 2029.
The major global manufacturers of Fish Grader include: Marel, BAADER, ANRITSU INFIVIS, Cabinplant, MARELEC, VAKI, MMC First Process, FAIVRE, etc. In 2022, the world's top three vendors accounted for approximately 52.81 % of the revenue.
Report Scope
This report aims to provide a comprehensive presentation of the global market for Fish Grader, with both quantitative and qualitative analysis, to help readers develop business/growth strategies, assess the market competitive situation, analyze their position in the current marketplace, and make informed business decisions regarding Fish Grader.
The Fish Grader market size, estimations, and forecasts are provided in terms of output/shipments (Units) and revenue ($ millions), considering 2022 as the base year, with history and forecast data for the period from 2018 to 2029. This report segments the global Fish Grader market comprehensively. Regional market sizes, concerning products by Type, by Application, and by players, are also provided.
For a more in-depth understanding of the market, the report provides profiles of the competitive landscape, key competitors, and their respective market ranks. The report also discusses technological trends and new product developments.
The report will help the Fish Grader manufacturers, new entrants, and industry chain related companies in this market with information on the revenues, production, and average price for the overall market and the sub-segments across the different segments, by company, by Type, by Application, and by regions.
By Company
- Marel
- BAADER
- ANRITSU INFIVIS
- Cabinplant
- MARELEC
- VAKI
- MMC First Process
- FAIVRE
- Carsoe (KM Fish Machinery)
- Zhuhang Dahang
- Palinox
- AGK Kronawitter GmbH
- Afak Techniek
- IRAS A/S
- Aquamerik
- Guangdong Shanan
- UTEX
- Zhongshan Jingliang
by Type
- Large Scale Fish Grader
- Compact Fish Grader
by Application
- Frozen Fish
- Fresh Fish
Production by Region
- Europe
- China
- Japan
Consumption by Region
- North America
- U.S.
- Canada
- Asia-Pacific
- China
- Japan
- South Korea
- India
- Southeast Asia
- Others
- Europe
- Norway
- Russia
- Iceland
- France
- Netherlands
- Others
- Middle East & Africa & South America
- Peru
- Chile
- Others
Core Chapters
Chapter 1: Introduces the report scope of the report, executive summary of different market segments (by region, by Type, by Application, etc), including the market size of each market segment, future development potential, and so on. It offers a high-level view of the current state of the market and its likely evolution in the short to mid-term, and long term.
Chapter 2: Detailed analysis of Fish Grader manufacturers competitive landscape, price, production and value market share, latest development plan, merger, and acquisition information, etc.
Chapter 3: Production/output, value of Fish Grader by region/country. It provides a quantitative analysis of the market size and development potential of each region in the next six years.
Chapter 4: Consumption of Fish Grader in regional level and country level. It provides a quantitative analysis of the market size and development potential of each region and its main countries and introduces the market development, future development prospects, market space, and production of each country in the world.
Chapter 5: Provides the analysis of various market segments by Type, covering the market size and development potential of each market segment, to help readers find the blue ocean market in different market segments.
Chapter 6: Provides the analysis of various market segments by Application, covering the market size and development potential of each market segment, to help readers find the blue ocean market in different downstream markets.
Chapter 7: Provides profiles of key players, introducing the basic situation of the main companies in the market in detail, including product production/output, value, price, gross margin, product introduction, recent development, etc.
Chapter 8: Analysis of industrial chain, including the upstream and downstream of the industry.
Chapter 9: Introduces the market dynamics, latest developments of the market, the driving factors and restrictive factors of the market, the challenges and risks faced by manufacturers in the industry, and the analysis of relevant policies in the industry.
Chapter 10: The main points and conclusions of the report.
Table of Contents
1 Fish Grader Market Overview
- 1.1 Product Definition
- 1.2 Fish Grader by Type
- 1.2.1 Global Fish Grader Market Value Growth Rate Analysis by Type: 2022 VS 2029
- 1.2.2 Large Scale Fish Grader
- 1.2.3 Compact Fish Grader
- 1.3 Fish Grader by Application
- 1.3.1 Global Fish Grader Market Value Growth Rate Analysis by Application: 2022 VS 2029
- 1.3.2 Frozen Fish
- 1.3.3 Fresh Fish
- 1.4 Global Market Growth Prospects
- 1.4.1 Global Fish Grader Production Value Estimates and Forecasts (2018-2029)
- 1.4.2 Global Fish Grader Production Capacity Estimates and Forecasts (2018-2029)
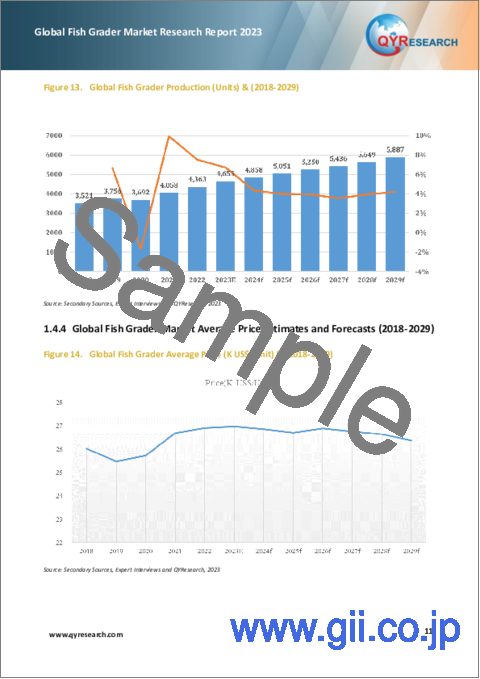
- 1.4.3 Global Fish Grader Production Estimates and Forecasts (2018-2029)
- 1.4.4 Global Fish Grader Market Average Price Estimates and Forecasts (2018-2029)
- 1.5 Assumptions and Limitations
2 Market Competition by Manufacturers
- 2.1 Global Fish Grader Production Market Share by Manufacturers (2018-2023)
- 2.2 Global Fish Grader Production Value Market Share by Manufacturers (2018-2023)
- 2.3 Global Key Players of Fish Grader, Industry Ranking, 2021 VS 2022
- 2.4 Global Fish Grader Market Share by Company Type (Tier 1, Tier 2, and Tier 3)
- 2.5 Global Fish Grader Average Price by Manufacturers (2018-2023)
- 2.6 Global Key Manufacturers of Fish Grader, Manufacturing Sites & Headquarters
- 2.7 Global Key Manufacturers of Fish Grader, Date of Established
- 2.8 Global Fish Grader Market Competitive Situation and Trends
- 2.8.1 Global Fish Grader Market Concentration Rate
- 2.8.2 Global 3 and 5 Largest Fish Grader Players Market Share by Revenue
- 2.9 Mergers & Acquisitions, Expansion
3 Fish Grader Production by Region
- 3.1 Global Fish Grader Production Value Estimates and Forecasts by Region: 2018 VS 2022 VS 2029
- 3.2 Global Fish Grader Production Value by Region (2018-2029)
- 3.2.1 Global Fish Grader Production Value Market Share by Region (2018-2023)
- 3.2.2 Global Forecasted Production Value of Fish Grader by Region (2024-2029)
- 3.3 Global Fish Grader Production Estimates and Forecasts by Region: 2018 VS 2022 VS 2029
- 3.4 Global Fish Grader Production by Region (2018-2029)
- 3.4.1 Global Fish Grader Production Market Share by Region (2018-2023)
- 3.4.2 Global Forecasted Production of Fish Grader by Region (2024-2029)
- 3.5 Global Fish Grader Market Price Analysis by Region (2018-2023)
- 3.6 Global Fish Grader Production and Value, Year-over-Year Growth
- 3.6.1 Europe Fish Grader Production Value Estimates and Forecasts (2018-2029)
- 3.6.2 Japan Fish Grader Production Value Estimates and Forecasts (2018-2029)
- 3.6.3 China Fish Grader Production Value Estimates and Forecasts (2018-2029)
4 Fish Grader Consumption by Region
- 4.1 Global Fish Grader Consumption Estimates and Forecasts by Region: 2018 VS 2022 VS 2029
- 4.2 Global Fish Grader Consumption by Region (2018-2029)
- 4.2.1 Global Fish Grader Consumption by Region (2018-2029)
- 4.2.2 Global Fish Grader Forecasted Consumption by Region (2024-2029)
- 4.3 North America
- 4.3.1 North America Fish Grader Consumption Growth Rate by Country: 2018 VS 2022 VS 2029
- 4.3.2 North America Fish Grader Consumption by Country (2018-2029)
- 4.3.3 U.S.
- 4.3.4 Canada
- 4.4 Europe
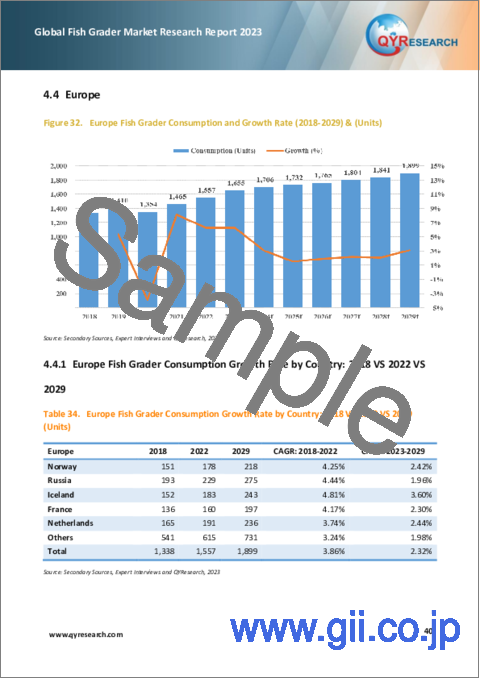
- 4.4.1 Europe Fish Grader Consumption Growth Rate by Country: 2018 VS 2022 VS 2029
- 4.4.2 Europe Fish Grader Consumption by Country (2018-2029)
- 4.4.3 Norway
- 4.4.4 Russia
- 4.4.5 Iceland
- 4.4.6 France
- 4.4.7 Netherlands
- 4.5 Asia Pacific
- 4.5.1 Asia Pacific Fish Grader Consumption Growth Rate by Country: 2018 VS 2022 VS 2029
- 4.5.2 Asia Pacific Fish Grader Consumption by Region (2018-2029)
- 4.5.3 China
- 4.5.4 Japan
- 4.5.5 South Korea
- 4.5.6 India
- 4.5.7 Southeast Asia
- 4.6 Latin America, Middle East & Africa
- 4.6.1 Latin America, Middle East & Africa Fish Grader Consumption Growth Rate by Country: 2018 VS 2022 VS 2029
- 4.6.2 Latin America, Middle East & Africa Fish Grader Consumption by Country (2018-2029)
- 4.6.3 Peru
- 4.6.4 Chile
- 4.6.5 Mexico
5 Segment by Type
- 5.1 Global Fish Grader Production by Type (2018-2029)
- 5.1.1 Global Fish Grader Production by Type (2018-2023)
- 5.1.2 Global Fish Grader Production by Type (2024-2029)
- 5.1.3 Global Fish Grader Production Market Share by Type (2018-2029)
- 5.2 Global Fish Grader Production Value by Type (2018-2029)
- 5.2.1 Global Fish Grader Production Value by Type (2018-2023)
- 5.2.2 Global Fish Grader Production Value by Type (2024-2029)
- 5.2.3 Global Fish Grader Production Value Market Share by Type (2018-2029)
- 5.3 Global Fish Grader Price by Type (2018-2029)
6 Segment by Application
- 6.1 Global Fish Grader Production by Application (2018-2029)
- 6.1.1 Global Fish Grader Production by Application (2018-2023)
- 6.1.2 Global Fish Grader Production by Application (2024-2029)
- 6.1.3 Global Fish Grader Production Market Share by Application (2018-2029)
- 6.2 Global Fish Grader Production Value by Application (2018-2029)
- 6.2.1 Global Fish Grader Production Value by Application (2018-2023)
- 6.2.2 Global Fish Grader Production Value by Application (2024-2029)
- 6.2.3 Global Fish Grader Production Value Market Share by Application (2018-2029)
- 6.3 Global Fish Grader Price by Application (2018-2029)
7 Key Companies Profiled
- 7.1 Marel
- 7.1.1 Marel Fish Grader Company Information
- 7.1.2 Marel Fish Grader Product Portfolio
- 7.1.3 Marel Fish Grader Production, Value, Price and Gross Margin (2018-2023)
- 7.1.4 Marel Main Business and Markets Served
- 7.1.5 Marel Recent Developments/Updates
- 7.2 BAADER
- 7.2.1 BAADER Fish Grader Company Information
- 7.2.2 BAADER Fish Grader Product Portfolio
- 7.2.3 BAADER Fish Grader Production, Value, Price and Gross Margin (2018-2023)
- 7.2.4 BAADER Main Business and Markets Served
- 7.2.5 BAADER Recent Developments/Updates
- 7.3 ANRITSU INFIVIS
- 7.3.1 ANRITSU INFIVIS Fish Grader Company Information
- 7.3.2 ANRITSU INFIVIS Fish Grader Product Portfolio
- 7.3.3 ANRITSU INFIVIS Fish Grader Production, Value, Price and Gross Margin (2018-2023)
- 7.3.4 ANRITSU INFIVIS Main Business and Markets Served
- 7.4 Cabinplant
- 7.4.1 Cabinplant Fish Grader Company Information
- 7.4.2 Cabinplant Fish Grader Product Portfolio
- 7.4.3 Cabinplant Fish Grader Production, Value, Price and Gross Margin (2018-2023)
- 7.4.4 Cabinplant Main Business and Markets Served
- 7.4.5 Cabinplant Recent Developments/Updates
- 7.5 MARELEC
- 7.5.1 MARELEC Fish Grader Company Information
- 7.5.2 MARELEC Fish Grader Product Portfolio
- 7.5.3 MARELEC Fish Grader Production, Value, Price and Gross Margin (2018-2023)
- 7.5.4 MARELEC Main Business and Markets Served
- 7.5.5 MARELEC Recent Developments/Updates
- 7.6 VAKI
- 7.6.1 VAKI Fish Grader Company Information
- 7.6.2 VAKI Fish Grader Product Portfolio
- 7.6.3 VAKI Fish Grader Production, Value, Price and Gross Margin (2018-2023)
- 7.6.4 VAKI Main Business and Markets Served
- 7.6.5 VAKI Recent Developments/Updates
- 7.7 MMC First Process
- 7.7.1 MMC First Process Fish Grader Company Information
- 7.7.2 MMC First Process Fish Grader Product Portfolio
- 7.7.3 MMC First Process Fish Grader Production, Value, Price and Gross Margin (2018-2023)
- 7.7.4 MMC First Process Main Business and Markets Served
- 7.8 FAIVRE
- 7.8.1 FAIVRE Fish Grader Company Information
- 7.8.2 FAIVRE Fish Grader Product Portfolio
- 7.8.3 FAIVRE Fish Grader Production, Value, Price and Gross Margin (2018-2023)
- 7.8.4 FAIVRE Main Business and Markets Served
- 7.9 Carsoe (KM Fish Machinery)
- 7.9.1 Carsoe (KM Fish Machinery) Fish Grader Company Information
- 7.9.2 Carsoe (KM Fish Machinery) Fish Grader Product Portfolio
- 7.9.3 Carsoe (KM Fish Machinery) Fish Grader Production, Value, Price and Gross Margin (2018-2023)
- 7.9.4 Carsoe (KM Fish Machinery) Main Business and Markets Served
- 7.9.5 Carsoe (KM Fish Machinery) Recent Developments/Updates
- 7.10 Zhuhai Dahang
- 7.10.1 Zhuhai Dahang Fish Grader Company Information
- 7.10.2 Zhuhai Dahang Fish Grader Product Portfolio
- 7.10.3 Zhuhai Dahang Fish Grader Production, Value, Price and Gross Margin (2018-2023)
- 7.10.4 Zhuhai Dahang Main Business and Markets Served
- 7.11 Palinox
- 7.11.1 Palinox Fish Grader Company Information
- 7.11.2 Palinox Fish Grader Product Portfolio
- 7.11.3 Palinox Fish Grader Production, Value, Price and Gross Margin (2018-2023)
- 7.11.4 Palinox Main Business and Markets Served
- 7.12 AGK Kronawitter GmbH
- 7.12.1 AGK Kronawitter GmbH Fish Grader Company Information
- 7.12.2 AGK Kronawitter GmbH Fish Grader Product Portfolio
- 7.12.3 AGK Kronawitter GmbH Fish Grader Production, Value, Price and Gross Margin (2018-2023)
- 7.12.4 AGK Kronawitter GmbH Main Business and Markets Served
- 7.13 Afak Techniek
- 7.13.1 Afak Techniek Fish Grader Company Information
- 7.13.2 Afak Techniek Fish Grader Product Portfolio
- 7.13.3 Afak Techniek Fish Grader Production, Value, Price and Gross Margin (2018-2023)
- 7.13.4 Afak Techniek Main Business and Markets Served
- 7.14 IRAS A/S
- 7.14.1 IRAS A/S Fish Grader Company Information
- 7.14.2 IRAS A/S Fish Grader Product Portfolio
- 7.14.3 IRAS A/S Fish Grader Production, Value, Price and Gross Margin (2018-2023)
- 7.14.4 IRAS A/S Main Business and Markets Served
- 7.15 Aquamerik
- 7.15.1 Aquamerik Fish Grader Company Information
- 7.15.2 Aquamerik Fish Grader Product Portfolio
- 7.15.3 Aquamerik Fish Grader Production, Value, Price and Gross Margin (2018-2023)
- 7.15.4 Aquamerik Main Business and Markets Served
- 7.16 Guangdong Shanan
- 7.16.1 Guangdong Shanan Fish Grader Company Information
- 7.16.2 Guangdong Shanan Fish Grader Product Portfolio
- 7.16.3 Guangdong Shanan Fish Grader Production, Value, Price and Gross Margin (2018-2023)
- 7.16.4 Guangdong Shanan Main Business and Markets Served
- 7.17 UTEX
- 7.17.1 UTEX Fish Grader Company Information
- 7.17.2 UTEX Fish Grader Product Portfolio
- 7.17.3 UTEX Fish Grader Production, Value, Price and Gross Margin (2018-2023)
- 7.17.4 UTEX Main Business and Markets Served
- 7.18 Zhongshan Jingliang
- 7.18.1 Zhongshan Jingliang Fish Grader Company Information
- 7.18.2 Zhongshan Jingliang Fish Grader Product Portfolio
- 7.18.3 Zhongshan Jingliang Fish Grader Production, Value, Price and Gross Margin (2018-2023)
- 7.18.4 Zhongshan Jingliang Main Business and Markets Served
8 Industry Chain and Sales Channels Analysis
- 8.1 Fish Grader Industry Chain Analysis
- 8.2 Fish Grader Key Raw Materials
- 8.2.1 Key Raw Materials
- 8.2.2 Raw Materials Key Suppliers
- 8.3 Fish Grader Production Mode & Process
- 8.4 Fish Grader Sales and Marketing
- 8.4.1 Fish Grader Sales Channels
- 8.4.2 Fish Grader Distributors
- 8.5 Fish Grader Customers
9 Fish Grader Market Dynamics
- 9.1 Fish Grader Industry Trends
- 9.2 Fish Grader Market Drivers
- 9.3 Fish Grader Market Challenges
- 9.4 Fish Grader Market Restraints
10 Research Findings and Conclusion
11 Methodology and Data Source
- 11.1 Methodology/Research Approach
- 11.1.1 Research Programs/Design
- 11.1.2 Market Size Estimation
- 11.1.3 Market Breakdown and Data Triangulation
- 11.2 Data Source
- 11.2.1 Secondary Sources
- 11.2.2 Primary Sources
- 11.3 Author List
- 11.4 Disclaimer
