|
|
市場調査レポート
商品コード
1373459
免疫比濁用試薬の世界市場、実績と予測(2018年~2029年)Global Immunoturbidimetry Reagents Market Report, History and Forecast 2018-2029 |
||||||
|
|
|||||||
カスタマイズ可能
適宜更新あり
|
|||||||

| 免疫比濁用試薬の世界市場、実績と予測(2018年~2029年) |
|
出版日: 2023年11月06日
発行: QYResearch
ページ情報: 英文 156 Pages
納期: 2~3営業日
|

全表示
- 概要
- 図表
- 目次
世界の免疫比濁用試薬の市場規模は、2022年の43億7,236万米ドルから2029年末までに75億625万米ドルに達し、2023年~2029年にCAGRで8.00%の成長が予測されています。
北米市場は2022年の18億5,950万米ドルから2029年までに31億2,876万米ドルに達する見込みで、2023年~2029年の予測期間のCAGRは7.58%です。
アジア太平洋市場は2022年の10億8,987万米ドルから2029年までに19億8,787万米ドルに達する見込みで、予測期間のCAGRは9.07%です。
欧州市場は2022年の11億4,502万米ドルから2029年までに18億7,454万米ドルに達する見込みで、予測期間のCAGRは7.27%です。
当レポートでは、世界の免疫比濁用試薬市場について調査分析し、各地域の市場規模と予測、市場力学、競合情勢などを提供しています。
目次
第1章 免疫比濁用試薬市場の概要
- 免疫比濁用試薬の製品の概要
- 免疫比濁用試薬市場:タイプ別
- 通常の免疫比濁用試薬
- ラテックス強化免疫比濁用試薬
- 世界の免疫比濁用試薬の市場規模:タイプ別
- 世界の免疫比濁用試薬の市場規模の概要:タイプ別(2018年~2029年)
- 世界の免疫比濁用試薬の市場規模の実績のレビュー:タイプ別(2018年~2023年)
- 世界の免疫比濁用試薬の市場規模の予測:タイプ別(2024年~2029年)
- 主要地域の市場規模:タイプ別
- 北米の免疫比濁用試薬の売上の内訳:タイプ別(2018年~2023年)
- 欧州の免疫比濁用試薬の売上の内訳:タイプ別(2018年~2023年)
- アジア太平洋の免疫比濁用試薬の売上の内訳:タイプ別(2018年~2023年)
- 南米の免疫比濁用試薬の売上の内訳:タイプ別(2018年~2023年)
- 中東・アフリカの免疫比濁用試薬の売上の内訳:タイプ別(2018年~2023年)
第2章 免疫比濁用試薬市場競合:企業別
- 世界の主要企業:免疫比濁用試薬の売上別(2019年~2022年)
- 世界の主要企業:免疫比濁用試薬の収益別(2019年~2022年)
- 世界の主要企業:免疫比濁用試薬の価格別(2019年~2022年)
- 世界の主要メーカーの免疫比濁用試薬の製造拠点の分布
- 免疫比濁用試薬市場の競合状況と動向
- 免疫比濁用試薬の市場集中度(2019年~2022年)
- 世界の免疫比濁用試薬収益の5大・10大メーカー(2022年)
- 世界の主要メーカー:企業タイプ別(Tier 1・Tier 2・Tier 3)(2022年の免疫比濁用試薬の収益に基づく)
- 主要メーカーの設立日
- 合併と買収、拡大
第3章 免疫比濁用試薬の現状と見通し:地域別
- 世界の免疫比濁用試薬の市場規模とCAGR:地域別(2018年・2022年・2029年)
- 世界の免疫比濁用試薬の市場規模の実績:地域別
- 世界の免疫比濁用試薬の売上数量:地域別(2018年~2023年)
- 世界の免疫比濁用試薬の売上金額:地域別(2018年~2023年)
- 世界の免疫比濁用試薬の売上(数量と金額)、価格、粗利益(2018年~2023年)
- 世界の免疫比濁用試薬の市場規模の予測:地域別
- 世界の免疫比濁用試薬の売上数量:地域別(2024年~2029年)
- 世界の免疫比濁用試薬の売上金額:地域別(2024年~2029年)
- 世界の免疫比濁用試薬の売上(数量と金額)、価格、粗利益(2024年~2029年)
第4章 免疫比濁用試薬:用途別
- 免疫比濁用試薬市場:用途別
- 糖化ヘモグロビン
- レチノール結合タンパク質
- C反応性タンパク
- 抗連鎖球菌溶血素
- リウマチ因子
- その他
- 世界の免疫比濁用試薬の市場規模:用途別
- 世界の免疫比濁用試薬の市場規模の概要:用途別(2018年~2029年)
- 世界の免疫比濁用試薬の市場規模の実績のレビュー:用途別(2018年~2023年)
- 世界の免疫比濁用試薬の市場規模の予測:用途別(2024年~2029年)
- 主要地域の市場規模:用途別
- 北米の免疫比濁用試薬の売上の内訳:用途別(2018年~2023年)
- 欧州の免疫比濁用試薬の売上の内訳:用途別(2018年~2023年)
- アジア太平洋の免疫比濁用試薬の売上の内訳:用途別(2018年~2023年)
- 南米の免疫比濁用試薬の売上の内訳:用途別(2018年~2023年)
- 中東・アフリカの免疫比濁用試薬の売上の内訳:用途別(2018年~2023年)
第5章 北米の免疫比濁用試薬:国別
- 北米の免疫比濁用試薬の市場規模の実績:国別
- 北米の免疫比濁用試薬の市場規模の予測:国別
第6章 欧州の免疫比濁用試薬:国別
- 欧州の免疫比濁用試薬の市場規模の実績:国別
- 欧州の免疫比濁用試薬の市場規模の予測:国別
第7章 アジア太平洋の免疫比濁用試薬:地域別
- アジア太平洋の免疫比濁用試薬の市場規模の実績:地域別
- アジア太平洋の免疫比濁用試薬の市場規模の予測:地域別
第8章 南米の免疫比濁用試薬:国別
- 南米の免疫比濁用試薬の市場規模の実績:国別
- 南米の免疫比濁用試薬の市場規模の予測:国別
第9章 中東・アフリカの免疫比濁用試薬:国別
- 中東・アフリカの免疫比濁用試薬の市場規模の実績:国別
- 中東・アフリカの免疫比濁用試薬の市場規模の予測:国別
第10章 企業プロファイル
- DANAHER
- Roche
- Siemens Healthcare
- Abbott
- Mindray Medical
- Beijing Strong Biotechnologies, Inc
- FUJIFILM
- Randox Laboratories
- Medicalsystem Biotechnology
- Shanghai Kehua Bio-Engineering
- Maccura Biotechnology
- NITTOBO MEDICAL
- Beijing Leadman Biochemistry
- Sentinel Diagnostics
- Erba Mannheim
- DIRUI
- DIALAB GmbH
- DiaSys Diagnostic Systems
第11章 上流、機会、課題、リスクと影響要因の分析
- 免疫比濁用試薬の主な原材料
- 主な原材料
- 原材料の主要サプライヤー
- 製造コスト構造
- 原材料
- 人件費
- 製造費
- 免疫比濁用試薬の産業チェーン分析
- 免疫比濁用試薬の市場力学
- 免疫比濁用試薬産業の動向
- 免疫比濁用試薬市場の促進要因
- 免疫比濁用試薬市場の抑制要因
第12章 マーケティング戦略の分析、販売業者
- 販売チャネル
- 免疫比濁用試薬の販売業者
- 免疫比濁用試薬の下流顧客
第13章 調査結果と結論
第14章 付録
List of Tables
- Table 1. Major Company of Common Immune Turbidimetric Reagent
- Table 2. Major Company of Latex Enhanced Immune Turbidimetric Reagent
- Table 3. Global Immunoturbidimetry Reagents Sales by Type: 2018 VS 2022 VS 2029 (US$ Million)
- Table 4. Global Immunoturbidimetry Reagents Sales by Type (2018-2023) & (K Box)
- Table 5. Global Immunoturbidimetry Reagents Sales Market Share in Volume by Type (2018-2023)
- Table 6. Global Immunoturbidimetry Reagents Sales by Type (2018-2023) & (US$ Million)
- Table 7. Global Immunoturbidimetry Reagents Sales Market Share in Value by Type (2018-2023)
- Table 8. Global Immunoturbidimetry Reagents Price by Type (2018-2023) & (US$/Box)
- Table 9. Global Immunoturbidimetry Reagents Sales by Type (2024-2029) & (K Box)
- Table 10. Global Immunoturbidimetry Reagents Sales Market Share in Volume by Type (2024-2029)
- Table 11. Global Immunoturbidimetry Reagents Sales by Type (2024-2029) & (US$ Million)
- Table 12. Global Immunoturbidimetry Reagents Sales Market Share in Value by Type (2024-2029)
- Table 13. Global Immunoturbidimetry Reagents Price by Type (2024-2029) & (US$/Box)
- Table 14. North America Immunoturbidimetry Reagents Sales by Type (2018-2023) & (K Box)
- Table 15. Europe Immunoturbidimetry Reagents Sales (K Box) by Type (2018-2023)
- Table 16. Asia-Pacific Immunoturbidimetry Reagents Sales (K Box) by Type (2018-2023)
- Table 17. South America Immunoturbidimetry Reagents Sales (K Box) by Type (2018-2023)
- Table 18. Middle East and Africa Immunoturbidimetry Reagents Sales (K Box) by Type (2018-2023)
- Table 19. Global Immunoturbidimetry Reagents Sales by Company (2019-2022) & (K Box)
- Table 20. Global Immunoturbidimetry Reagents Sales Share by Company (2019-2022)
- Table 21. Global Immunoturbidimetry Reagents Revenue by Company (2019-2022) & (US$ Million)
- Table 22. Global Immunoturbidimetry Reagents Revenue Share by Company (2019-2022)
- Table 23. Global Market Immunoturbidimetry Reagents Price by Company (2019-2022) & (US$/Box)
- Table 24. Global Immunoturbidimetry Reagents Top Manufacturers Manufacturing Base Distribution and Headquarters
- Table 25. Global Immunoturbidimetry Reagents Manufacturers Market Concentration Ratio (CR5 and HHI)
- Table 26. Global Top Manufacturers Market Share by Company Type (Tier 1, Tier 2, and Tier 3) & (based on the Revenue in Immunoturbidimetry Reagents as of 2022)
- Table 27. Date of Key Manufacturers Established Date
- Table 28. Mergers & Acquisitions, Expansion Plans
- Table 29. Global Immunoturbidimetry Reagents Market Size Comparison by Region (US$ Million): 2018 VS 2022 VS 2029
- Table 30. Global Immunoturbidimetry Reagents Sales by Region (2018-2023) & (K Box)
- Table 31. Global Immunoturbidimetry Reagents Sales Market Share in Volume by Region (2018-2023)
- Table 32. Global Immunoturbidimetry Reagents Sales by Region (2018-2023) & (US$ Million)
- Table 33. Global Immunoturbidimetry Reagents Sales Market Share in Value by Region (2018-2023)
- Table 34. Global Immunoturbidimetry Reagents Sales (K Box), Value (US$ Million), Price (US$/Box) and Gross Margin (2018-2023)
- Table 35. Global Immunoturbidimetry Reagents Sales by Region (2024-2029) & (K Box)
- Table 36. Global Immunoturbidimetry Reagents Sales Market Share in Volume by Region (2024-2029)
- Table 37. Global Immunoturbidimetry Reagents Sales by Region (2024-2029) & (US$ Million)
- Table 38. Global Immunoturbidimetry Reagents Sales Market Share in Value by Region (2024-2029)
- Table 39. Global Immunoturbidimetry Reagents Sales (K Box), Value (US$ Million), Price (US$/Box) and Gross Margin (2024-2029)
- Table 40. Global Immunoturbidimetry Reagents Sales by Application: 2018 VS 2022 VS 2029 (US$ Million)
- Table 41. Global Immunoturbidimetry Reagents Sales by Application (2018-2023) & (K Box)
- Table 42. Global Immunoturbidimetry Reagents Sales Market Share in Volume by Application (2018-2023)
- Table 43. Global Immunoturbidimetry Reagents Sales by Application (2018-2023) & (US$ Million)
- Table 44. Global Immunoturbidimetry Reagents Sales Market Share in Value by Application (2018-2023)
- Table 45. Global Immunoturbidimetry Reagents Price by Application (2018-2023) & (US$/Box)
- Table 46. Global Immunoturbidimetry Reagents Sales by Application (2024-2029) & (K Box)
- Table 47. Global Immunoturbidimetry Reagents Sales Market Share in Volume by Application (2024-2029)
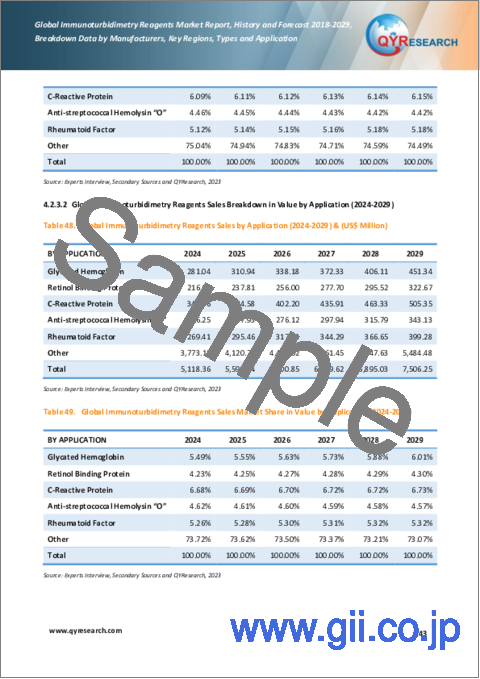
- Table 48. Global Immunoturbidimetry Reagents Sales by Application (2024-2029) & (US$ Million)
- Table 49. Global Immunoturbidimetry Reagents Sales Market Share in Value by Application (2024-2029)
- Table 50. Global Immunoturbidimetry Reagents Price by Application (2024-2029) & (US$/Box)
- Table 51. North America Immunoturbidimetry Reagents Sales by Application (2018-2023) & (K Box)
- Table 52. Europe Immunoturbidimetry Reagents Sales (K Box) by Application (2018-2023)
- Table 53. Asia-Pacific Immunoturbidimetry Reagents Sales (K Box) by Application (2018-2023)
- Table 54. South America Immunoturbidimetry Reagents Sales (K Box) by Application (2018-2023)
- Table 55. Middle East and Africa Immunoturbidimetry Reagents Sales (K Box) by Application (2018-2023)
- Table 56. North America Immunoturbidimetry Reagents Market Size Growth Rate (CAGR) by Country (US$ Million): 2018 VS 2022 VS 2029
- Table 57. North America Immunoturbidimetry Reagents Sales by Country (2018-2023) & (K Box)
- Table 58. North America Immunoturbidimetry Reagents Sales Market Share in Volume by Country (2018-2023)
- Table 59. North America Immunoturbidimetry Reagents Sales by Country (2018-2023) & (US$ Million)
- Table 60. North America Immunoturbidimetry Reagents Sales Market Share in Value by Country (2018-2023)
- Table 61. North America Immunoturbidimetry Reagents Sales by Country (2024-2029) & (K Box)
- Table 62. North America Immunoturbidimetry Reagents Sales Market Share in Volume by Country (2024-2029)
- Table 63. North America Immunoturbidimetry Reagents Sales by Country (2024-2029) & (US$ Million)
- Table 64. North America Immunoturbidimetry Reagents Sales Market Share in Value by Country (2024-2029)
- Table 65. Europe Immunoturbidimetry Reagents Market Size Growth Rate (CAGR) by Country (US$ Million): 2018 VS 2022 VS 2029
- Table 66. Europe Immunoturbidimetry Reagents Sales by Country (2018-2023) & (K Box)
- Table 67. Europe Immunoturbidimetry Reagents Sales Market Share in Volume by Country (2018-2023)
- Table 68. Europe Immunoturbidimetry Reagents Sales by Country (2018-2023) & (US$ Million)
- Table 69. Europe Immunoturbidimetry Reagents Sales Market Share in Value by Country (2018-2023)
- Table 70. Europe Immunoturbidimetry Reagents Sales by Country (2024-2029) & (K Box)
- Table 71. Europe Immunoturbidimetry Reagents Sales Market Share in Volume by Country (2024-2029)
- Table 72. Europe Immunoturbidimetry Reagents Sales by Country (2024-2029) & (US$ Million)
- Table 73. Europe Immunoturbidimetry Reagents Sales Market Share in Value by Country (2024-2029)
- Table 74. Asia-Pacific Immunoturbidimetry Reagents Market Size Growth Rate (CAGR) by Region (US$ Million): 2018 VS 2022 VS 2029
- Table 75. Asia-Pacific Immunoturbidimetry Reagents Sales by Region (2018-2023) & (K Box)
- Table 76. Asia-Pacific Immunoturbidimetry Reagents Sales Market Share in Volume by Region (2018-2023)
- Table 77. Asia-Pacific Immunoturbidimetry Reagents Sales by Region (2018-2023) & (US$ Million)
- Table 78. Asia-Pacific Immunoturbidimetry Reagents Sales Market Share in Value by Region (2018-2023)
- Table 79. Asia-Pacific Immunoturbidimetry Reagents Sales by Region (2024-2029) & (K Box)
- Table 80. Asia-Pacific Immunoturbidimetry Reagents Sales Market Share in Volume by Region (2024-2029)
- Table 81. Asia-Pacific Immunoturbidimetry Reagents Sales by Region (2024-2029) & (US$ Million)
- Table 82. Asia-Pacific Immunoturbidimetry Reagents Sales Market Share in Value by Region (2024-2029)
- Table 83. South America Immunoturbidimetry Reagents Market Size Growth Rate (CAGR) by Country (US$ Million): 2018 VS 2022 VS 2029
- Table 84. South America Immunoturbidimetry Reagents Sales by Country (2018-2023) & (K Box)
- Table 85. South America Immunoturbidimetry Reagents Sales Market Share in Volume by Country (2018-2023)
- Table 86. South America Immunoturbidimetry Reagents Sales by Country (2018-2023) & (US$ Million)
- Table 87. South America Immunoturbidimetry Reagents Sales Market Share in Value by Country (2018-2023)
- Table 88. South America Immunoturbidimetry Reagents Sales by Country (2024-2029) & (K Box)
- Table 89. South America Immunoturbidimetry Reagents Sales Market Share in Volume by Country (2024-2029)
- Table 90. South America Immunoturbidimetry Reagents Sales by Country (2024-2029) & (US$ Million)
- Table 91. South America Immunoturbidimetry Reagents Sales Market Share in Value by Country (2024-2029)
- Table 92. Middle East and Africa Immunoturbidimetry Reagents Market Size Growth Rate (CAGR) by Country (US$ Million): 2018 VS 2022 VS 2029
- Table 93. Middle East and Africa Immunoturbidimetry Reagents Sales by Country (2018-2023) & (K Box)
- Table 94. Middle East and Africa Immunoturbidimetry Reagents Sales Market Share in Volume by Country (2018-2023)
- Table 95. Middle East and Africa Immunoturbidimetry Reagents Sales by Country (2018-2023) & (US$ Million)
- Table 96. Middle East and Africa Immunoturbidimetry Reagents Sales Market Share in Value by Country (2018-2023)
- Table 97. Middle East and Africa Immunoturbidimetry Reagents Sales by Country (2024-2029) & (K Box)
- Table 98. Middle East and Africa Immunoturbidimetry Reagents Sales Market Share by Country (2024-2029)
- Table 99. Middle East and Africa Immunoturbidimetry Reagents Sales by Country (2024-2029) & (US$ Million)
- Table 100. Middle East and Africa Immunoturbidimetry Reagents Sales Market Share in Value by Country (2024-2029)
- Table 101. DANAHER Company Information
- Table 102. DANAHER Introduction and Business Overview
- Table 103. DANAHER Immunoturbidimetry Reagents Sales (K Box), Revenue (US$ Million), Price (US$/Box) and Gross Margin (2019-2022)
- Table 104. DANAHER Immunoturbidimetry Reagents Product
- Table 105. Roche Company Information
- Table 106. Roche Introduction and Business Overview
- Table 107. Roche Immunoturbidimetry Reagents Sales (K Box), Revenue (US$ Million), Price (US$/Box) and Gross Margin (2019-2022)
- Table 108. Roche Immunoturbidimetry Reagents Product
- Table 109. Siemens Healthcare Company Information
- Table 110. Siemens Healthcare Introduction and Business Overview
- Table 111. Siemens Healthcare Immunoturbidimetry Reagents Sales (K Box), Revenue (US$ Million), Price (US$/Box) and Gross Margin (2019-2022)
- Table 112. Siemens Healthcare Immunoturbidimetry Reagents Product
- Table 113. Abbott Company Information
- Table 114. Abbott Introduction and Business Overview
- Table 115. Abbott Immunoturbidimetry Reagents Sales (K Box), Revenue (US$ Million), Price (US$/Box) and Gross Margin (2019-2022)
- Table 116. Abbott Immunoturbidimetry Reagents Product
- Table 117. Mindray Medical Company Information
- Table 118. Mindray Medical Introduction and Business Overview
- Table 119. Mindray Medical Immunoturbidimetry Reagents Sales (K Box), Revenue (US$ Million), Price (US$/Box) and Gross Margin (2019-2022)
- Table 120. Mindray Medical Immunoturbidimetry Reagents Product
- Table 121. Beijing Strong Biotechnologies, Inc Company Information
- Table 122. Beijing Strong Biotechnologies, Inc Introduction and Business Overview
- Table 123. Beijing Strong Biotechnologies, Inc Immunoturbidimetry Reagents Sales (K Box), Revenue (US$ Million), Price (US$/Box) and Gross Margin (2019-2022)
- Table 124. Beijing Strong Biotechnologies, Inc Immunoturbidimetry Reagents Product
- Table 125. FUJIFILM Company Information
- Table 126. FUJIFILM Introduction and Business Overview
- Table 127. FUJIFILM Immunoturbidimetry Reagents Sales (K Box), Revenue (US$ Million), Price (US$/Box) and Gross Margin (2019-2022)
- Table 128. FUJIFILM Immunoturbidimetry Reagents Product
- Table 129. Randox Laboratories Company Information
- Table 130. Randox Laboratories Introduction and Business Overview
- Table 131. Randox Laboratories Immunoturbidimetry Reagents Sales (K Box), Revenue (US$ Million), Price (US$/Box) and Gross Margin (2019-2022)
- Table 132. Randox Laboratories Immunoturbidimetry Reagents Product
- Table 133. Medicalsystem Biotechnology Company Information
- Table 134. Medicalsystem Biotechnology Introduction and Business Overview
- Table 135. Medicalsystem Biotechnology Immunoturbidimetry Reagents Sales (K Box), Revenue (US$ Million), Price (US$/Box) and Gross Margin (2019-2022)
- Table 136. Medicalsystem Biotechnology Immunoturbidimetry Reagents Product
- Table 137. Shanghai Kehua Bio-Engineering Company Information
- Table 138. Shanghai Kehua Bio-Engineering Introduction and Business Overview
- Table 139. Shanghai Kehua Bio-Engineering Immunoturbidimetry Reagents Sales (K Box), Revenue (US$ Million), Price (US$/Box) and Gross Margin (2019-2022)
- Table 140. Shanghai Kehua Bio-Engineering Immunoturbidimetry Reagents Product
- Table 141. Maccura Biotechnology Company Information
- Table 142. Maccura Biotechnology Introduction and Business Overview
- Table 143. Maccura Biotechnology Immunoturbidimetry Reagents Sales (K Box), Revenue (US$ Million), Price (US$/Box) and Gross Margin (2019-2022)
- Table 144. Maccura Biotechnology Immunoturbidimetry Reagents Product
- Table 145. NITTOBO MEDICAL Company Information
- Table 146. NITTOBO MEDICAL Introduction and Business Overview
- Table 147. NITTOBO MEDICAL Immunoturbidimetry Reagents Sales (K Box), Revenue (US$ Million), Price (US$/Box) and Gross Margin (2019-2022)
- Table 148. NITTOBO MEDICAL Immunoturbidimetry Reagents Product
- Table 149. Beijing Leadman Biochemistry Company Information
- Table 150. Beijing Leadman Biochemistry Introduction and Business Overview
- Table 151. Beijing Leadman Biochemistry Immunoturbidimetry Reagents Sales (K Box), Revenue (US$ Million), Price (US$/Box) and Gross Margin (2019-2022)
- Table 152. Beijing Leadman Biochemistry Immunoturbidimetry Reagents Product
- Table 153. Sentinel Diagnostics Company Information
- Table 154. Sentinel Diagnostics Introduction and Business Overview
- Table 155. Sentinel Diagnostics Immunoturbidimetry Reagents Sales (K Box), Revenue (US$ Million), Price (US$/Box) and Gross Margin (2019-2022)
- Table 156. Sentinel Diagnostics Immunoturbidimetry Reagents Product
- Table 157. Erba Mannheim Company Information
- Table 158. Erba Mannheim Introduction and Business Overview
- Table 159. Erba Mannheim Immunoturbidimetry Reagents Sales (K Box), Revenue (US$ Million), Price (US$/Box) and Gross Margin (2019-2022)
- Table 160. Erba Mannheim Immunoturbidimetry Reagents Product
- Table 161. DIRUI Company Information
- Table 162. DIRUI Introduction and Business Overview
- Table 163. DIRUI Immunoturbidimetry Reagents Sales (K Box), Revenue (US$ Million), Price (US$/Box) and Gross Margin (2019-2022)
- Table 164. DIRUI Immunoturbidimetry Reagents Product
- Table 165. DIALAB GmbH Company Information
- Table 166. DIALAB GmbH Introduction and Business Overview
- Table 167. DIALAB GmbH Immunoturbidimetry Reagents Sales (K Box), Revenue (US$ Million), Price (US$/Box) and Gross Margin (2019-2022)
- Table 168. DIALAB GmbH Immunoturbidimetry Reagents Product
- Table 169. DiaSys Diagnostic Systems Company Information
- Table 170. DiaSys Diagnostic Systems Introduction and Business Overview
- Table 171. DiaSys Diagnostic Systems Immunoturbidimetry Reagents Sales (K Box), Revenue (US$ Million), Price (US$/Box) and Gross Margin (2019-2022)
- Table 172. DiaSys Diagnostic Systems Immunoturbidimetry Reagents Product
- Table 173. Key Raw Materials Lists
- Table 174. Raw Materials Key Suppliers Lists
- Table 175. Immunoturbidimetry Reagents Market Trends
- Table 176. Immunoturbidimetry Reagents Market Drivers
- Table 177. Immunoturbidimetry Reagents Market Restraints
- Table 178. Immunoturbidimetry Reagents Distributors List
- Table 179. Immunoturbidimetry Reagents Downstream Customers
- Table 180. Research Programs/Design for This Report
- Table 181. Key Data Information from Secondary Sources
- Table 182. Key Data Information from Primary Sources
- Table 183. QYR Business Unit and Senior & Team Lead Analysts
List of Figures
- Figure 1. Immunoturbidimetry Reagents Product Picture
- Figure 2. Global Immunoturbidimetry Reagents Market Size, 2018 VS 2022 VS 2029 (US$ Million)
- Figure 3. Global Immunoturbidimetry Reagents Market Size Status and Outlook (2018-2029) & (US$ Million)
- Figure 4. Global Immunoturbidimetry Reagents Sales Status and Outlook (2018-2029) & (K Box)
- Figure 5. Product Picture of Common Immune Turbidimetric Reagent
- Figure 6. Global Common Immune Turbidimetric Reagent Sales YoY Growth (2018-2029) & (K Box)
- Figure 7. Product Picture of Latex Enhanced Immune Turbidimetric Reagent
- Figure 8. Global Latex Enhanced Immune Turbidimetric Reagent Sales YoY Growth (2018-2029) & (K Box)
- Figure 9. Global Immunoturbidimetry Reagents Sales by Type (2018-2029) & (US$ Million)
- Figure 10. Global Immunoturbidimetry Reagents Market Share by Type in 2022 & 2029
- Figure 11. North America Immunoturbidimetry Reagents Sales Market Share in Volume by Type in 2022
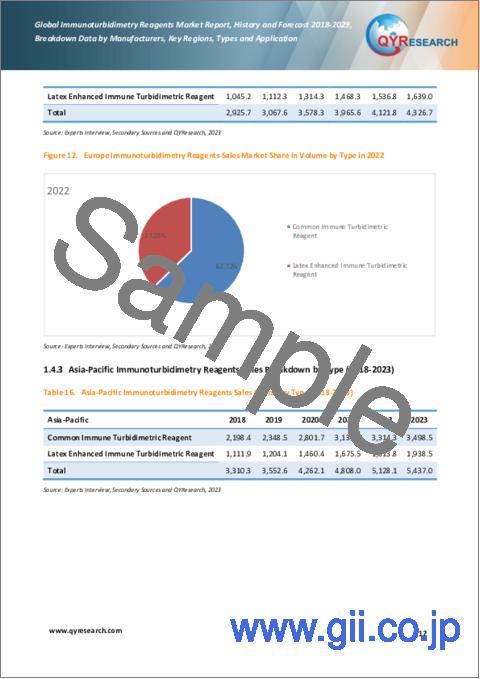
- Figure 12. Europe Immunoturbidimetry Reagents Sales Market Share in Volume by Type in 2022
- Figure 13. Asia-Pacific Immunoturbidimetry Reagents Sales Market Share in Volume by Type in 2022
- Figure 14. South America Immunoturbidimetry Reagents Sales Market Share in Volume by Type in 2022
- Figure 15. Middle East and Africa Immunoturbidimetry Reagents Sales Market Share in Volume by Type in 2022
- Figure 16. The 5 Largest Manufacturers in the World: Market Share by Immunoturbidimetry Reagents Revenue in 2022
- Figure 17. The 10 Largest Manufacturers in the World: Market Share by Immunoturbidimetry Reagents Revenue in 2022
- Figure 18. Product Picture of Glycated Hemoglobin
- Figure 19. Global Glycated Hemoglobin Sales YoY Growth (2018-2029) & (K Box)
- Figure 20. Product Picture of Retinol Binding Protein
- Figure 21. Global Retinol Binding Protein Sales YoY Growth (2018-2029) & (K Box)
- Figure 22. Product Picture of C-Reactive Protein
- Figure 23. Global C-Reactive Protein Sales YoY Growth (2018-2029) & (K Box)
- Figure 24. Product Picture of Anti-streptococcal Hemolysin "O"
- Figure 25. Global Anti-streptococcal Hemolysin '淥' Sales YoY Growth (2018-2029) & (K Box)
- Figure 26. Product Picture of Rheumatoid Factor
- Figure 27. Global Rheumatoid Factor Sales YoY Growth (2018-2029) & (K Box)
- Figure 28. Product Picture of Other
- Figure 29. Global Other Sales YoY Growth (2018-2029) & (K Box)
- Figure 30. Global Immunoturbidimetry Reagents Sales by Application (2018-2029) & (US$ Million)
- Figure 31. Global Immunoturbidimetry Reagents Market Share by Application in 2022 & 2029
- Figure 32. North America Immunoturbidimetry Reagents Sales Market Share in Volume by Application in 2022
- Figure 33. Europe Immunoturbidimetry Reagents Sales Market Share in Volume by Application in 2022
- Figure 34. Asia-Pacific Immunoturbidimetry Reagents Sales Market Share in Volume by Application in 2022
- Figure 35. South America Immunoturbidimetry Reagents Sales Market Share in Volume by Application in 2022
- Figure 36. Middle East and Africa Immunoturbidimetry Reagents Sales Market Share in Volume by Application in 2022
- Figure 37. Immunoturbidimetry Reagents Manufacturing Cost Structure
- Figure 38. Immunoturbidimetry Reagents Industrial Chain Analysis
- Figure 39. Channels of Distribution
- Figure 40. Distributors Profiles
- Figure 41. Bottom-up and Top-down Approaches for This Report
- Figure 42. Data Triangulation
- Figure 43. Key Executives Interviewed
The global Immunoturbidimetry Reagents market was valued at US$ 4,372.36 million in 2022 and will reach US$ 7,506.25 million by the end of 2029, growing at a CAGR of 8.00% during 2023-2029.
North American market for Immunoturbidimetry Reagents was valued at $ 1,859.50 million in 2022 and will reach $ 3,128.76 million by 2029, at a CAGR of 7.58% during the forecast period of 2023 through 2029.
Asia-Pacific market for Immunoturbidimetry Reagents was valued at $ 1,089.87 million in 2022 and will reach $ 1,987.87 million by 2029, at a CAGR of 9.07% during the forecast period of 2023 through 2029.
Europe market for Immunoturbidimetry Reagents was valued at $ 1,145.02 million in 2022 and will reach $ 1,874.54 million by 2029, at a CAGR of 7.27% during the forecast period of 2023 through 2029.
Report Scope
This report aims to provide a comprehensive presentation of the global market for Immunoturbidimetry Reagents, with both quantitative and qualitative analysis, to help readers develop business/growth strategies, assess the market competitive situation, analyze their position in the current marketplace, and make informed business decisions regarding Immunoturbidimetry Reagents.
The Immunoturbidimetry Reagents market size, estimations, and forecasts are provided in terms of sales volume (K Box) and revenue ($ millions), considering 2022 as the base year, with history and forecast data for the period from 2018 to 2029. This report segments the global Immunoturbidimetry Reagents market comprehensively. Regional market sizes, concerning products by Type, by Application, and by players, are also provided.
For a more in-depth understanding of the market, the report provides profiles of the competitive landscape, key competitors, and their respective market ranks. The report also discusses technological trends and new product developments.
This report will help the readers to understand the competition within the industries and strategies for the competitive environment to enhance the potential profit. The report also focuses on the competitive landscape of the global Immunoturbidimetry Reagents market, and introduces in detail the market share, industry ranking, competitor ecosystem, market performance, new product development, operation situation, expansion, and acquisition. etc. of the main players, which helps the readers to identify the main competitors and deeply understand the competition pattern of the market.
Market Segmentation
This report covers the Immunoturbidimetry Reagents segments by manufacturers, by Type, by Application, by region and country, and provides market size (value, volume and average price) and CAGR for the history and forecast period (2018-2022, 2023-2029), considering 2022 as the base year. It elucidates potential revenue opportunities across different segments and explains attractive investment proposition matrices for this market.
By Company
- DANAHER
- Roche
- Siemens Healthcare
- Abbott
- Mindray Medical
- Beijing Strong Biotechnologies
- FUJIFILM
- Randox Laboratories
- Medicalsystem Biotechnology
- Shanghai Kehua Bio-Engineering
- Maccura Biotechnology
- NITTOBO MEDICAL
- Beijing Leadman Biochemistry
- Sentinel Diagnostics
- Erba Mannheim
- DIRUI
- DIALAB GmbH
- DiaSys Diagnostic Systems
Segment by Type
- Common Immune Turbidimetric Reagent
- Latex Enhanced Immune Turbidimetric Reagent
Segment by Application
- Glycated hemoglobin
- Retinol Binding Protein
- C-Reactive Protein
- Anti-streptococcal hemolysin "O"
- Rheumatoid Factor
- Other
By Region
- North America
- United States
- Canada
- Mexico
- Asia-Pacific
- China
- Japan
- South Korea
- India
- Australia
- Southeast Asia
- Europe
- Germany
- France
- U.K.
- Italy
- Spain
- South America
- Brazil
- Argentina
- Middle East & Africa
- Turkey
- Saudi Arabia
- South Africa
Core Chapters
Chapter One: Introduces the study scope of this report, executive summary of market segments by Type, market size segments for North America, Europe, Asia Pacific, South America, Middle East & Africa.
Chapter Two: Detailed analysis of Immunoturbidimetry Reagents manufacturers competitive landscape, price, sales, revenue, market share and ranking, latest development plan, merger, and acquisition information, etc.
Chapter Three: Sales, revenue of Immunoturbidimetry Reagents in regional level. It provides a quantitative analysis of the market size and development potential of each region and introduces the future development prospects, and market space in the world.
Chapter Four: Introduces market segments by Application, market size segment for North America, Europe, Asia Pacific, South America, Middle East & Africa.
Chapter Five, Six, Seven, Eight and Nine: North America, Europe, Asia Pacific, South America, Middle East & Africa, sales and revenue by country.
Chapter Ten: Provides profiles of key players, introducing the basic situation of the main companies in the market in detail, including product sales, revenue, price, gross margin, product introduction, recent development, etc.
Chapter Eleven: Analysis of industrial chain, key raw materials, manufacturing cost, and market dynamics. Introduces the market dynamics, latest developments of the market, the driving factors and restrictive factors of the market, the challenges and risks faced by manufacturers in the industry, and the analysis of relevant policies in the industry.
Chapter Twelve: Analysis of sales channel, distributors and customers.
Chapter Thirteen: Research Findings and Conclusion.
Table of Contents
1 Immunoturbidimetry Reagents Market Overview
- 1.1 Immunoturbidimetry Reagents Product Overview
- 1.2 Immunoturbidimetry Reagents Market by Type
- 1.2.1 Common Immune Turbidimetric Reagent
- 1.2.2 Latex Enhanced Immune Turbidimetric Reagent
- 1.3 Global Immunoturbidimetry Reagents Market Size by Type
- 1.3.1 Global Immunoturbidimetry Reagents Market Size Overview by Type (2018-2029)
- 1.3.2 Global Immunoturbidimetry Reagents Historic Market Size Review by Type (2018-2023)
- 1.3.3 Global Immunoturbidimetry Reagents Forecasted Market Size by Type (2024-2029)
- 1.4 Key Regions Market Size by Type
- 1.4.1 North America Immunoturbidimetry Reagents Sales Breakdown by Type (2018-2023)
- 1.4.2 Europe Immunoturbidimetry Reagents Sales Breakdown by Type (2018-2023)
- 1.4.3 Asia-Pacific Immunoturbidimetry Reagents Sales Breakdown by Type (2018-2023)
- 1.4.4 South America Immunoturbidimetry Reagents Sales Breakdown by Type (2018-2023)
- 1.4.5 Middle East and Africa Immunoturbidimetry Reagents Sales Breakdown by Type (2018-2023)
2 Immunoturbidimetry Reagents Market Competition by Company
- 2.1 Global Top Players by Immunoturbidimetry Reagents Sales (2019-2022)
- 2.2 Global Top Players by Immunoturbidimetry Reagents Revenue (2019-2022)
- 2.3 Global Top Players by Immunoturbidimetry Reagents Price (2019-2022)
- 2.4 Global Top Manufacturers Immunoturbidimetry Reagents Manufacturing Base Distribution
- 2.5 Immunoturbidimetry Reagents Market Competitive Situation and Trends
- 2.5.1 Immunoturbidimetry Reagents Market Concentration Rate (2019-2022)
- 2.5.2 Global 5 and 10 Largest Manufacturers by Immunoturbidimetry Reagents Revenue in 2022
- 2.6 Global Top Manufacturers by Company Type (Tier 1, Tier 2, and Tier 3) & (based on the Revenue in Immunoturbidimetry Reagents as of 2022)
- 2.7 Date of Key Manufacturers Established Date
- 2.8 Mergers & Acquisitions, Expansion
3 Immunoturbidimetry Reagents Status and Outlook by Region
- 3.1 Global Immunoturbidimetry Reagents Market Size and CAGR by Region: 2018 VS 2022 VS 2029
- 3.2 Global Immunoturbidimetry Reagents Historic Market Size by Region
- 3.2.1 Global Immunoturbidimetry Reagents Sales in Volume by Region (2018-2023)
- 3.2.2 Global Immunoturbidimetry Reagents Sales in Value by Region (2018-2023)
- 3.2.3 Global Immunoturbidimetry Reagents Sales (Volume & Value), Price and Gross Margin (2018-2023)
- 3.3 Global Immunoturbidimetry Reagents Forecasted Market Size by Region
- 3.3.1 Global Immunoturbidimetry Reagents Sales in Volume by Region (2024-2029)
- 3.3.2 Global Immunoturbidimetry Reagents Sales in Value by Region (2024-2029)
- 3.3.3 Global Immunoturbidimetry Reagents Sales (Volume & Value), Price and Gross Margin (2024-2029)
4 Immunoturbidimetry Reagents by Application
- 4.1 Immunoturbidimetry Reagents Market by Application
- 4.1.1 Glycated Hemoglobin
- 4.1.2 Retinol Binding Protein
- 4.1.3 C-Reactive Protein
- 4.1.4 Anti-streptococcal Hemolysin '淥'
- 4.1.5 Rheumatoid Factor
- 4.1.6 Other
- 4.2 Global Immunoturbidimetry Reagents Market Size by Application
- 4.2.1 Global Immunoturbidimetry Reagents Market Size Overview by Application (2018-2029)
- 4.2.2 Global Immunoturbidimetry Reagents Historic Market Size Review by Application (2018-2023)
- 4.2.3 Global Immunoturbidimetry Reagents Forecasted Market Size by Application (2024-2029)
- 4.3 Key Regions Market Size by Application
- 4.3.1 North America Immunoturbidimetry Reagents Sales Breakdown by Application (2018-2023)
- 4.3.2 Europe Immunoturbidimetry Reagents Sales Breakdown by Application (2018-2023)
- 4.3.3 Asia-Pacific Immunoturbidimetry Reagents Sales Breakdown by Application (2018-2023)
- 4.3.4 South America Immunoturbidimetry Reagents Sales Breakdown by Application (2018-2023)
- 4.3.5 Middle East and Africa Immunoturbidimetry Reagents Sales Breakdown by Application (2018-2023)
5 North America Immunoturbidimetry Reagents by Country
- 5.1 North America Immunoturbidimetry Reagents Historic Market Size by Country
- 5.1.1 North America Immunoturbidimetry Reagents Market Size Growth Rate (CAGR) by Country: 2018 VS 2022 VS 2029
- 5.1.2 North America Immunoturbidimetry Reagents Sales in Volume by Country (2018-2023)
- 5.1.3 North America Immunoturbidimetry Reagents Sales in Value by Country (2018-2023)
- 5.2 North America Immunoturbidimetry Reagents Forecasted Market Size by Country
- 5.2.1 North America Immunoturbidimetry Reagents Sales in Volume by Country (2024-2029)
- 5.2.2 North America Immunoturbidimetry Reagents Sales in Value by Country (2024-2029)
6 Europe Immunoturbidimetry Reagents by Country
- 6.1 Europe Immunoturbidimetry Reagents Historic Market Size by Country
- 6.1.1 Europe Immunoturbidimetry Reagents Market Size Growth Rate (CAGR) by Country: 2018 VS 2022 VS 2029
- 6.1.2 Europe Immunoturbidimetry Reagents Sales in Volume by Country (2018-2023)
- 6.1.3 Europe Immunoturbidimetry Reagents Sales in Value by Country (2018-2023)
- 6.2 Europe Immunoturbidimetry Reagents Forecasted Market Size by Country
- 6.2.1 Europe Immunoturbidimetry Reagents Sales in Volume by Country (2024-2029)
- 6.2.2 Europe Immunoturbidimetry Reagents Sales in Value by Country (2024-2029)
7 Asia-Pacific Immunoturbidimetry Reagents by Region
- 7.1 Asia-Pacific Immunoturbidimetry Reagents Historic Market Size by Region
- 7.1.1 Asia-Pacific Immunoturbidimetry Reagents Market Size Growth Rate (CAGR) by Region: 2018 VS 2022 VS 2029
- 7.1.2 Asia-Pacific Immunoturbidimetry Reagents Sales in Volume by Region (2018-2023)
- 7.1.3 Asia-Pacific Immunoturbidimetry Reagents Sales in Value by Region (2018-2023)
- 7.2 Asia-Pacific Immunoturbidimetry Reagents Forecasted Market Size by Region
- 7.2.1 Asia-Pacific Immunoturbidimetry Reagents Sales in Volume by Region (2024-2029)
- 7.2.2 Asia-Pacific Immunoturbidimetry Reagents Sales in Value by Region (2024-2029)
8 South America Immunoturbidimetry Reagents by Country
- 8.1 South America Immunoturbidimetry Reagents Historic Market Size by Country
- 8.1.1 South America Immunoturbidimetry Reagents Market Size Growth Rate (CAGR) by Country: 2018 VS 2022 VS 2029
- 8.1.2 South America Immunoturbidimetry Reagents Sales in Volume by Country (2018-2023)
- 8.1.3 South America Immunoturbidimetry Reagents Sales in Value by Country (2018-2023)
- 8.2 South America Immunoturbidimetry Reagents Forecasted Market Size by Country
- 8.2.1 South America Immunoturbidimetry Reagents Sales in Volume by Country (2024-2029)
- 8.2.2 South America Immunoturbidimetry Reagents Sales in Value by Country (2024-2029)
9 Middle East and Africa Immunoturbidimetry Reagents by Country
- 9.1 Middle East and Africa Immunoturbidimetry Reagents Historic Market Size by Country
- 9.1.1 Middle East and Africa Immunoturbidimetry Reagents Market Size Growth Rate (CAGR) by Country: 2018 VS 2022 VS 2029
- 9.1.2 Middle East and Africa Immunoturbidimetry Reagents Sales in Volume by Country (2018-2023)
- 9.1.3 Middle East and Africa Immunoturbidimetry Reagents Sales in Value by Country (2018-2023)
- 9.2 Middle East and Africa Immunoturbidimetry Reagents Forecasted Market Size by Country
- 9.2.1 Middle East and Africa Immunoturbidimetry Reagents Sales in Volume by Country (2024-2029)
- 9.2.2 Middle East and Africa Immunoturbidimetry Reagents Sales in Value by Country (2024-2029)
10 Company Profiles
- 10.1 DANAHER
- 10.1.1 DANAHER Company Information
- 10.1.2 DANAHER Introduction and Business Overview
- 10.1.3 DANAHER Immunoturbidimetry Reagents Sales, Revenue and Gross Margin (2019-2022)
- 10.1.4 DANAHER Immunoturbidimetry Reagents Products Offered
- 10.2 Roche
- 10.2.1 Roche Company Information
- 10.2.2 Roche Introduction and Business Overview
- 10.2.3 Roche Immunoturbidimetry Reagents Sales, Revenue and Gross Margin (2019-2022)
- 10.2.4 Roche Immunoturbidimetry Reagents Products Offered
- 10.3 Siemens Healthcare
- 10.3.1 Siemens Healthcare Company Information
- 10.3.2 Siemens Healthcare Introduction and Business Overview
- 10.3.3 Siemens Healthcare Immunoturbidimetry Reagents Sales, Revenue and Gross Margin (2019-2022)
- 10.3.4 Siemens Healthcare Immunoturbidimetry Reagents Products Offered
- 10.4 Abbott
- 10.4.1 Abbott Company Information
- 10.4.2 Abbott Introduction and Business Overview
- 10.4.3 Abbott Immunoturbidimetry Reagents Sales, Revenue and Gross Margin (2019-2022)
- 10.4.4 Abbott Immunoturbidimetry Reagents Products Offered
- 10.5 Mindray Medical
- 10.5.1 Mindray Medical Company Information
- 10.5.2 Mindray Medical Introduction and Business Overview
- 10.5.3 Mindray Medical Immunoturbidimetry Reagents Sales, Revenue and Gross Margin (2019-2022)
- 10.5.4 Mindray Medical Immunoturbidimetry Reagents Products Offered
- 10.6 Beijing Strong Biotechnologies, Inc
- 10.6.1 Beijing Strong Biotechnologies, Inc Company Information
- 10.6.2 Beijing Strong Biotechnologies, Inc Introduction and Business Overview
- 10.6.3 Beijing Strong Biotechnologies, Inc Immunoturbidimetry Reagents Sales, Revenue and Gross Margin (2019-2022)
- 10.6.4 Beijing Strong Biotechnologies, Inc Immunoturbidimetry Reagents Products Offered
- 10.7 FUJIFILM
- 10.7.1 FUJIFILM Company Information
- 10.7.2 FUJIFILM Introduction and Business Overview
- 10.7.3 FUJIFILM Immunoturbidimetry Reagents Sales, Revenue and Gross Margin (2019-2022)
- 10.7.4 FUJIFILM Immunoturbidimetry Reagents Products Offered
- 10.8 Randox Laboratories
- 10.8.1 Randox Laboratories Company Information
- 10.8.2 Randox Laboratories Introduction and Business Overview
- 10.8.3 Randox Laboratories Immunoturbidimetry Reagents Sales, Revenue and Gross Margin (2019-2022)
- 10.8.4 Randox Laboratories Immunoturbidimetry Reagents Products Offered
- 10.9 Medicalsystem Biotechnology
- 10.9.1 Medicalsystem Biotechnology Company Information
- 10.9.2 Medicalsystem Biotechnology Introduction and Business Overview
- 10.9.3 Medicalsystem Biotechnology Immunoturbidimetry Reagents Sales, Revenue and Gross Margin (2019-2022)
- 10.9.4 Medicalsystem Biotechnology Immunoturbidimetry Reagents Products Offered
- 10.10 Shanghai Kehua Bio-Engineering
- 10.10.1 Shanghai Kehua Bio-Engineering Company Information
- 10.10.2 Shanghai Kehua Bio-Engineering Introduction and Business Overview
- 10.10.3 Shanghai Kehua Bio-Engineering Immunoturbidimetry Reagents Sales, Revenue and Gross Margin (2019-2022)
- 10.10.4 Shanghai Kehua Bio-Engineering Immunoturbidimetry Reagents Products Offered
- 10.11 Maccura Biotechnology
- 10.11.1 Maccura Biotechnology Company Information
- 10.11.2 Maccura Biotechnology Introduction and Business Overview
- 10.11.3 Maccura Biotechnology Immunoturbidimetry Reagents Sales, Revenue and Gross Margin (2019-2022)
- 10.11.4 Maccura Biotechnology Immunoturbidimetry Reagents Products Offered
- 10.12 NITTOBO MEDICAL
- 10.12.1 NITTOBO MEDICAL Company Information
- 10.12.2 NITTOBO MEDICAL Introduction and Business Overview
- 10.12.3 NITTOBO MEDICAL Immunoturbidimetry Reagents Sales, Revenue and Gross Margin (2019-2022)
- 10.12.4 NITTOBO MEDICAL Immunoturbidimetry Reagents Products Offered
- 10.13 Beijing Leadman Biochemistry
- 10.13.1 Beijing Leadman Biochemistry Company Information
- 10.13.2 Beijing Leadman Biochemistry Introduction and Business Overview
- 10.13.3 Beijing Leadman Biochemistry Immunoturbidimetry Reagents Sales, Revenue and Gross Margin (2019-2022)
- 10.13.4 Beijing Leadman Biochemistry Immunoturbidimetry Reagents Products Offered
- 10.14 Sentinel Diagnostics
- 10.14.1 Sentinel Diagnostics Company Information
- 10.14.2 Sentinel Diagnostics Introduction and Business Overview
- 10.14.3 Sentinel Diagnostics Immunoturbidimetry Reagents Sales, Revenue and Gross Margin (2019-2022)
- 10.14.4 Sentinel Diagnostics Immunoturbidimetry Reagents Products Offered
- 10.15 Erba Mannheim
- 10.15.1 Erba Mannheim Company Information
- 10.15.2 Erba Mannheim Introduction and Business Overview
- 10.15.3 Erba Mannheim Immunoturbidimetry Reagents Sales, Revenue and Gross Margin (2019-2022)
- 10.15.4 Erba Mannheim Immunoturbidimetry Reagents Products Offered
- 10.16 DIRUI
- 10.16.1 DIRUI Company Information
- 10.16.2 DIRUI Introduction and Business Overview
- 10.16.3 DIRUI Immunoturbidimetry Reagents Sales, Revenue and Gross Margin (2019-2022)
- 10.16.4 DIRUI Immunoturbidimetry Reagents Products Offered
- 10.17 DIALAB GmbH
- 10.17.1 DIALAB GmbH Company Information
- 10.17.2 DIALAB GmbH Introduction and Business Overview
- 10.17.3 DIALAB GmbH Immunoturbidimetry Reagents Sales, Revenue and Gross Margin (2019-2022)
- 10.17.4 DIALAB GmbH Immunoturbidimetry Reagents Products Offered
- 10.18 DiaSys Diagnostic Systems
- 10.18.1 DiaSys Diagnostic Systems Company Information
- 10.18.2 DiaSys Diagnostic Systems Introduction and Business Overview
- 10.18.3 DiaSys Diagnostic Systems Immunoturbidimetry Reagents Sales, Revenue and Gross Margin (2019-2022)
- 10.18.4 DiaSys Diagnostic Systems Immunoturbidimetry Reagents Products Offered
11 Upstream, Opportunities, Challenges, Risks and Influences Factors Analysis
- 11.1 Immunoturbidimetry Reagents Key Raw Materials
- 11.1.1 Key Raw Materials
- 11.1.2 Raw Materials Key Suppliers
- 11.2 Manufacturing Cost Structure
- 11.2.1 Raw Materials
- 11.2.2 Labor Cost
- 11.2.3 Manufacturing Expenses
- 11.3 Immunoturbidimetry Reagents Industrial Chain Analysis
- 11.4 Immunoturbidimetry Reagents Market Dynamics
- 11.4.1 Immunoturbidimetry Reagents Industry Trends
- 11.4.2 Immunoturbidimetry Reagents Market Drivers
- 11.4.3 Immunoturbidimetry Reagents Market Restraints
12 Marketing Strategy Analysis, Distributors
- 12.1 Sales Channel
- 12.2 Immunoturbidimetry Reagents Distributors
- 12.3 Immunoturbidimetry Reagents Downstream Customers
13 Research Findings and Conclusion
14 Appendix
- 14.1 Research Methodology
- 14.1.1 Methodology/Research Approach
- 14.1.2 Data Source
- 14.2 Author Details
- 14.3 Disclaimer

