|
|
市場調査レポート
商品コード
1358907
デジタルキーモジュールの世界市場:2029年までの予測Global Digital Key Modules Market Insights, Forecast to 2029 |
||||||
|
|
|||||||
カスタマイズ可能
適宜更新あり
|
|||||||


| デジタルキーモジュールの世界市場:2029年までの予測 |
|
出版日: 2023年10月10日
発行: QYResearch
ページ情報: 英文 190 Pages
納期: 2~3営業日
|

- 全表示
- 概要
- 図表
- 目次
デジタルキーモジュール市場は過去数年間継続的な成長を遂げています。
世界のデジタルキーモジュールの市場規模は、2029年までに約5億1,492万米ドルに達すると予測されています。同市場は、2023年~2029年の予測期間に、11.52%のCAGRで拡大すると予測されています。この拡大は、パンデミックからの経済回復と自動車産業の発展による需要増に起因しています。
欧州は2022年に金額ベースで32%を占め、最大の消費市場シェアを占めました。次いでアジア(中国を除く)、北米、中国と続きます。
デジタルキーモジュール業界では、市場の集中度は低いです。Continental、Bosch、Valeo、Fin Dreams Technology、Hellaなどが世界の主要企業です。主要企業10社は、2022年の市場の約72%を占めています。
当レポートでは、世界のデジタルキーモジュール市場について調査し、市場の概要とともに、企業別、タイプ別、用途別、地域別の動向、および市場に参入する企業のプロファイルなどを提供しています。
目次
第1章 調査範囲
- デジタルキーモジュールの製品イントロダクション
- タイプ別市場
- 用途別市場
- 前提と制限
- 調査目的
- 対象年
第2章 世界デジタルキーモジュールの生産
- 世界のデジタルキーモジュールの生産(2018年~2029年)
- 世界のデジタルキーモジュールの地域別生産:2018年 VS 2022年 VS 2029年、生産サイト別
- 地域別の世界のデジタルキーモジュール生産量
- 北米
- 欧州
- 中国
- アジア太平洋その他
第3章 エグゼクティブサマリー
第4章 メーカーによる競合
第5章 市場規模、タイプ別
- 世界のデジタルキーモジュールの売上、タイプ別
- 世界のデジタルキーモジュールの収益、タイプ別
- 世界のデジタルキーモジュールの価格、タイプ別
第6章 市場規模、用途別
- 世界のデジタルキーモジュールの売上、用途別
- 世界のデジタルキーモジュールの収益、用途別
- 世界のデジタルキーモジュールの価格、用途別
第7章 米国・カナダ
第8章 欧州
第9章 中国
第10章 アジア(中国を除く)
第11章 中東・アフリカ、ラテンアメリカ
第12章 会社概要
- Continental
- Bosch
- Valeo
- Fin Dreams Technology
- Hella
- Huf Group
- INGEEK
- OpenKey
- Pektron
- TsingCar
- Danalock
- Yuanfeng Technology
- LG Innotek
第13章 産業チェーンと販売チャネルの分析
- デジタルキーモジュールの産業チェーン分析
- デジタルキーモジュールの主要原材料
- デジタルキーモジュールの製造モードとプロセス
- デジタルキーモジュールの販売およびマーケティング
- デジタルキーモジュールの顧客
第14章 デジタルキーモジュールの市場力学
- デジタルキーモジュールの業界動向
- デジタルキーモジュール市場の促進要因
- デジタルキーモジュール市場の課題
- デジタルキーモジュール市場の抑制要因
第15章 世界のデジタルキーモジュール調査の主な調査結果
第16章 付録
List of Tables
- Table 1. Global Digital Key Modules Market Size Growth Rate by Type, 2018 VS 2022 VS 2029 (US$ Million)
- Table 2. Key Manufacturers of UWB
- Table 3. Key Manufacturers of NFC
- Table 4. Global Digital Key Modules Market Size Growth Rate by Application, 2018 VS 2022 VS 2029 (US$ Million)
- Table 5. Global Digital Key Modules Production Growth Rate (CAGR) by Region: 2018 VS 2022 VS 2029 (K Units)
- Table 6. Global Digital Key Modules Production by Region (2018-2023) & (K Units)
- Table 7. Global Digital Key Modules Production by Region (2024-2029) & (K Units)
- Table 8. Global Digital Key Modules Production Market Share by Region (2018-2023)
- Table 9. Global Digital Key Modules Production Market Share by Region (2024-2029)
- Table 10. Global Digital Key Modules Revenue Grow Rate (CAGR) by Region: 2018 VS 2022 VS 2029 (US$ Million)
- Table 11. Global Digital Key Modules Revenue by Region (2018-2023) & (US$ Million)
- Table 12. Global Digital Key Modules Revenue by Region (2024-2029) & (US$ Million)
- Table 13. Global Digital Key Modules Revenue Market Share by Region (2018-2023)
- Table 14. Global Digital Key Modules Revenue Market Share by Region (2024-2029)
- Table 15. Global Digital Key Modules Sales Grow Rate (CAGR) by Region: 2018 VS 2022 VS 2029 (K Units)
- Table 16. Global Digital Key Modules Sales by Region (2018-2023) & (K Units)
- Table 17. Global Digital Key Modules Sales by Region (2024-2029) & (K Units)
- Table 18. Global Digital Key Modules Sales Market Share by Region (2018-2023)
- Table 19. Global Digital Key Modules Sales Market Share by Region (2024-2029)
- Table 20. Global Digital Key Modules Sales by Manufacturers (2018-2023) & (K Units)
- Table 21. Global Digital Key Modules Sales Share by Manufacturers (2018-2023)
- Table 22. Global Digital Key Modules Revenue by Manufacturers (2018-2023) & (US$ Million)
- Table 23. Global Digital Key Modules Revenue Market Share by Manufacturers (2018-2023)
- Table 24. Digital Key Modules Price by Manufacturers (2018-2023) & (US$/Unit)
- Table 25. Global Key Players of Digital Key Modules, Industry Ranking, 2021 VS 2022
- Table 26. Global Digital Key Modules Manufacturers Market Concentration Ratio (CR5)
- Table 27. Global Digital Key Modules by Company Type (Tier 1, Tier 2, and Tier 3) & (based on the Revenue in Digital Key Modules as of 2022)
- Table 28. Global Key Manufacturers of Digital Key Modules, Major Market Areas and Headquarters
- Table 29. Global Key Manufacturers of Digital Key Modules, Product Offered and Application
- Table 30. Global Key Manufacturers of Digital Key Modules, Date of Enter into This Industry
- Table 31. Mergers & Acquisitions, Expansion Plans
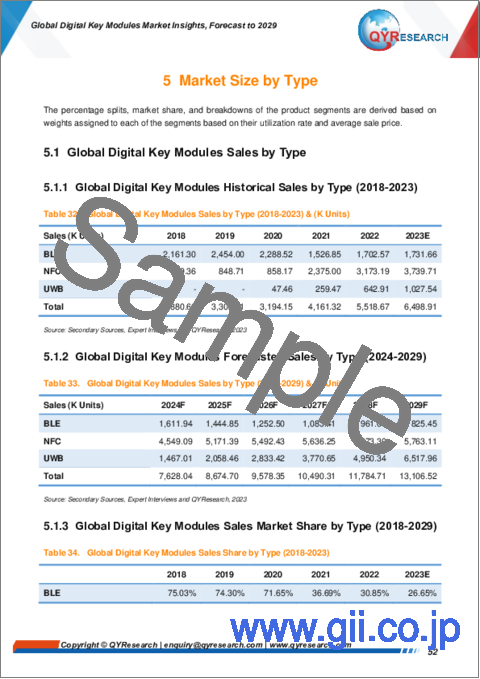
- Table 32. Global Digital Key Modules Sales by Type (2018-2023) & (K Units)
- Table 33. Global Digital Key Modules Sales by Type (2024-2029) & (K Units)
- Table 34. Global Digital Key Modules Sales Share by Type (2018-2023)
- Table 35. Global Digital Key Modules Sales Share by Type (2024-2029)
- Table 36. Global Digital Key Modules Revenue by Type (2018-2023) & (US$ Million)
- Table 37. Global Digital Key Modules Revenue by Type (2024-2029) & (US$ Million)
- Table 38. Global Digital Key Modules Revenue Share by Type (2018-2023)
- Table 39. Global Digital Key Modules Revenue Share by Type (2024-2029)
- Table 40. Digital Key Modules Price by Type (2018-2023) & (US$/Unit)
- Table 41. Global Digital Key Modules Price Forecast by Type (2024-2029) & (US$/Unit)
- Table 42. Global Digital Key Modules Sales by Application (2018-2023) & (K Units)
- Table 43. Global Digital Key Modules Sales by Application (2024-2029) & (K Units)
- Table 44. Global Digital Key Modules Sales Share by Application (2018-2023)
- Table 45. Global Digital Key Modules Sales Share by Application (2024-2029)
- Table 46. Global Digital Key Modules Revenue by Application (2018-2023) & (US$ Million)
- Table 47. Global Digital Key Modules Revenue by Application (2024-2029) & (US$ Million)
- Table 48. Global Digital Key Modules Revenue Share by Application (2018-2023)
- Table 49. Global Digital Key Modules Revenue Share by Application (2024-2029)
- Table 50. Digital Key Modules Price by Application (2018-2023) & (US$/Unit)
- Table 51. Global Digital Key Modules Price Forecast by Application (2024-2029) & (US$/Unit)
- Table 52. US & Canada Digital Key Modules Sales by Type (2018-2023) & (K Units)
- Table 53. US & Canada Digital Key Modules Sales by Type (2024-2029) & (K Units)
- Table 54. US & Canada Digital Key Modules Revenue by Type (2018-2023) & (US$ Million)
- Table 55. US & Canada Digital Key Modules Revenue by Type (2024-2029) & (US$ Million)
- Table 56. US & Canada Digital Key Modules Sales by Application (2018-2023) & (K Units)
- Table 57. US & Canada Digital Key Modules Sales by Application (2024-2029) & (K Units)
- Table 58. US & Canada Digital Key Modules Revenue by Application (2018-2023) & (US$ Million)
- Table 59. US & Canada Digital Key Modules Revenue by Application (2024-2029) & (US$ Million)
- Table 60. US & Canada Digital Key Modules Revenue Grow Rate (CAGR) by Country: 2018 VS 2022 VS 2029 (US$ Million)
- Table 61. US & Canada Digital Key Modules Sales by Country (2018-2023) & (K Units)
- Table 62. US & Canada Digital Key Modules Sales by Country (2024-2029) & (K Units)
- Table 63. US & Canada Digital Key Modules Revenue by Country (2018-2023) & (M USD)
- Table 64. US & Canada Digital Key Modules Revenue by Country (2024-2029) & (M USD)
- Table 65. Europe Digital Key Modules Sales by Type (2018-2023) & (K Units)
- Table 66. Europe Digital Key Modules Sales by Type (2024-2029) & (K Units)
- Table 67. Europe Digital Key Modules Revenue by Type (2018-2023) & (US$ Million)
- Table 68. Europe Digital Key Modules Revenue by Type (2024-2029) & (US$ Million)
- Table 69. Europe Digital Key Modules Sales by Application (2018-2023) & (K Units)
- Table 70. Europe Digital Key Modules Sales by Application (2024-2029) & (K Units)
- Table 71. Europe Digital Key Modules Revenue by Application (2018-2023) & (US$ Million)
- Table 72. Europe Digital Key Modules Revenue by Application (2024-2029) & (US$ Million)
- Table 73. Europe Digital Key Modules Revenue Grow Rate (CAGR) by Country: 2018 VS 2022 VS 2029 (US$ Million)
- Table 74. Europe Digital Key Modules Sales by Country (2018-2023) & (K Units)
- Table 75. Europe Digital Key Modules Sales by Country (2024-2029) & (K Units)
- Table 76. Europe Digital Key Modules Revenue by Country (2018-2023) & (US$ Million)
- Table 77. Europe Digital Key Modules Revenue by Country (2024-2029) & (US$ Million)
- Table 78. China Digital Key Modules Sales by Type (2018-2023) & (K Units)
- Table 79. China Digital Key Modules Sales by Type (2024-2029) & (K Units)
- Table 80. China Digital Key Modules Revenue by Type (2018-2023) & (US$ Million)
- Table 81. China Digital Key Modules Revenue by Type (2024-2029) & (US$ Million)
- Table 82. China Digital Key Modules Sales by Application (2018-2023) & (K Units)
- Table 83. China Digital Key Modules Sales by Application (2024-2029) & (K Units)
- Table 84. China Digital Key Modules Revenue by Application (2018-2023) & (US$ Million)
- Table 85. China Digital Key Modules Revenue by Application (2024-2029) & (US$ Million)
- Table 86. Asia Digital Key Modules Sales by Type (2018-2023) & (K Units)
- Table 87. Asia Digital Key Modules Sales by Type (2024-2029) & (K Units)
- Table 88. Asia Digital Key Modules Revenue by Type (2018-2023) & (US$ Million)
- Table 89. Asia Digital Key Modules Revenue by Type (2024-2029) & (US$ Million)
- Table 90. Asia Digital Key Modules Sales by Application (2018-2023) & (K Units)
- Table 91. Asia Digital Key Modules Sales by Application (2024-2029) & (K Units)
- Table 92. Asia Digital Key Modules Revenue by Application (2018-2023) & (US$ Million)
- Table 93. Asia Digital Key Modules Revenue by Application (2024-2029) & (US$ Million)
- Table 94. Asia Digital Key Modules Revenue Grow Rate (CAGR) by Region: 2018 VS 2022 VS 2029 (US$ Million)
- Table 95. Asia Digital Key Modules Sales by Region (2018-2023) & (K Units)
- Table 96. Asia Digital Key Modules Sales by Region (2024-2029) & (K Units)
- Table 97. Asia Digital Key Modules Revenue by Region (2018-2023) & (M USD)
- Table 98. Asia Digital Key Modules Revenue by Region (2024-2029) & (M USD)
- Table 99. Middle East, Africa and Latin America Digital Key Modules Sales by Type (2018-2023) & (K Units)
- Table 100. Middle East, Africa and Latin America Digital Key Modules Sales by Type (2024-2029) & (K Units)
- Table 101. Middle East, Africa and Latin America Digital Key Modules Revenue by Type (2018-2023) & (US$ Million)
- Table 102. Middle East, Africa and Latin America Digital Key Modules Revenue by Type (2024-2029) & (US$ Million)
- Table 103. Middle East, Africa and Latin America Digital Key Modules Sales by Application (2018-2023) & (K Units)
- Table 104. Middle East, Africa and Latin America Digital Key Modules Sales by Application (2024-2029) & (K Units)
- Table 105. Middle East, Africa and Latin America Digital Key Modules Revenue by Application (2018-2023) & (US$ Million)
- Table 106. Middle East, Africa and Latin America Digital Key Modules Revenue by Application (2024-2029) & (US$ Million)
- Table 107. Middle East, Africa and Latin America Digital Key Modules Revenue Grow Rate (CAGR) by Country: 2018 VS 2022 VS 2029 (US$ Million)
- Table 108. Middle East, Africa and Latin America Digital Key Modules Sales by Country (2018-2023) & (K Units)
- Table 109. Middle East, Africa and Latin America Digital Key Modules Sales by Country (2024-2029) & (K Units)
- Table 110. Middle East, Africa and Latin America Digital Key Modules Revenue by Country (2018-2023) & (M USD)
- Table 111. Middle East, Africa and Latin America Digital Key Modules Revenue by Country (2024-2029) & (M USD)
- Table 112. Continental Corporation Information
- Table 113.
- Table 114. Continental Description and Major Businesses
- Table 115. Continental Digital Key Modules Sales (K Units), Revenue (US$ Million), Price (US$/Unit) and Gross Margin (2018-2023)
- Table 116. Continental Digital Key Modules Product Model Numbers, Pictures, Descriptions and Specifications
- Table 117. Continental Recent Developments
- Table 118. Bosch Corporation Information
- Table 119. Bosch Description and Major Businesses
- Table 120. Bosch Digital Key Modules Sales (K Units), Revenue (US$ Million), Price (US$/Unit) and Gross Margin (2018-2023)
- Table 121. Bosch Digital Key Modules Product Model Numbers, Pictures, Descriptions and Specifications
- Table 122. Valeo Corporation Information
- Table 123. Valeo Description and Major Businesses
- Table 124. Valeo Digital Key Modules Sales (K Units), Revenue (US$ Million), Price (US$/Unit) and Gross Margin (2018-2023)
- Table 125. Valeo Digital Key Modules Product Model Numbers, Pictures, Descriptions and Specifications
- Table 126. Fin Dreams Technology Corporation Information
- Table 127. Fin Dreams Technology Description and Major Businesses
- Table 128. Fin Dreams Technology Digital Key Modules Sales (K Units), Revenue (US$ Million), Price (US$/Unit) and Gross Margin (2018-2023)
- Table 129. Fin Dreams Technology Digital Key Modules Product Model Numbers, Pictures, Descriptions and Specifications
- Table 130. Hella Corporation Information
- Table 131. Hella Description and Major Businesses
- Table 132. Hella Digital Key Modules Sales (K Units), Revenue (US$ Million), Price (US$/Unit) and Gross Margin (2018-2023)
- Table 133. Hella Digital Key Modules Product Model Numbers, Pictures, Descriptions and Specifications
- Table 134. Huf Group Corporation Information
- Table 135. Huf Group Description and Major Businesses
- Table 136. Huf Group Digital Key Modules Sales (K Units), Revenue (US$ Million), Price (US$/Unit) and Gross Margin (2018-2023)
- Table 137. Huf Group Digital Key Modules Product Model Numbers, Pictures, Descriptions and Specifications
- Table 138. Huf Group Recent Developments
- Table 139. INGEEK Corporation Information
- Table 140. INGEEK Description and Major Businesses
- Table 141. INGEEK Digital Key Modules Sales (K Units), Revenue (US$ Million), Price (US$/Unit) and Gross Margin (2018-2023)
- Table 142. INGEEK Digital Key Modules Product Model Numbers, Pictures, Descriptions and Specifications
- Table 143. OpenKey Corporation Information
- Table 144. OpenKey Description and Major Businesses
- Table 145. OpenKey Digital Key Modules Sales (K Units), Revenue (US$ Million), Price (US$/Unit) and Gross Margin (2018-2023)
- Table 146. OpenKey Digital Key Modules Product Model Numbers, Pictures, Descriptions and Specifications
- Table 147. OpenKey Recent Developments
- Table 148. Pektron Corporation Information
- Table 149. Pektron Description and Major Businesses
- Table 150. Pektron Digital Key Modules Sales (K Units), Revenue (US$ Million), Price (US$/Unit) and Gross Margin (2018-2023)
- Table 151. Pektron Digital Key Modules Product Model Numbers, Pictures, Descriptions and Specifications
- Table 152. Pektron Recent Developments
- Table 153. TsingCar Corporation Information
- Table 154. TsingCar Description and Major Businesses
- Table 155. TsingCar Digital Key Modules Sales (K Units), Revenue (US$ Million), Price (US$/Unit) and Gross Margin (2018-2023)
- Table 156. TsingCar Digital Key Modules Product Model Numbers, Pictures, Descriptions and Specifications
- Table 157. TsingCar Recent Developments
- Table 158. Danalock Corporation Information
- Table 159. Danalock Description and Major Businesses
- Table 160. Danalock Digital Key Modules Sales (K Units), Revenue (US$ Million), Price (US$/Unit) and Gross Margin (2018-2023)
- Table 161. Danalock Digital Key Modules Product Model Numbers, Pictures, Descriptions and Specifications
- Table 162. Yuanfeng Technology Corporation Information
- Table 163. Yuanfeng Technology Description and Major Businesses
- Table 164. Yuanfeng Technology Digital Key Modules Sales (K Units), Revenue (US$ Million), Price (US$/Unit) and Gross Margin (2018-2023)
- Table 165. Yuanfeng Technology Digital Key Modules Product Model Numbers, Pictures, Descriptions and Specifications
- Table 166. Yuanfeng Technology Recent Developments
- Table 167. LG Innotek Corporation Information
- Table 168. LG Innotek Description and Major Businesses
- Table 169. LG Innotek Digital Key Modules Sales (K Units), Revenue (US$ Million), Price (US$/Unit) and Gross Margin (2018-2023)
- Table 170. LG Innotek Digital Key Modules Product Model Numbers, Pictures, Descriptions and Specifications
- Table 171. LG Innotek Recent Developments
- Table 172. Key Raw Materials Lists
- Table 173. Raw Materials Key Suppliers Lists
- Table 174. Digital Key Modules Distributors List
- Table 175. Digital Key Modules Customers List
- Table 176. Digital Key Modules Market Trends
- Table 177. Digital Key Modules Market Drivers
- Table 178. Digital Key Modules Market Challenges
- Table 179. Digital Key Modules Market Restraints
- Table 180. Research Programs/Design for This Report
- Table 181. Key Data Information from Secondary Sources
- Table 182. Key Data Information from Primary Sources
- Table 183. QYR Business Unit and Senior & Team Lead Analysts
List of Figures
- Figure 1. Digital Key Modules Product Picture
- Figure 2. Global Digital Key Modules Market Size Growth Rate by Type, 2018 VS 2022 VS 2029 (US$ Million)
- Figure 3. Global Digital Key Modules Market Share by Type: 2022 & 2029
- Figure 4. BLE Product Picture
- Figure 5. Key Manufacturers of BLE
- Figure 6. UWB Product Picture
- Figure 7. NFC Product Picture
- Figure 8. Global Digital Key Modules Market Size Growth Rate by Application, 2018 VS 2022 VS 2029 (US$ Million)
- Figure 9. Global Digital Key Modules Market Share by Application in 2022 & 2029
- Figure 10. Automotive
- Figure 11. Hotel
- Figure 12. Household
- Figure 13. Digital Key Modules Report Years Considered
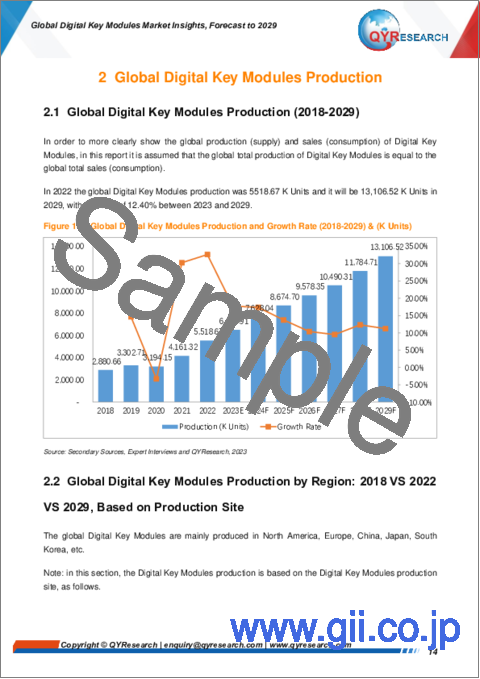
- Figure 14. Global Digital Key Modules Production and Growth Rate (2018-2029) & (K Units)
- Figure 15. Global Digital Key Modules Production by Region: 2018 VS 2022 VS 2029 (K Units)
- Figure 16. Global Digital Key Modules Production Market Share by Region in Percentage: 2022 Versus 2029
- Figure 17. Global Digital Key Modules Production Market Share by Region (2018-2029)
- Figure 18. Digital Key Modules Production Growth Rate in North America (2018-2029) & (K Units)
- Figure 19. Digital Key Modules Production Growth Rate in Europe (2018-2029) & (K Units)
- Figure 20. Digital Key Modules Production Growth Rate in China (2018-2029) & (K Units)
- Figure 21. Digital Key Modules Production Growth Rate in Asia-Pacific Other (2018-2029) & (K Units)
- Figure 22. Global Digital Key Modules Revenue, (US$ Million), 2018 VS 2022 VS 2029
- Figure 23. Global Digital Key Modules Revenue 2018-2029 (US$ Million)
- Figure 24. Global Digital Key Modules Revenue (CAGR) by Region: 2018 VS 2022 VS 2029 (US$ Million)
- Figure 25. Global Digital Key Modules Revenue Market Share by Region in Percentage: 2022 Versus 2029
- Figure 26. Global Digital Key Modules Revenue Market Share by Region (2018-2029)
- Figure 27. Global Digital Key Modules Sales 2018-2029 (K Units)
- Figure 28. Global Digital Key Modules Sales (CAGR) by Region: 2018 VS 2022 VS 2029 (K Units)
- Figure 29. Global Digital Key Modules Sales Market Share by Region (2018-2029)
- Figure 30. US & Canada Digital Key Modules Sales YoY (2018-2029) & (K Units)
- Figure 31. US & Canada Digital Key Modules Revenue YoY (2018-2029) & (US$ Million)
- Figure 32. Europe Digital Key Modules Sales YoY (2018-2029) & (K Units)
- Figure 33. Europe Digital Key Modules Revenue YoY (2018-2029) & (US$ Million)
- Figure 34. China Digital Key Modules Sales YoY (2018-2029) & (K Units)
- Figure 35. China Digital Key Modules Revenue YoY (2018-2029) & (US$ Million)
- Figure 36. Asia (excluding China) Digital Key Modules Sales YoY (2018-2029) & (K Units)
- Figure 37. Asia (excluding China) Digital Key Modules Revenue YoY (2018-2029) & (US$ Million)
- Figure 38. Middle East, Africa and Latin America Digital Key Modules Sales YoY (2018-2029) & (K Units)
- Figure 39. Middle East, Africa and Latin America Digital Key Modules Revenue YoY (2018-2029) & (US$ Million)
- Figure 40. The Digital Key Modules Market Share of Top 10 and Top 5 Largest Manufacturers Around the World in 2022
- Figure 41. The Top 5 and 10 Largest Manufacturers of Digital Key Modules in the World: Market Share by Digital Key Modules Revenue in 2022
- Figure 42. Global Digital Key Modules Market Share by Company Type (Tier 1, Tier 2, and Tier 3): 2022
- Figure 43. Global Digital Key Modules Sales Market Share by Type (2018-2029)
- Figure 44. Global Digital Key Modules Revenue Market Share by Type (2018-2029)
- Figure 45. Global Digital Key Modules Sales Market Share by Application (2018-2029)
- Figure 46. Global Digital Key Modules Revenue Market Share by Application (2018-2029)
- Figure 47. US & Canada Digital Key Modules Sales Market Share by Type (2018-2029)
- Figure 48. US & Canada Digital Key Modules Revenue Market Share by Type (2018-2029)
- Figure 49. US & Canada Digital Key Modules Sales Market Share by Application (2018-2029)
- Figure 50. US & Canada Digital Key Modules Revenue Market Share by Application (2018-2029)
- Figure 51. US & Canada Digital Key Modules Sales Share by Country (2018-2029)
- Figure 52. US & Canada Digital Key Modules Revenue Share by Country (2018-2029)
- Figure 53. US Digital Key Modules Revenue (2018-2029) & (US$ Million)
- Figure 54. Canada Digital Key Modules Revenue (2018-2029) & (US$ Million)
- Figure 55. Europe Digital Key Modules Sales Market Share by Type (2018-2029)
- Figure 56. Europe Digital Key Modules Revenue Market Share by Type (2018-2029)
- Figure 57. Europe Digital Key Modules Sales Market Share by Application (2018-2029)
- Figure 58. Europe Digital Key Modules Revenue Market Share by Application (2018-2029)
- Figure 59. Europe Digital Key Modules Sales Share by Country (2018-2029)
- Figure 60. Europe Digital Key Modules Revenue Share by Country (2018-2029)
- Figure 61. Germany Digital Key Modules Revenue (2018-2029) & (US$ Million)
- Figure 62. France Digital Key Modules Revenue (2018-2029) & (US$ Million)
- Figure 63. U.K. Digital Key Modules Revenue (2018-2029) & (US$ Million)
- Figure 64. Italy Digital Key Modules Revenue (2018-2029) & (US$ Million)
- Figure 65. Russia Digital Key Modules Revenue (2018-2029) & (US$ Million)
- Figure 66. China Digital Key Modules Sales Market Share by Type (2018-2029)
- Figure 67. China Digital Key Modules Revenue Market Share by Type (2018-2029)
- Figure 68. China Digital Key Modules Sales Market Share by Application (2018-2029)
- Figure 69. China Digital Key Modules Revenue Market Share by Application (2018-2029)
- Figure 70. Asia Digital Key Modules Sales Market Share by Type (2018-2029)
- Figure 71. Asia Digital Key Modules Revenue Market Share by Type (2018-2029)
- Figure 72. Asia Digital Key Modules Sales Market Share by Application (2018-2029)
- Figure 73. Asia Digital Key Modules Revenue Market Share by Application (2018-2029)
- Figure 74. Asia Digital Key Modules Sales Share by Region (2018-2029)
- Figure 75. Asia Digital Key Modules Revenue Share by Region (2018-2029)
- Figure 76. Japan Digital Key Modules Revenue (2018-2029) & (US$ Million)
- Figure 77. South Korea Digital Key Modules Revenue (2018-2029) & (US$ Million)
- Figure 78. Southeast Asia Digital Key Modules Revenue (2018-2029) & (US$ Million)
- Figure 79. India Digital Key Modules Revenue (2018-2029) & (US$ Million)
- Figure 80. Middle East, Africa and Latin America Digital Key Modules Sales Market Share by Type (2018-2029)
- Figure 81. Middle East, Africa and Latin America Digital Key Modules Revenue Market Share by Type (2018-2029)
- Figure 82. Middle East, Africa and Latin America Digital Key Modules Sales Market Share by Application (2018-2029)
- Figure 83. Middle East, Africa and Latin America Digital Key Modules Revenue Market Share by Application (2018-2029)
- Figure 84. Middle East, Africa and Latin America Digital Key Modules Sales Share by Country (2018-2029)
- Figure 85. Middle East, Africa and Latin America Digital Key Modules Revenue Share by Country (2018-2029)
- Figure 86. Brazil Digital Key Modules Revenue (2018-2029) & (US$ Million)
- Figure 87. Mexico Digital Key Modules Revenue (2018-2029) & (US$ Million)
- Figure 88. Turkey Digital Key Modules Revenue (2018-2029) & (US$ Million)
- Figure 89. GCC Countries Digital Key Modules Revenue (2018-2029) & (US$ Million)
- Figure 90. Digital Key Modules Value Chain
- Figure 91. Digital Key Modules Production Process
- Figure 92. Distributors Profiles
- Figure 93. Bottom-up and Top-down Approaches for This Report
- Figure 94. Data Triangulation
- Figure 95. Key Executives Interviewed
The Digital Key Modules market has been experiencing continual growth for the past several years. According to this research report, the global market for Digital Key Modules is expected to reach a significant valuation by the end of the year of assessment, to reflect a value of about US$ 514.92 million by 2029. The global Digital Key Modules market is projected to expand at a value CAGR of 11.52% throughout the period of assessment, 2023-2029. This expansion can be attributed to the economic recovery from the pandemic and the increasing demand due to the development of the vehicle industry.
In this study, the consumption market for Digital Key Modules was divided into five geographic regions. Europe occupied the largest consumption market share with 32% in 2022 in terms of value. It is followed by Asia (excluding China), North America and China.
For the Digital Key Modules industry, the market is low concentrated. Continental, Bosch, Valeo, Fin Dreams Technology, Hella, etc. are the leading companies globally. The top 10 players listed in the report accounted for about 72% of the market in 2022.
In terms of production side, this report researches the Digital Key Modules production, growth rate, market share by manufacturers and by region (region level and country level), from 2018 to 2023, and forecast to 2029.
In terms of consumption side, this report focuses on the sales of Digital Key Modules by region (region level and country level), by company, by Type and by Application. from 2018 to 2023 and forecast to 2029.
Report Includes:
This report presents an overview of global market for Digital Key Modules, capacity, output, revenue and price. Analyses of the global market trends, with historic market revenue/sales data for 2018 - 2022, estimates for 2023, and projections of CAGR through 2029.
This report researches the key producers of Digital Key Modules, also provides the consumption of main regions and countries. Highlights of the upcoming market potential for Digital Key Modules, and key regions/countries of focus to forecast this market into various segments and sub-segments. Country specific data and market value analysis for the U.S., Canada, Mexico, Brazil, China, Japan, South Korea, Southeast Asia, India, Germany, the U.K., Italy, Middle East, Africa, and Other Countries.
This report focuses on the Digital Key Modules sales, revenue, market share and industry ranking of main manufacturers, data from 2018 to 2023. Identification of the major stakeholders in the global Digital Key Modules market, and analysis of their competitive landscape and market positioning based on recent developments and segmental revenues. This report will help stakeholders to understand the competitive landscape and gain more insights and position their businesses and market strategies in a better way.
This report analyzes the segments data by Type and by Application, sales, revenue, and price, from 2018 to 2029. Evaluation and forecast the market size for Digital Key Modules sales, projected growth trends, production technology, application and end-user industry.
Descriptive company profiles of the major global players, including Continental, Bosch, Valeo, Fin Dreams Technology, Hella, Huf Group, INGEEK, OpenKey, and Pektron, etc.
By Company
- Continental
- Bosch
- Valeo
- Fin Dreams Technology
- Hella
- Huf Group
- INGEEK
- OpenKey
- Pektron
- TsingCar
- Danalock
- Yuanfeng Technology
- LG Innotek
Segment by Type
- BLE
- UWB
- NFC
Segment by Application
- Automotive
- Hotel
- Household
- Others
Production by Region
- North America
- Europe
- China
- Aisa-Pacific Other
Sales by Region
- US & Canada
- U.S.
- Canada
- China
- Asia (excluding China)
- Japan
- South Korea
- Southeast Asia
- India
- Europe
- Germany
- France
- U.K.
- Italy
- Russia
- Middle East, Africa, Latin America
- Brazil
- Mexico
- Turkey
- GCC Countries
Chapter Outline
Chapter 1: Introduces the report scope of the report, executive summary of different market segments (by Type and by Application, etc), including the market size of each market segment, future development potential, and so on. It offers a high-level view of the current state of the market and its likely evolution in the short to mid-term, and long term.
Chapter 2: Digital Key Modules production/output of global and key producers (regions/countries). It provides a quantitative analysis of the production, and development potential of each producer in the next six years.
Chapter 3: Sales (consumption), revenue of Digital Key Modules in global, regional level and country level. It provides a quantitative analysis of the market size and development potential of each region and its main countries and introduces the market development, future development prospects, market space of each country in the world.
Chapter 4: Detailed analysis of Digital Key Modules manufacturers competitive landscape, price, sales, revenue, market share and industry ranking, latest development plan, merger, and acquisition information, etc.
Chapter 5: Provides the analysis of various market segments by Type, covering the sales, revenue, average price, and development potential of each market segment, to help readers find the blue ocean market in different market segments.
Chapter 6: Provides the analysis of various market segments by Application, covering the sales, revenue, average price, and development potential of each market segment, to help readers find the blue ocean market in different downstream markets.
Chapter 7: North America (US & Canada) by Type, by Application and by country, sales, and revenue for each segment.
Chapter 8: Europe by Type, by Application and by country, sales, and revenue for each segment.
Chapter 9: China by Type, and by Application, sales, and revenue for each segment.
Chapter 10: Asia (excluding China) by Type, by Application and by region, sales, and revenue for each segment.
Chapter 11: Middle East, Africa, Latin America by Type, by Application and by country, sales, and revenue for each segment.
Chapter 12: Provides profiles of key manufacturers, introducing the basic situation of the main companies in the market in detail, including product descriptions and specifications, Digital Key Modules sales, revenue, price, gross margin, and recent development, etc.
Chapter 13: Analysis of industrial chain, sales channel, key raw materials, distributors and customers.
Chapter 14: Introduces the market dynamics, latest developments of the market, the driving factors and restrictive factors of the market, the challenges and risks faced by manufacturers in the industry, and the analysis of relevant policies in the industry.
Chapter 15: The main points and conclusions of the report.
Table of Contents
1 Study Coverage
- 1.1 Digital Key Modules Product Introduction
- 1.2 Market by Type
- 1.2.1 Global Digital Key Modules Market Size by Type, 2018 VS 2022 VS 2029
- 1.2.2 BLE
- 1.2.3 UWB
- 1.2.4 NFC
- 1.3 Market by Application
- 1.3.1 Global Digital Key Modules Market Size by Application, 2018 VS 2022 VS 2029
- 1.3.2 Automotive
- 1.3.3 Hotel
- 1.3.4 Household
- 1.4 Assumptions and Limitations
- 1.5 Study Objectives
- 1.6 Years Considered
2 Global Digital Key Modules Production
- 2.1 Global Digital Key Modules Production (2018-2029)
- 2.2 Global Digital Key Modules Production by Region: 2018 VS 2022 VS 2029, Based on Production Site
- 2.3 Global Digital Key Modules Production by Region
- 2.3.1 Global Digital Key Modules Historic Production by Region (2018-2023)
- 2.3.2 Global Digital Key Modules Forecasted Production by Region (2024-2029)
- 2.3.3 Global Digital Key Modules Production Market Share by Region (2018-2029)
- 2.4 North America
- 2.5 Europe
- 2.6 China
- 2.7 Asia-Pacific Other
3 Executive Summary
- 3.1 Global Digital Key Modules Revenue Estimates and Forecasts 2018-2029
- 3.2 Global Digital Key Modules Revenue by Region
- 3.2.1 Global Digital Key Modules Revenue by Region: 2018 VS 2022 VS 2029
- 3.2.2 Global Digital Key Modules Revenue by Region (2018-2023)
- 3.2.3 Global Digital Key Modules Revenue by Region (2024-2029)
- 3.2.4 Global Digital Key Modules Revenue Market Share by Region (2018-2029)
- 3.3 Global Digital Key Modules Sales Estimates and Forecasts 2018-2029
- 3.4 Global Digital Key Modules Sales by Region
- 3.4.1 Global Digital Key Modules Sales by Region: 2018 VS 2022 VS 2029
- 3.4.2 Global Digital Key Modules Sales by Region (2018-2023)
- 3.4.3 Global Digital Key Modules Sales by Region (2024-2029)
- 3.4.4 Global Digital Key Modules Sales Market Share by Region (2018-2029)
- 3.5 US & Canada
- 3.6 Europe
- 3.7 China
- 3.8 Asia (excluding China)
- 3.9 Middle East, Africa and Latin America
4 Competition by Manufacturers
- 4.1 Global Digital Key Modules Sales by Manufacturers
- 4.1.1 Global Digital Key Modules Sales by Manufacturers (2018-2023)
- 4.1.2 Global Digital Key Modules Sales Market Share by Manufacturers (2018-2023)
- 4.1.3 Global Top 10 and Top 5 Largest Manufacturers of Digital Key Modules in 2022
- 4.2 Global Digital Key Modules Revenue by Manufacturers
- 4.2.1 Global Digital Key Modules Revenue by Manufacturers (2018-2023)
- 4.2.2 Global Digital Key Modules Revenue Market Share by Manufacturers (2018-2023)
- 4.2.3 Global Top 10 and Top 5 Companies by Digital Key Modules Revenue in 2022
- 4.3 Global Digital Key Modules Sales Price by Manufacturers (2018-2023)
- 4.4 Global Key Players of Digital Key Modules, Industry Ranking, 2021 VS 2022
- 4.5 Analysis of Competitive Landscape
- 4.5.1 Manufacturers Market Concentration Ratio (CR5)
- 4.5.2 Global Digital Key Modules Market Share by Company Type (Tier 1, Tier 2, and Tier 3)
- 4.6 Global Key Manufacturers of Digital Key Modules, Major Market Areas and Headquarters
- 4.7 Global Key Manufacturers of Digital Key Modules, Product Offered and Application
- 4.8 Global Key Manufacturers of Digital Key Modules, Date of Enter into This Industry
- 4.9 Mergers & Acquisitions, Expansion Plans
5 Market Size by Type
- 5.1 Global Digital Key Modules Sales by Type
- 5.1.1 Global Digital Key Modules Historical Sales by Type (2018-2023)
- 5.1.2 Global Digital Key Modules Forecasted Sales by Type (2024-2029)
- 5.1.3 Global Digital Key Modules Sales Market Share by Type (2018-2029)
- 5.2 Global Digital Key Modules Revenue by Type
- 5.2.1 Global Digital Key Modules Historical Revenue by Type (2018-2023)
- 5.2.2 Global Digital Key Modules Forecasted Revenue by Type (2024-2029)
- 5.2.3 Global Digital Key Modules Revenue Market Share by Type (2018-2029)
- 5.3 Global Digital Key Modules Price by Type
- 5.3.1 Global Digital Key Modules Price by Type (2018-2023)
- 5.3.2 Global Digital Key Modules Price Forecast by Type (2024-2029)
6 Market Size by Application
- 6.1 Global Digital Key Modules Sales by Application
- 6.1.1 Global Digital Key Modules Historical Sales by Application (2018-2023)
- 6.1.2 Global Digital Key Modules Forecasted Sales by Application (2024-2029)
- 6.1.3 Global Digital Key Modules Sales Market Share by Application (2018-2029)
- 6.2 Global Digital Key Modules Revenue by Application
- 6.2.1 Global Digital Key Modules Historical Revenue by Application (2018-2023)
- 6.2.2 Global Digital Key Modules Forecasted Revenue by Application (2024-2029)
- 6.2.3 Global Digital Key Modules Revenue Market Share by Application (2018-2029)
- 6.3 Global Digital Key Modules Price by Application
- 6.3.1 Global Digital Key Modules Price by Application (2018-2023)
- 6.3.2 Global Digital Key Modules Price Forecast by Application (2024-2029)
7 US & Canada
- 7.1 US & Canada Digital Key Modules Market Size by Type
- 7.1.1 US & Canada Digital Key Modules Sales by Type (2018-2029)
- 7.1.2 US & Canada Digital Key Modules Revenue by Type (2018-2029)
- 7.2 US & Canada Digital Key Modules Market Size by Application
- 7.2.1 US & Canada Digital Key Modules Sales by Application (2018-2029)
- 7.2.2 US & Canada Digital Key Modules Revenue by Application (2018-2029)
- 7.3 US & Canada Digital Key Modules Market Size by Country
- 7.3.1 US & Canada Digital Key Modules Revenue by Country: 2018 VS 2022 VS 2029
- 7.3.2 US & Canada Digital Key Modules Sales by Country (2018-2029)
- 7.3.3 US & Canada Digital Key Modules Revenue by Country (2018-2029)
- 7.3.4 US
- 7.3.5 Canada
8 Europe
- 8.1 Europe Digital Key Modules Market Size by Type
- 8.1.1 Europe Digital Key Modules Sales by Type (2018-2029)
- 8.1.2 Europe Digital Key Modules Revenue by Type (2018-2029)
- 8.2 Europe Digital Key Modules Market Size by Application
- 8.2.1 Europe Digital Key Modules Sales by Application (2018-2029)
- 8.2.2 Europe Digital Key Modules Revenue by Application (2018-2029)
- 8.3 Europe Digital Key Modules Market Size by Country
- 8.3.1 Europe Digital Key Modules Revenue by Country: 2018 VS 2022 VS 2029
- 8.3.2 Europe Digital Key Modules Sales by Country (2018-2029)
- 8.3.3 Europe Digital Key Modules Revenue by Country (2018-2029)
- 8.3.4 Germany
- 8.3.5 France
- 8.3.6 U.K.
- 8.3.7 Italy
- 8.3.8 Russia
9 China
- 9.1 China Digital Key Modules Market Size by Type
- 9.1.1 China Digital Key Modules Sales by Type (2018-2029)
- 9.1.2 China Digital Key Modules Revenue by Type (2018-2029)
- 9.2 China Digital Key Modules Market Size by Application
- 9.2.1 China Digital Key Modules Sales by Application (2018-2029)
- 9.2.2 China Digital Key Modules Revenue by Application (2018-2029)
10 Asia (excluding China)
- 10.1 Asia Digital Key Modules Market Size by Type
- 10.1.1 Asia Digital Key Modules Sales by Type (2018-2029)
- 10.1.2 Asia Digital Key Modules Revenue by Type (2018-2029)
- 10.2 Asia Digital Key Modules Market Size by Application
- 10.2.1 Asia Digital Key Modules Sales by Application (2018-2029)
- 10.2.2 Asia Digital Key Modules Revenue by Application (2018-2029)
- 10.3 Asia Digital Key Modules Market Size by Region
- 10.3.1 Asia Digital Key Modules Revenue by Region: 2018 VS 2022 VS 2029
- 10.3.2 Asia Digital Key Modules Sales by Region (2018-2029)
- 10.3.3 Asia Digital Key Modules Revenue by Region (2018-2029)
- 10.3.4 Japan
- 10.3.5 South Korea
- 10.3.6 Southeast Asia
- 10.3.7 India
11 Middle East, Africa and Latin America
- 11.1 Middle East, Africa and Latin America Digital Key Modules Market Size by Type
- 11.1.1 Middle East, Africa and Latin America Digital Key Modules Sales by Type (2018-2029)
- 11.1.2 Middle East, Africa and Latin America Digital Key Modules Revenue by Type (2018-2029)
- 11.2 Middle East, Africa and Latin America Digital Key Modules Market Size by Application
- 11.2.1 Middle East, Africa and Latin America Digital Key Modules Sales by Application (2018-2029)
- 11.2.2 Middle East, Africa and Latin America Digital Key Modules Revenue by Application (2018-2029)
- 11.3 Middle East, Africa and Latin America Digital Key Modules Market Size by Country
- 11.3.1 Middle East, Africa and Latin America Digital Key Modules Revenue by Country: 2018 VS 2022 VS 2029
- 11.3.2 Middle East, Africa and Latin America Digital Key Modules Sales by Country (2018-2029)
- 11.3.3 Middle East, Africa and Latin America Digital Key Modules Revenue by Country (2018-2029)
- 11.3.4 Brazil
- 11.3.5 Mexico
- 11.3.6 Turkey
- 11.3.7 GCC Countries
12 Corporate Profile
- 12.1 Continental
- 12.1.1 Continental Corporation Information
- 12.1.2 Continental Overview
- 12.1.3 Continental Digital Key Modules Sales, Price, Revenue and Gross Margin (2018-2023)
- 12.1.4 Continental Digital Key Modules Product Model Numbers, Pictures, Descriptions and Specifications
- 12.1.5 Continental Recent Developments
- 12.2 Bosch
- 12.2.1 Bosch Corporation Information
- 12.2.2 Bosch Overview
- 12.2.3 Bosch Digital Key Modules Sales, Price, Revenue and Gross Margin (2018-2023)
- 12.2.4 Bosch Digital Key Modules Product Model Numbers, Pictures, Descriptions and Specifications
- 12.3 Valeo
- 12.3.1 Valeo Corporation Information
- 12.3.2 Valeo Overview
- 12.3.3 Valeo Digital Key Modules Sales, Price, Revenue and Gross Margin (2018-2023)
- 12.3.4 Valeo Digital Key Modules Product Model Numbers, Pictures, Descriptions and Specifications
- 12.4 Fin Dreams Technology
- 12.4.1 Fin Dreams Technology Corporation Information
- 12.4.2 Fin Dreams Technology Overview
- 12.4.3 Fin Dreams Technology Digital Key Modules Sales, Price, Revenue and Gross Margin (2018-2023)
- 12.4.4 Fin Dreams Technology Digital Key Modules Product Model Numbers, Pictures, Descriptions and Specifications
- 12.5 Hella
- 12.5.1 Hella Corporation Information
- 12.5.2 Hella Overview
- 12.5.3 Hella Digital Key Modules Sales, Price, Revenue and Gross Margin (2018-2023)
- 12.5.4 Hella Digital Key Modules Product Model Numbers, Pictures, Descriptions and Specifications
- 12.6 Huf Group
- 12.6.1 Huf Group Corporation Information
- 12.6.2 Huf Group Overview
- 12.6.3 Huf Group Digital Key Modules Sales, Price, Revenue and Gross Margin (2018-2023)
- 12.6.4 Huf Group Digital Key Modules Product Model Numbers, Pictures, Descriptions and Specifications
- 12.6.5 Huf Group Recent Developments
- 12.7 INGEEK
- 12.7.1 INGEEK Corporation Information
- 12.7.2 INGEEK Overview
- 12.7.3 INGEEK Digital Key Modules Sales, Price, Revenue and Gross Margin (2018-2023)
- 12.7.4 INGEEK Digital Key Modules Product Model Numbers, Pictures, Descriptions and Specifications
- 12.8 OpenKey
- 12.8.1 OpenKey Corporation Information
- 12.8.2 OpenKey Overview
- 12.8.3 OpenKey Digital Key Modules Sales, Price, Revenue and Gross Margin (2018-2023)
- 12.8.4 OpenKey Digital Key Modules Product Model Numbers, Pictures, Descriptions and Specifications
- 12.8.5 OpenKey Recent Developments
- 12.9 Pektron
- 12.9.1 Pektron Corporation Information
- 12.9.2 Pektron Overview
- 12.9.3 Pektron Digital Key Modules Sales, Price, Revenue and Gross Margin (2018-2023)
- 12.9.4 Pektron Digital Key Modules Product Model Numbers, Pictures, Descriptions and Specifications
- 12.9.5 Pektron Recent Developments
- 12.10 TsingCar
- 12.10.1 TsingCar Corporation Information
- 12.10.2 TsingCar Overview
- 12.10.3 TsingCar Digital Key Modules Sales, Price, Revenue and Gross Margin (2018-2023)
- 12.10.4 TsingCar Digital Key Modules Product Model Numbers, Pictures, Descriptions and Specifications
- 12.10.5 TsingCar Recent Developments
- 12.11 Danalock
- 12.11.1 Danalock Corporation Information
- 12.11.2 Danalock Overview
- 12.11.3 Danalock Digital Key Modules Sales, Price, Revenue and Gross Margin (2018-2023)
- 12.11.4 Danalock Digital Key Modules Product Model Numbers, Pictures, Descriptions and Specifications
- 12.12 Yuanfeng Technology
- 12.12.1 Yuanfeng Technology Corporation Information
- 12.12.2 Yuanfeng Technology Overview
- 12.12.3 Yuanfeng Technology Digital Key Modules Sales, Price, Revenue and Gross Margin (2018-2023)
- 12.12.4 Yuanfeng Technology Digital Key Modules Product Model Numbers, Pictures, Descriptions and Specifications
- 12.12.5 Yuanfeng Technology Recent Developments
- 12.13 LG Innotek
- 12.13.1 LG Innotek Corporation Information
- 12.13.2 LG Innotek Overview
- 12.13.3 LG Innotek Digital Key Modules Sales, Price, Revenue and Gross Margin (2018-2023)
- 12.13.4 LG Innotek Digital Key Modules Product Model Numbers, Pictures, Descriptions and Specifications
- 12.13.5 LG Innotek Recent Developments
13 Industry Chain and Sales Channels Analysis
- 13.1 Digital Key Modules Industry Chain Analysis
- 13.2 Digital Key Modules Key Raw Materials
- 13.2.1 Key Raw Materials
- 13.2.2 Raw Materials Key Suppliers
- 13.3 Digital Key Modules Production Mode & Process
- 13.4 Digital Key Modules Sales and Marketing
- 13.4.1 Digital Key Modules Sales Channels
- 13.4.2 Digital Key Modules Distributors
- 13.5 Digital Key Modules Customers
14 Digital Key Modules Market Dynamics
- 14.1.1 Digital Key Modules Industry Trends
- 14.1.2 Digital Key Modules Market Drivers
- 14.1.3 Digital Key Modules Market Challenges
- 14.1.4 Digital Key Modules Market Restraints
15 Key Findings in the Global Digital Key Modules Study
16 Appendix
- 16.1 Research Methodology
- 16.1.1 Methodology/Research Approach
- 16.1.2 Data Source
- 16.2 Author Details
- 16.3 Disclaimer
