|
|
市場調査レポート
商品コード
1345354
世界および米国のベーパーチャンバー市場:2023-2029年Global and United States Vapor Chamber Market Report & Forecast 2023-2029 |
||||||
|
|
|||||||
カスタマイズ可能
適宜更新あり
|
|||||||


| 世界および米国のベーパーチャンバー市場:2023-2029年 |
|
出版日: 2023年09月08日
発行: QYResearch
ページ情報: 英文 157 Pages
納期: 2~3営業日
|

- 全表示
- 概要
- 図表
- 目次
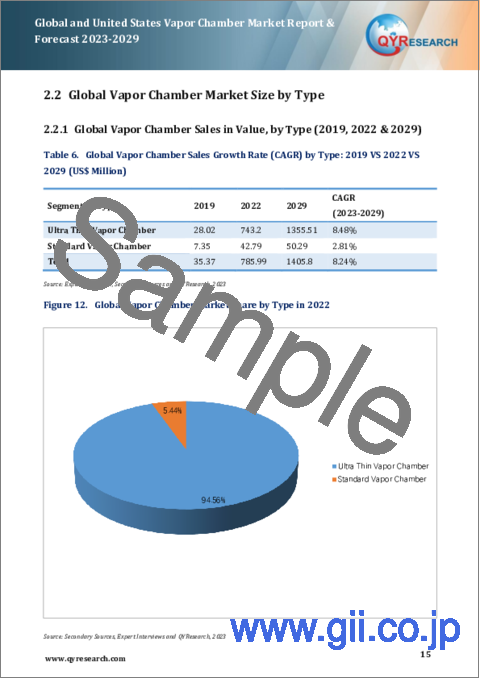
世界のベーパーチャンバーの市場規模は、収益ベースで2022年の7億8,599万米ドルから、予測期間中は8.24%のCAGRで推移し、2029年には14億580万米ドルの規模に成長すると予測されています。
米国のベーパーチャンバーの市場規模は、収益ベースで2022年の1億1,646万米ドルから、予測期間中は7.23%のCAGRで推移し、2029年には1億9,410万米ドルの規模に成長すると予測されています。
当レポートでは、世界および米国のベーパーチャンバーの市場を調査し、市場および製品の概要、競合情勢、市場規模の推移・予測、各種区分・地域/主要国別の詳細分析、価格動向、市場成長への各種影響因子の分析、主要企業の分析などをまとめています。
目次
第1章 調査範囲
- ベーパーチャンバー:製品概要
- 世界のベーパーチャンバーの見通し:2018 vs 2022 vs 2029
- 米国のベーパーチャンバーの見通し:2018 vs 2022 vs 2029
- 市場規模:米国 vs 世界:2018 vs 2022 vs 2029
- 市場力学
- 産業動向
- 市場に有利な要因・不利な要因
- 市場課題
- 市場リスク
- 前提・制限
- 調査目的
第2章 ベーパーチャンバー市場:タイプ別
- ベーパーチャンバー市場:タイプ別
- 超薄型ベーパーチャンバー
- 標準ベーパーチャンバー
- 世界市場の規模
- 販売数
- 販売額
- 平均販売価格(ASP)
- 米国市場の規模
- 販売数
- 販売額
- 平均販売価格(ASP)
第3章 ベーパーチャンバー市場:用途別
- ベーパーチャンバー市場:用途別
- 電話
- その他のモバイルデバイス
- その他
- 世界市場の規模
- 販売数
- 販売額
- 平均販売価格(ASP)
- 米国市場の規模
- 販売数
- 販売額
- 平均販売価格(ASP)
第4章 世界のベーパーチャンバ市場の競合情勢:企業別
- 市場規模:企業別
- 市場集中率(CR)
- 世界的主要製造業者:製造拠点の分布および本社
- 世界の主要製造業者:設立日
- M&A・拡張計画
- 米国のベーパーチャンバー市場の規模:企業別
第5章 世界のベーパーチャンバー市場の規模:地域別
- 地域別の市場規模:2018 vs 2022 vs 2029
- 販売数の推移・予測
- 販売額の推移・予測
第6章 南北アメリカ
第7章 欧州・中東・アフリカ
第8章 中国
第9章 アジア太平洋(中国を除く)
第10章 主要企業の概要
- Auras
- CCI
- Jentech
- Taisol
- Fujikura
- Forcecon Tech
- Delta Electronics
- Jones Tech
- Celsia
- Tanyuan Technology
- Wakefield Vette
- AVC
- Specialcoolest Technology
- Boyd
第11章 産業チェーンと販売チャネルの分析
- 産業チェーンの分析
- 原材料
- 寸法
- 製造モード
- 販売・マーケティング
- 顧客
第12章 調査結果・総論
第13章 付録
List of Tables
- Table 1. Vapor Chamber CAGR in Value (US$ Million), United States VS Global, 2019 VS 2022 VS 2029
- Table 2. Vapor Chamber Market Trends
- Table 3. Market Favorable Factors and Unfavorable Factors
- Table 4. Vapor Chamber Market Challenges
- Table 5. Market Risks
- Table 6. Global Vapor Chamber Sales Growth Rate (CAGR) by Type: 2019 VS 2022 VS 2029 (US$ Million)
- Table 7. United States Vapor Chamber Sales Growth Rate (CAGR) by Type: 2019 VS 2022 VS 2029 (US$ Million)
- Table 8. Global Vapor Chamber Sales Growth Rate (CAGR) by Application: 2019 VS 2022 VS 2029 (US$ Million)
- Table 9. United States Vapor Chamber Sales Growth Rate (CAGR) by Application: 2019 VS 2022 VS 2029 (US$ Million)
- Table 10. Global Key Manufacturers of Vapor Chamber, Ranked by Revenue (2022) & (US$ Million)
- Table 11. Global Vapor Chamber Revenue by Manufacturer, (US$ Million) & (2019-2023)
- Table 12. Global Vapor Chamber Revenue Share by Manufacturer, 2019-2023
- Table 13. Global Vapor Chamber Sales by Manufacturer, (K Units), 2019-2023
- Table 14. Global Vapor Chamber Sales Share by Manufacturer, 2019-2023
- Table 15. Global Vapor Chamber Price by Manufacturer (2019-2023) & (US$/Unit)
- Table 16. Global Vapor Chamber Manufacturers Market Concentration Ratio (CR5 and HHI)
- Table 17. Global Vapor Chamber by Company Type (Tier 1, Tier 2, and Tier 3) & (based on the Revenue in Vapor Chamber as of 2022)
- Table 18. Global Key Manufacturers of Vapor Chamber Headquarters
- Table 19. Global Key Manufacturers of Vapor Chamber Established Time
- Table 20. United States Vapor Chamber Revenue by Players, (US$ Million) & (2019-2023)
- Table 21. United States Vapor Chamber Revenue Share by Players, (2019-2023)
- Table 22. United States Vapor Chamber Sales by Players, (K Units) & (2019-2023)
- Table 23. United States Vapor Chamber Sales Share by Players, (2019-2023)
- Table 24. Global Vapor Chamber Market Size Growth Rate (CAGR) by Region (US$ Million): 2019 VS 2022 VS 2029
- Table 25. Global Vapor Chamber Sales in Volume by Region (2019-2023) & (K Units)
- Table 26. Global Vapor Chamber Sales in Volume Forecast by Region (2024-2029) & (K Units)
- Table 27. Global Vapor Chamber Sales in Value by Region (2019-2023) & (US$ Million)
- Table 28. Global Vapor Chamber Sales in Value Forecast by Region (2024-2029) & (US$ Million)
- Table 29. Americas Vapor Chamber Market Size Growth Rate (CAGR) by Country (US$ Million): 2019 VS 2022 VS 2029
- Table 30. Americas Vapor Chamber Sales in Value by Country (2019-2023) & (US$ Million)
- Table 31. Americas Vapor Chamber Sales in Value by Country (2024-2029) & (US$ Million)
- Table 32. Americas Vapor Chamber Sales in Volume by Country (2019-2023) & (K Units)
- Table 33. Americas Vapor Chamber Sales in Volume by Country (2024-2029) & (K Units)
- Table 34. EMEA Vapor Chamber Market Size Growth Rate (CAGR) by Country (US$ Million): 2019 VS 2022 VS 2029
- Table 35. EMEA Vapor Chamber Sales in Value by Country (2019-2023) & (US$ Million)
- Table 36. EMEA Vapor Chamber Sales in Value by Country (2024-2029) & (US$ Million)
- Table 37. EMEA Vapor Chamber Sales in Volume by Country (2019-2023) & (K Units)
- Table 38. EMEA Vapor Chamber Sales in Volume by Country (2024-2029) & (K Units)
- Table 39. APAC (excluding China) Vapor Chamber Market Size Growth Rate (CAGR) by Country (US$ Million): 2019 VS 2022 VS 2029
- Table 40. APAC (excluding China) Vapor Chamber Sales in Value by Country (2019-2023) & (US$ Million)
- Table 41. APAC (excluding China) Vapor Chamber Sales in Value by Country (2024-2029) & (US$ Million)
- Table 42. APAC (excluding China) Vapor Chamber Sales in Volume by Country (2019-2023) & (K Units)
- Table 43. APAC (excluding China) Vapor Chamber Sales in Volume by Country (2024-2029) & (K Units)
- Table 44. Auras Vapor Chamber Company Information
- Table 45. Auras Vapor Chamber Product Portfolio
- Table 46. Auras Vapor Chamber Sales (K Units), Value (US$ Million), Price (US$/Unit) and Gross Margin (2019-2023)
- Table 47. Auras Main Business and Markets Served
- Table 48. CCI Vapor Chamber Company Information
- Table 49. CCI Vapor Chamber Product Portfolio
- Table 50. CCI Vapor Chamber Sales (K Units), Value (US$ Million), Price (US$/Unit) and Gross Margin (2019-2023)
- Table 51. CCI Main Business and Markets Served
- Table 52. Jentech Vapor Chamber Company Information
- Table 53. Jentech Vapor Chamber Product Portfolio
- Table 54. Jentech Vapor Chamber Sales (K Units), Value (US$ Million), Price (US$/Unit) and Gross Margin (2019-2023)
- Table 55. Jentech Main Business and Markets Served
- Table 56. Taisol Vapor Chamber Company Information
- Table 57. Taisol Vapor Chamber Product Portfolio
- Table 58. Taisol Vapor Chamber Sales (K Units), Value (US$ Million), Price (US$/Unit) and Gross Margin (2019-2023)
- Table 59. Taisol Main Business and Markets Served
- Table 60. Fujikura Vapor Chamber Company Information
- Table 61. Fujikura Vapor Chamber Product Portfolio
- Table 62. Fujikura Vapor Chamber Sales (K Units), Value (US$ Million), Price (US$/Unit) and Gross Margin (2019-2023)
- Table 63. Fujikura Main Business and Markets Served
- Table 64. Forcecon Tech Vapor Chamber Company Information
- Table 65. Forcecon Tech Vapor Chamber Product Portfolio
- Table 66. Forcecon Tech Vapor Chamber Sales (K Units), Value (US$ Million), Price (US$/Unit) and Gross Margin (2019-2023)
- Table 67. Forcecon Tech Main Business and Markets Served
- Table 68. Delta Electronics Vapor Chamber Company Information
- Table 69. Delta Electronics Vapor Chamber Product Portfolio
- Table 70. Delta Electronics Vapor Chamber Sales (K Units), Value (US$ Million), Price (US$/Unit) and Gross Margin (2019-2023)
- Table 71. Delta Electronics Main Business and Markets Served
- Table 72. Jones Tech Vapor Chamber Company Information
- Table 73. Jones Tech Vapor Chamber Product Portfolio
- Table 74. Jones Tech Vapor Chamber Sales (K Units), Value (US$ Million), Price (US$/Unit) and Gross Margin (2019-2023)
- Table 75. Jones Tech Main Business and Markets Served
- Table 76. Celsia Vapor Chamber Company Information
- Table 77. Celsia Vapor Chamber Product Portfolio
- Table 78. Celsia Vapor Chamber Sales (K Units), Value (US$ Million), Price (US$/Unit) and Gross Margin (2019-2023)
- Table 79. Celsia Main Business and Markets Served
- Table 80. Tanyuan Technology Vapor Chamber Company Information
- Table 81. Tanyuan Technology Vapor Chamber Product Portfolio
- Table 82. Tanyuan Technology Vapor Chamber Sales (K Units), Value (US$ Million), Price (US$/Unit) and Gross Margin (2019-2023)
- Table 83. Tanyuan Technology Main Business and Markets Served
- Table 84. Wakefield Vette Vapor Chamber Company Information
- Table 85. Wakefield Vette Vapor Chamber Product Portfolio
- Table 86. Wakefield Vette Vapor Chamber Sales (K Units), Value (US$ Million), Price (US$/Unit) and Gross Margin (2019-2023)
- Table 87. Wakefield Vette Main Business and Markets Served
- Table 88. AVC Vapor Chamber Company Information
- Table 89. AVC Vapor Chamber Product Portfolio
- Table 90. AVC Vapor Chamber Sales (K Units), Value (US$ Million), Price (US$/Unit) and Gross Margin (2019-2023)
- Table 91. AVC Main Business and Markets Served
- Table 92. Specialcoolest Technology Vapor Chamber Company Information
- Table 93. Specialcoolest Technology Vapor Chamber Product Portfolio
- Table 94. Specialcoolest Technology Vapor Chamber Sales (K Units), Value (US$ Million), Price (US$/Unit) and Gross Margin (2019-2023)
- Table 95. Specialcoolest Technology Main Business and Markets Served
- Table 96. Boyd Vapor Chamber Company Information
- Table 97. Boyd Vapor Chamber Product Portfolio
- Table 98. Boyd Vapor Chamber Sales (K Units), Value (US$ Million), Price (US$/Unit) and Gross Margin (2019-2023)
- Table 99. Boyd Main Business and Markets Served
- Table 100. Vapor Chamber Customers List
- Table 101. Research Programs/Design for This Report
- Table 102. Key Data Information from Secondary Sources
- Table 103. Key Data Information from Primary Sources
- Table 104. QYR Business Unit and Senior & Team Lead Analysts
List of Figures
- Figure 1. Vapor Chamber Product Picture
- Figure 2. Global Vapor Chamber Revenue, (US$ Million), 2019 VS 2022 VS 2029
- Figure 3. Global Vapor Chamber Market Size 2019-2029 (US$ Million)
- Figure 4. Global Vapor Chamber Sales 2019-2029 (K Units)
- Figure 5. United States Vapor Chamber Revenue, (US$ Million), 2019 VS 2022 VS 2029
- Figure 6. United States Vapor Chamber Market Size 2019-2029 (US$ Million)
- Figure 7. United States Vapor Chamber Sales 2019-2029 (K Units)
- Figure 8. United States Vapor Chamber Market Share in Global, in Value (US$ Million) 2019-2029
- Figure 9. United States Vapor Chamber Market Share in Global, in Volume (K Units) 2019-2029
- Figure 10. Product Picture of Ultra Thin Vapor Chamber
- Figure 11. Product Picture of Standard Vapor Chamber
- Figure 12. Global Vapor Chamber Market Share by Type in 2022
- Figure 13. Global Vapor Chamber Sales in Value by Type (2019-2029) & (US$ Million)
- Figure 14. Global Vapor Chamber Sales by Type (2019-2029) & (K Units)
- Figure 15. Global Vapor Chamber Price by Type (2019-2029) & (US$/Unit)
- Figure 16. United States Vapor Chamber Market Share by Type in 2022
- Figure 17. United States Vapor Chamber Sales in Value by Type (2019-2029) & (US$ Million)
- Figure 18. United States Vapor Chamber Sales by Type (2019-2029) & (K Units)
- Figure 19. United States Vapor Chamber Price by Type (2019-2029) & (US$/Unit)
- Figure 20. Product Picture of Phone
- Figure 21. Product Picture of Other Mobile Devices
- Figure 22. Product Picture of Others
- Figure 23. Global Vapor Chamber Market Share by Application in 2022
- Figure 24. Global Vapor Chamber Sales in Value by Application (2019-2029) & (US$ Million)
- Figure 25. Global Vapor Chamber Sales by Application (2019-2029) & (K Units)
- Figure 26. Global Vapor Chamber Price by Application (2019-2029) & (US$/Unit)
- Figure 27. United States Vapor Chamber Market Share by Application in 2022
- Figure 28. United States Vapor Chamber Sales in Value by Application (2019-2029) & (US$ Million)
- Figure 29. United States Vapor Chamber Sales by Application (2019-2029) & (K Units)
- Figure 30. United States Vapor Chamber Price by Application (2019-2029) & (US$/Unit)
- Figure 31. The Top 5 Largest Manufacturers of Vapor Chamber in the World: Market Share by Vapor Chamber Revenue in 2022
- Figure 32. Global Vapor Chamber Market Size Market Share by Region: 2022
- Figure 33. Global Vapor Chamber Sales in Volume Market Share by Region (2022)
- Figure 34. Global Vapor Chamber Sales in Value Market Share by Region (2022)
- Figure 35. Americas Vapor Chamber Sales in Volume Growth Rate 2019-2029 (K Units)
- Figure 36. Americas Vapor Chamber Sales in Value Growth Rate 2019-2029 (US$ Million)
- Figure 37. Americas Vapor Chamber Sales by Type (2019-2029) & (K Units)
- Figure 38. Americas Vapor Chamber Sales Market Share in Volume by Type (2022)
- Figure 39. Americas Vapor Chamber Sales by Application (2019-2029) & (K Units)
- Figure 40. Americas Vapor Chamber Sales Market Share in Volume by Application (2022)
- Figure 41. United States Vapor Chamber Sales in Value Growth Rate (2019-2029) & (US$ Million)
- Figure 42. Canada Vapor Chamber Sales in Value Growth Rate (2019-2029) & (US$ Million)
- Figure 43. Mexico Vapor Chamber Sales in Value Growth Rate (2019-2029) & (US$ Million)
- Figure 44. Brazil Vapor Chamber Sales in Value Growth Rate (2019-2029) & (US$ Million)
- Figure 45. EMEA Vapor Chamber Sales in Volume Growth Rate 2019-2029 (K Units)
- Figure 46. EMEA Vapor Chamber Sales in Value Growth Rate 2019-2029 (US$ Million)
- Figure 47. EMEA Vapor Chamber Sales by Type (2019-2029) & (K Units)
- Figure 48. EMEA Vapor Chamber Sales Market Share in Volume by Type (2022)
- Figure 49. EMEA Vapor Chamber Sales by Application (2019-2029) & (K Units)
- Figure 50. EMEA Vapor Chamber Sales Market Share in Volume by Application (2022)
- Figure 51. Europe Vapor Chamber Sales in Value Growth Rate (2019-2029) & (US$ Million)
- Figure 52. Middle East Vapor Chamber Sales in Value Growth Rate (2019-2029) & (US$ Million)
- Figure 53. Africa Vapor Chamber Sales in Value Growth Rate (2019-2029) & (US$ Million)
- Figure 54. China Vapor Chamber Sales in Volume Growth Rate 2019-2029 (K Units)
- Figure 55. China Vapor Chamber Sales in Value Growth Rate 2019-2029 (US$ Million)
- Figure 56. China Vapor Chamber Sales by Type (2019-2029) & (K Units)
- Figure 57. China Vapor Chamber Sales Market Share in Volume by Type (2022)
- Figure 58. China Vapor Chamber Sales by Application (2019-2029) & (K Units)
- Figure 59. China Vapor Chamber Sales Market Share in Volume by Application (2022)
- Figure 60. APAC (excluding China) Vapor Chamber Sales in Volume Growth Rate 2019-2029 (K Units)
- Figure 61. APAC (excluding China) Vapor Chamber Sales in Value Growth Rate 2019-2029 (US$ Million)
- Figure 62. APAC (excluding China) Vapor Chamber Sales by Type (2019-2029) & (K Units)
- Figure 63. APAC (excluding China) Vapor Chamber Sales Market Share in Volume by Type (2022)
- Figure 64. APAC (excluding China) Vapor Chamber Sales by Application (2019-2029) & (K Units)
- Figure 65. APAC (excluding China) Vapor Chamber Sales Market Share in Volume by Application (2022)
- Figure 66. Japan Vapor Chamber Sales in Value Growth Rate (2019-2029) & (US$ Million)
- Figure 67. South Korea Vapor Chamber Sales in Value Growth Rate (2019-2029) & (US$ Million)
- Figure 68. Vapor Chamber Value Chain
- Figure 69. Channels of Distribution
- Figure 70. Bottom-up and Top-down Approaches for This Report
- Figure 71. Data Triangulation
- Figure 72. Key Executives Interviewed
The global Vapor Chamber revenue was US$ 785.99 million in 2022 and is forecast to a readjusted size of US$ 1405.8 million by 2029 with a CAGR of 8.24% during the review period (2023-2029).
In United States the Vapor Chamber revenue is expected to grow from US$ 116.46 million in 2022 to US$ 194.1 million by 2029, at a CAGR of 7.23% during the forecast period (2023-2029).
This report focuses on global and United States Vapor Chamber market, also covers the segmentation data of other regions in regional level and county level.
Scope and Market Size
Vapor Chamber market is segmented in regional and country level, by players, by Type, and by Application. Companies, stakeholders, and other participants in the global Vapor Chamber market will be able to gain the upper hand as they use the report as a powerful resource. The segmental analysis focuses on sales, revenue and forecast by Type and by Application for the period 2019-2029.
For United States market, this report focuses on the Vapor Chamber market size by players, by Type, and by Application, for the period 2019-2029. The key players include the global and local players which play important roles in United States.
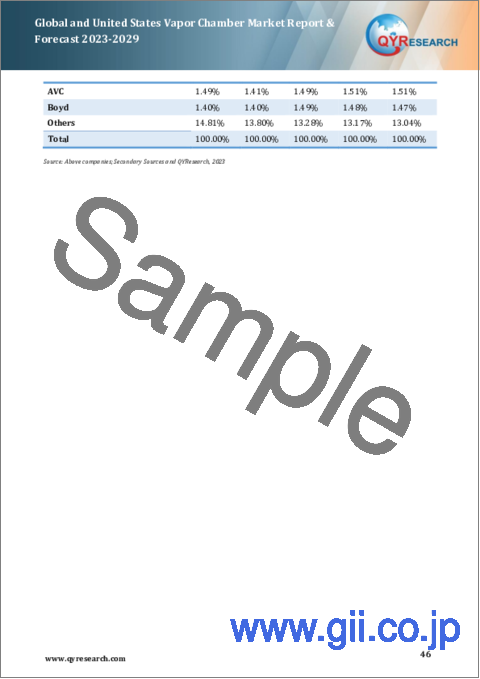
By Company
- Auras
- CCI
- Jentech
- Taisol
- Fujikura
- Forcecon Tech
- Delta Electronics
- Jones Tech
- Celsia
- Tanyuan Technology
- Wakefield Vette
- AVC
- Specialcoolest Technology
- Boyd
Segment by Type
- Ultra Thin Vapor Chamber
- Standard Vapor Chamber
Segment by Application
- Phone
- Other Mobile Devices
- Others
By Region
- Americas
- United States
- Canada
- Mexico
- Brazil
- China
- APAC (excluding China)
- Japan
- South Korea
- EMEA
- Europe
- Middle East
- Africa
Chapter Introduction
- Chapter 1: Introduces Vapor Chamber definition, global sales (volume and revenue), United States market size, United States percentage in global market. This section also introduces the market dynamics, latest developments of the market, the driving factors and restrictive factors of the market, the challenges and risks faced by companies in the industry, and the analysis of relevant policies in the industry.
- Chapter 2: Provides the analysis of various market segments by Type, covering the volume, price, revenue, and development potential of each market segment, to help readers find the blue ocean market in different market segments.
- Chapter 3: Provides the analysis of various market segments by Application, covering the revenue, price, volume, and development potential of each market segment, to help readers find the blue ocean market in different downstream markets.
- Chapter 4: Detailed analysis of Vapor Chamber companies' competitive landscape, revenue, market share and industry ranking, latest development plan, merger, and acquisition information, etc.
- Chapter 5: Revenue and volume of Vapor Chamber in global and regional level. It provides a quantitative analysis of the market size and development potential of each region and introduces the market development, future development prospects, market space, and capacity of each country in the world.
- Chapter 6: Americas by Type, by Application and by country, sales, and revenue for each segment.
- Chapter 7: EMEA by Type, by Application and by region, sales, and revenue for each segment.
- Chapter 8: China by Type, and by Application, sales, and revenue for each segment.
- Chapter 9: APAC (excluding China) by Type, by Application and by region, sales, and revenue for each segment.
- Chapter 10: Provides profiles of key companies, introducing the basic situation of the main companies in the market in detail, including product descriptions and specifications, Vapor Chamber sales, revenue, gross margin, and recent development, etc.
- Chapter 11: Analysis of industrial chain, sales channel, key raw materials, distributors, and customers.
- Chapter 12: research findings and conclusion
Table of Contents
1 Study Coverage
- 1.1 Vapor Chamber Product Introduction
- 1.2 Global Vapor Chamber Outlook 2019 VS 2022 VS 2029
- 1.2.1 Global Vapor Chamber Sales in US$ Million for the Year 2019-2029
- 1.2.2 Global Vapor Chamber Sales in Volume for the Year 2019-2029
- 1.3 United States Vapor Chamber Outlook 2019 VS 2022 VS 2029
- 1.3.1 United States Vapor Chamber Sales in US$ Million for the Year 2019-2029
- 1.3.2 United States Vapor Chamber Sales in Volume for the Year 2019-2029
- 1.4 Vapor Chamber Market Size, United States VS Global, 2019 VS 2022 VS 2029
- 1.4.1 The Market Share of United States Vapor Chamber in Global, 2019 VS 2022 VS 2029
- 1.4.2 The Growth Rate of Vapor Chamber Market Size, United States VS Global, 2019 VS 2022 VS 2029
- 1.5 Vapor Chamber Market Dynamics
- 1.5.1 Vapor Chamber Industry Trends
- 1.5.2 Vapor Chamber Market Favorable Factors and Unfavorable Factors
- 1.5.3 Vapor Chamber Market Challenges
- 1.5.4 Vapor Chamber Market Risks
- 1.6 Assumptions and Limitations
- 1.7 Study Objectives
2 Vapor Chamber by Type
- 2.1 Vapor Chamber Market by Type
- 2.1.1 Ultra Thin Vapor Chamber
- 2.1.2 Standard Vapor Chamber
- 2.2 Global Vapor Chamber Market Size by Type
- 2.2.1 Global Vapor Chamber Sales in Value, by Type (2019, 2022 & 2029)
- 2.2.2 Global Vapor Chamber Sales in Volume, by Type (2019, 2022 & 2029)
- 2.2.3 Global Vapor Chamber Average Selling Price (ASP) by Type (2019, 2022 & 2029)
- 2.3 United States Vapor Chamber Market Size by Type
- 2.3.1 United States Vapor Chamber Sales in Value, by Type (2019, 2022 & 2029)
- 2.3.2 United States Vapor Chamber Sales in Volume, by Type (2019, 2022 & 2029)
- 2.3.3 United States Vapor Chamber Average Selling Price (ASP) by Type (2019, 2022 & 2029)
3 Vapor Chamber by Application
- 3.1 Vapor Chamber Market by Application
- 3.1.1 Phone
- 3.1.2 Other Mobile Devices
- 3.1.3 Others
- 3.2 Global Vapor Chamber Market Size by Application
- 3.2.1 Global Vapor Chamber Sales in Value, by Application (2019, 2022 & 2029)
- 3.2.2 Global Vapor Chamber Sales in Volume, by Application (2019, 2022 & 2029)
- 3.2.3 Global Vapor Chamber Average Selling Price (ASP) by Application (2019, 2022 & 2029)
- 3.3 United States Vapor Chamber Market Size by Application
- 3.3.1 United States Vapor Chamber Sales in Value, by Application (2019, 2022 & 2029)
- 3.3.2 United States Vapor Chamber Sales in Volume, by Application (2019, 2022 & 2029)
- 3.3.3 United States Vapor Chamber Average Selling Price (ASP) by Application (2019, 2022 & 2029)
4 Global Vapor Chamber Competitor Landscape by Company
- 4.1 Global Vapor Chamber Market Size by Company
- 4.1.1 Global Key Manufacturers of Vapor Chamber, Ranked by Revenue (2022)
- 4.1.2 Global Vapor Chamber Revenue by Manufacturer (2019-2023)
- 4.1.3 Global Vapor Chamber Sales by Manufacturer (2019-2023)
- 4.1.4 Global Vapor Chamber Price by Manufacturer (2019-2023)
- 4.2 Global Vapor Chamber Concentration Ratio (CR)
- 4.2.1 Vapor Chamber Market Concentration Ratio (CR) (2019-2023)
- 4.2.2 Global Top 5 Largest Manufacturers of Vapor Chamber in 2022
- 4.2.3 Global Vapor Chamber Market Share by Company Type (Tier 1, Tier 2, and Tier 3)
- 4.3 Global Key Manufacturers of Vapor Chamber, Manufacturing Base Distribution and Headquarters
- 4.4 Global Key Manufacturers of Vapor Chamber Established Time
- 4.5 Manufacturers Mergers & Acquisitions, Expansion Plans
- 4.6 United States Vapor Chamber Market Size by Company
- 4.6.1 United States Vapor Chamber Revenue by Players (2019-2023)
- 4.6.2 United States Vapor Chamber Sales by Players (2019-2023)
5 Global Vapor Chamber Market Size by Region
- 5.1 Global Vapor Chamber Market Size by Region: 2019 VS 2022 VS 2029
- 5.2 Global Vapor Chamber Market Size in Volume by Region (2019-2029)
- 5.2.1 Global Vapor Chamber Sales in Volume by Region: 2019-2023
- 5.2.2 Global Vapor Chamber Sales in Volume Forecast by Region (2024-2029)
- 5.3 Global Vapor Chamber Market Size in Value by Region (2019-2029)
- 5.3.1 Global Vapor Chamber Sales in Value by Region: 2019-2023
- 5.3.2 Global Vapor Chamber Sales in Value by Region: 2024-2029
6 Americas
- 6.1 Americas Vapor Chamber Market Size YoY Growth 2019-2029
- 6.2 Americas Vapor Chamber Sales in Volume, by Type (2019, 2022 & 2029)
- 6.3 Americas Vapor Chamber Sales in Volume, by Application (2019, 2022 & 2029)
- 6.4 Americas Vapor Chamber Market Facts & Figures by Country (2019, 2022 & 2029)
- 6.4.1 Americas Vapor Chamber Sales in Value by Country (2019, 2022 & 2029)
- 6.4.2 Americas Vapor Chamber Sales in Volume by Country (2019, 2022 & 2029)
- 6.4.3 United States
- 6.4.4 Canada
- 6.4.5 Mexico
- 6.4.6 Brazil
7 EMEA
- 7.1 EMEA Vapor Chamber Market Size YoY Growth 2019-2029
- 7.2 EMEA Vapor Chamber Sales in Volume, by Type (2019, 2022 & 2029)
- 7.3 EMEA Vapor Chamber Sales in Volume, by Application (2019, 2022 & 2029)
- 7.4 EMEA Vapor Chamber Market Facts & Figures by Country (2019, 2022 & 2029)
- 7.4.1 EMEA Vapor Chamber Sales in Value by Country (2019, 2022 & 2029)
- 7.4.2 EMEA Vapor Chamber Sales in Volume by Country (2019, 2022 & 2029)
- 7.4.3 Europe
- 7.4.4 Middle East
- 7.4.5 Africa
8 China
- 8.1 China Vapor Chamber Market Size YoY Growth 2019-2029
- 8.2 China Vapor Chamber Sales in Volume, by Type (2019, 2022 & 2029)
- 8.3 China Vapor Chamber Sales in Volume, by Application (2019, 2022 & 2029)
9 APAC (excluding China)
- 9.1 APAC (excluding China) Vapor Chamber Market Size YoY Growth 2019-2029
- 9.2 APAC (excluding China) Vapor Chamber Sales in Volume, by Type (2019, 2022 & 2029)
- 9.3 APAC (excluding China) Vapor Chamber Sales in Volume, by Application (2019, 2022 & 2029)
- 9.4 APAC (excluding China) Vapor Chamber Market Facts & Figures by Country (2019, 2022 & 2029)
- 9.4.1 APAC (excluding China) Vapor Chamber Sales in Value by Country (2019, 2022 & 2029)
- 9.4.2 APAC (excluding China) Vapor Chamber Sales in Volume by Country (2019, 2022 & 2029)
- 9.4.3 Japan
- 9.4.4 South Korea
10 Key Companies Profiled
- 10.1 Auras
- 10.1.1 Auras Vapor Chamber Company Information
- 10.1.2 Auras Vapor Chamber Product Portfolio
- 10.1.3 Auras Vapor Chamber Sales, Value, Price and Gross Margin (2019-2023)
- 10.1.4 Auras Main Business and Markets Served
- 10.2 CCI
- 10.2.1 CCI Vapor Chamber Company Information
- 10.2.2 CCI Vapor Chamber Product Portfolio
- 10.2.3 CCI Vapor Chamber Sales, Value, Price and Gross Margin (2019-2023)
- 10.2.4 CCI Main Business and Markets Served
- 10.3 Jentech
- 10.3.1 Jentech Vapor Chamber Company Information
- 10.3.2 Jentech Vapor Chamber Product Portfolio
- 10.3.3 Jentech Vapor Chamber Sales, Value, Price and Gross Margin (2019-2023)
- 10.3.4 Jentech Main Business and Markets Served
- 10.4 Taisol
- 10.4.1 Taisol Vapor Chamber Company Information
- 10.4.2 Taisol Vapor Chamber Product Portfolio
- 10.4.3 Taisol Vapor Chamber Sales, Value, Price and Gross Margin (2019-2023)
- 10.4.4 Taisol Main Business and Markets Served
- 10.5 Fujikura
- 10.5.1 Fujikura Vapor Chamber Company Information
- 10.5.2 Fujikura Vapor Chamber Product Portfolio
- 10.5.3 Fujikura Vapor Chamber Sales, Value, Price and Gross Margin (2019-2023)
- 10.5.4 Fujikura Main Business and Markets Served
- 10.6 Forcecon Tech
- 10.6.1 Forcecon Tech Vapor Chamber Company Information
- 10.6.2 Forcecon Tech Vapor Chamber Product Portfolio
- 10.6.3 Forcecon Tech Vapor Chamber Sales, Value, Price and Gross Margin (2019-2023)
- 10.6.4 Forcecon Tech Main Business and Markets Served
- 10.7 Delta Electronics
- 10.7.1 Delta Electronics Vapor Chamber Company Information
- 10.7.2 Delta Electronics Vapor Chamber Product Portfolio
- 10.7.3 Delta Electronics Vapor Chamber Sales, Value, Price and Gross Margin (2019-2023)
- 10.7.4 Delta Electronics Main Business and Markets Served
- 10.8 Jones Tech
- 10.8.1 Jones Tech Vapor Chamber Company Information
- 10.8.2 Jones Tech Vapor Chamber Product Portfolio
- 10.8.3 Jones Tech Vapor Chamber Sales, Value, Price and Gross Margin (2019-2023)
- 10.8.4 Jones Tech Main Business and Markets Served
- 10.9 Celsia
- 10.9.1 Celsia Vapor Chamber Company Information
- 10.9.2 Celsia Vapor Chamber Product Portfolio
- 10.9.3 Celsia Vapor Chamber Sales, Value, Price and Gross Margin (2019-2023)
- 10.9.4 Celsia Main Business and Markets Served
- 10.10 Tanyuan Technology
- 10.10.1 Tanyuan Technology Vapor Chamber Company Information
- 10.10.2 Tanyuan Technology Vapor Chamber Product Portfolio
- 10.10.3 Tanyuan Technology Vapor Chamber Sales, Value, Price and Gross Margin (2019-2023)
- 10.10.4 Tanyuan Technology Main Business and Markets Served
- 10.11 Wakefield Vette
- 10.11.1 Wakefield Vette Vapor Chamber Company Information
- 10.11.2 Wakefield Vette Vapor Chamber Product Portfolio
- 10.11.3 Wakefield Vette Vapor Chamber Sales, Value, Price and Gross Margin (2019-2023)
- 10.11.4 Wakefield Vette Main Business and Markets Served
- 10.12 AVC
- 10.12.1 AVC Vapor Chamber Company Information
- 10.12.2 AVC Vapor Chamber Product Portfolio
- 10.12.3 AVC Vapor Chamber Sales, Value, Price and Gross Margin (2019-2023)
- 10.12.4 AVC Main Business and Markets Served
- 10.13 Specialcoolest Technology
- 10.13.1 Specialcoolest Technology Vapor Chamber Company Information
- 10.13.2 Specialcoolest Technology Vapor Chamber Product Portfolio
- 10.13.3 Specialcoolest Technology Vapor Chamber Sales, Value, Price and Gross Margin (2019-2023)
- 10.13.4 Specialcoolest Technology Main Business and Markets Served
- 10.14 Boyd
- 10.14.1 Boyd Vapor Chamber Company Information
- 10.14.2 Boyd Vapor Chamber Product Portfolio
- 10.14.3 Boyd Vapor Chamber Sales, Value, Price and Gross Margin (2019-2023)
- 10.14.4 Boyd Main Business and Markets Served
11 Industry Chain and Sales Channels Analysis
- 11.1 Vapor Chamber Industry Chain Analysis
- 11.2 Vapor Chamber Raw Materials
- 11.3 Vapor Chamber Dimensions
- 11.4 Vapor Chamber Production Process
- 11.5 Vapor Chamber Sales and Marketing
- 11.6 Vapor Chamber Customers
12 Research Findings and Conclusion
13 Appendix
- 13.1 Research Methodology
- 13.1.1 Methodology/Research Approach
- 13.1.2 Data Source
- 13.2 Author Details
- 13.3 Disclaimer
