|
|
市場調査レポート
商品コード
1343538
世界および米国のホウ素-10市場:2023-2029年Global and United States Boron-10 Market Report & Forecast 2023-2029 |
||||||
|
|
|||||||
カスタマイズ可能
適宜更新あり
|
|||||||


| 世界および米国のホウ素-10市場:2023-2029年 |
|
出版日: 2023年09月06日
発行: QYResearch
ページ情報: 英文 131 Pages
納期: 2~3営業日
|

- 全表示
- 概要
- 図表
- 目次
世界のホウ素-10の市場規模は、収益ベースで2022年の3,898万米ドルから、予測期間中は8.53%のCAGRで推移し、2029年には7,247万米ドルの規模に成長すると予測されています。
米国のホウ素-10の市場規模は、収益ベースで2022年1,061万米ドルから、5.00%のCAGRで推移し、2029年には1,436万米ドルの規模に成長すると予測されています。
世界の主要企業5社による2022年の収益シェアは全体の91.68%を占めています。
当レポートでは、世界および米国のホウ素-10の市場を調査し、市場および製品の概要、競合情勢、市場規模の推移・予測、各種区分・地域/主要国別の詳細分析、価格動向、市場成長への各種影響因子の分析、主要企業の分析などをまとめています。
目次
第1章 調査範囲
- ホウ素-10:製品概要
- 世界のホウ素-10の見通し:2018 vs 2022 vs 2029
- 米国のホウ素-10の見通し:2018 vs 2022 vs 2029
- 市場規模:米国 vs 世界:2018 vs 2022 vs 2029
- 市場力学
- 産業動向
- 市場促進要因
- 市場課題
- 市場抑制要因
- 前提・制限
- 調査目的
- 調査年数
第2章 ホウ素-10市場:タイプ別
- ホウ素-10市場:タイプ別
- ホウ素元素
- ホウ素-10酸
- その他
- 世界市場の規模
- 販売量
- 販売額
- 平均販売価格(ASP)
- 米国市場の規模
- 販売量
- 販売額
- 平均販売価格(ASP)
第3章 ホウ素-10市場:用途別
- ホウ素-10市場:用途別
- 原子力
- 防衛
- 医療
- 世界市場の規模
- 販売量
- 販売額
- 平均販売価格(ASP)
- 米国市場の規模
- 販売量
- 販売額
- 平均販売価格(ASP)
第4章 ホウ素-10市場の競合情勢:企業別
- 市場規模:企業別
- 市場集中度(CR)
- 世界の主要製造業者:製造拠点の分布・本社
- 世界の主要製造業者:提供製品・用途
- 世界の主要製造業者:業界参入日
- 製造業者のM&A・拡張計画
- 米国市場の規模:企業別
第5章 世界のホウ素-10市場の規模:地域別
- 市場規模:2018 vs 2022 vs 2029
- 販売量の推移・予測
- 販売額の推移・予測
第6章 南北アメリカ
第7章 欧州・中東・アフリカ
第8章 中国
第9章 アジア太平洋
第10章 企業プロファイル
- 3M
- Stella Chemifa
- Dalian Boronten Sci&Tech
- NHTC
- Liaoning Honghao Chemical Industry
- Heavy Water Board(HWB)
- Shandong Chengwu Yixin
第11章 産業チェーンと販売チャネルの分析
- 産業チェーン分析
- 主な原材料
- 製造モードとプロセス
- 販売およびマーケティング
- 顧客
第12章 調査結果・総論
第13章 付録
List of Tables
- Table 1. Boron-10 CAGR in Value, United States VS Global, 2018 VS 2023 VS 2029
- Table 2. Boron-10 Market Trends
- Table 3. Boron-10 Market Drivers
- Table 4. Boron-10 Market Challenges
- Table 5. Global Boron-10 Sales Growth Rate (CAGR) by Type: 2018 VS 2023 VS 2029 (US$ Million)
- Table 6. Global Boron-10 Sales in Value by Type (2018-2023) & (US$ Million)
- Table 7. Global Boron-10 Sales in Value by Type (2024-2029) & (US$ Million)
- Table 8. Global Boron-10 Sales by Type (2018-2023) & (Kg)
- Table 9. Global Boron-10 Sales by Type (2024-2029) & (Kg)
- Table 10. Global Boron-10 Price by Type (2018-2023) & (US$/Kg)
- Table 11. Global Boron-10 Price by Type (2024-2029) & (US$/Kg)
- Table 12. United States Boron-10 Sales Growth Rate (CAGR) by Type: 2018 VS 2023 VS 2029 (US$ Million)
- Table 13. United States Boron-10 Sales in Value by Type (2018-2023) & (US$ Million)
- Table 14. United States Boron-10 Sales in Value by Type (2024-2029) & (US$ Million)
- Table 15. United States Boron-10 Sales by Type (2018-2023) & (Kg)
- Table 16. United States Boron-10 Sales by Type (2024-2029) & (Kg)
- Table 17. United States Boron-10 Price by Type (2018-2023) & (US$/Kg)
- Table 18. United States Boron-10 Price by Type (2024-2029) & (US$/Kg)
- Table 19. Global Boron-10 Sales Growth Rate (CAGR) by Application: 2018 VS 2023 VS 2029 (US$ Million)
- Table 20. Global Boron-10 Sales in Value by Application (2018-2022) & (US$ Million)
- Table 21. Global Boron-10 Sales in Value by Application (2023-2029) & (US$ Million)
- Table 22. Global Boron-10 Sales by Application (2018-2023) & (Kg)
- Table 23. Global Boron-10 Sales by Application (2024-2029) & (Kg)
- Table 24. Global Boron-10 Price by Application (2018-2023) & (US$/Kg)
- Table 25. Global Boron-10 Price by Application (2024-2029) & (US$/Kg)
- Table 26. United States Boron-10 Sales Growth Rate (CAGR) by Application: 2018 VS 2023 VS 2029 (US$ Million)
- Table 27. United States Boron-10 Sales in Value by Application (2018-2023) & (US$ Million)
- Table 28. United States Boron-10 Sales in Value by Application (2024-2029) & (US$ Million)
- Table 29. United States Boron-10 Sales by Application (2018-2023) & (Kg)
- Table 30. United States Boron-10 Sales by Application (2024-2029) & (Kg)
- Table 31. United States Boron-10 Price by Application (2018-2023) & (US$/Kg)
- Table 32. United States Boron-10 Price by Application (2024-2029) & (US$/Kg)
- Table 33. Global Key Manufacturers of Boron-10, Ranked by Revenue (2022) & (US$ Million)
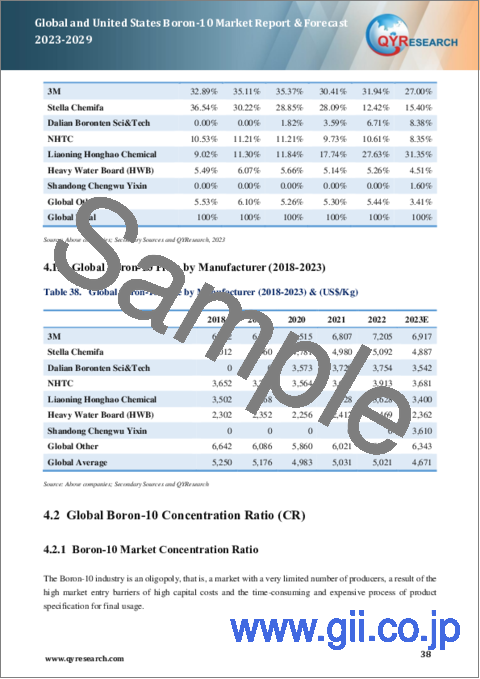
- Table 34. Global Boron-10 Revenue by Manufacturer, (US$ Million) & (2018-2023)
- Table 35. Global Boron-10 Revenue Share by Manufacturer, 2018-2023
- Table 36. Global Boron-10 Sales by Manufacturer, (Kg), 2018-2023
- Table 37. Global Boron-10 Sales Share by Manufacturer, 2018-2023
- Table 38. Global Boron-10 Price by Manufacturer (2018-2023) & (US$/Kg)
- Table 39. Global Boron-10 by Company Type (Tier 1, Tier 2, and Tier 3) & (based on the Revenue in Boron-10 as of 2022)
- Table 40. Global Key Manufacturers of Boron-10, Manufacturing Base Distribution and Headquarters
- Table 41. Global Key Manufacturers of Boron-10, Product Offered and Application
- Table 42. Global Key Manufacturers of Boron-10, Date of Enter into This Industry
- Table 43. Manufacturers Mergers & Acquisitions, Expansion Plans
- Table 44. Key Players of Boron-10 in United States, Ranked by Revenue (2022) & (US$ million)
- Table 45. United States Boron-10 Revenue by Players, (US$ Million) & (2018-2023)
- Table 46. United States Boron-10 Revenue Share by Players, (2018-2023)
- Table 47. United States Boron-10 Sales by Players, (Kg) & (2018-2023)
- Table 48. United States Boron-10 Sales Share by Players, (2018-2023)
- Table 49. Global Boron-10 Market Size Growth Rate (CAGR) by Region (US$ Million): 2018 VS 2023 VS 2029
- Table 50. Global Boron-10 Sales in Volume by Region (2018-2023) & (Kg)
- Table 51. Global Boron-10 Sales in Volume Forecast by Region (2023-2029) & (Kg)
- Table 52. Global Boron-10 Sales in Value by Region (2018-2023) & (US$ Million)
- Table 53. Global Boron-10 Sales in Value Forecast by Region (2023-2029) & (US$ Million)
- Table 54. Americas Boron-10 Sales by Type (2018-2023) & (Kg)
- Table 55. Americas Boron-10 Sales by Type (2024-2029) & (Kg)
- Table 56. Americas Boron-10 Sales by Application (2018-2023) & (Kg)
- Table 57. Americas Boron-10 Sales by Application (2024-2029) & (Kg)
- Table 58. Americas Boron-10 Market Size Growth Rate (CAGR) by Country (US$ Million): 2018 VS 2023 VS 2029
- Table 59. Americas Boron-10 Sales in Value by Country (2018-2023) & (US$ Million)
- Table 60. Americas Boron-10 Sales in Value by Country (2024-2029) & (US$ Million)
- Table 61. Americas Boron-10 Sales in Volume by Country (2018-2023) & (Kg)
- Table 62. Americas Boron-10 Sales in Volume by Country (2024-2029) & (Kg)
- Table 63. EMEA Boron-10 Sales by Type (2018-2023) & (Kg)
- Table 64. EMEA Boron-10 Sales by Type (2024-2029) & (Kg)
- Table 65. EMEA Boron-10 Sales by Application (2018-2023) & (Kg)
- Table 66. EMEA Boron-10 Sales by Application (2024-2029) & (Kg)
- Table 67. EMEA Boron-10 Market Size Growth Rate (CAGR) by Country (US$ Million): 2018 VS 2023 VS 2029
- Table 68. EMEA Boron-10 Sales in Value by Country (2018-2023) & (US$ Million)
- Table 69. EMEA Boron-10 Sales in Value by Country (2024-2029) & (US$ Million)
- Table 70. EMEA Boron-10 Sales in Volume by Country (2018-2023) & (Kg)
- Table 71. EMEA Boron-10 Sales in Volume by Country (2024-2029) & (Kg)
- Table 72. China Boron-10 Sales by Type (2018-2023) & (Kg)
- Table 73. China Boron-10 Sales by Type (2024-2029) & (Kg)
- Table 74. China Boron-10 Sales by Application (2018-2023) & (Kg)
- Table 75. China Boron-10 Sales by Application (2024-2029) & (Kg)
- Table 76. APAC Boron-10 Sales by Type (2018-2023) & (Kg)
- Table 77. APAC Boron-10 Sales by Type (2024-2029) & (Kg)
- Table 78. APAC Boron-10 Sales by Application (2018-2023) & (Kg)
- Table 79. APAC Boron-10 Sales by Application (2024-2029) & (Kg)
- Table 80. APAC Boron-10 Market Size Growth Rate (CAGR) by Country (US$ Million): 2018 VS 2023 VS 2029
- Table 81. APAC Boron-10 Sales in Value by Country (2018-2023) & (US$ Million)
- Table 82. APAC Boron-10 Sales in Value by Country (2024-2029) & (US$ Million)
- Table 83. APAC Boron-10 Sales in Volume by Country (2018-2023) & (Kg)
- Table 84. APAC Boron-10 Sales in Volume by Country (2024-2029) & (Kg)
- Table 85. 3M Company Information
- Table 86. 3M Description and Business Overview
- Table 87. 3M Boron-10 Sales (Kg), Revenue (US$ Million), Price (US$/Kg) and Gross Margin (2018-2023)
- Table 88. 3M Boron-10 Product
- Table 89. Stella Chemifa Company Information
- Table 90. Stella Chemifa Description and Business Overview
- Table 91. Stella Chemifa Boron-10 Sales (Kg), Revenue (US$ Million), Price (US$/Kg) and Gross Margin (2018-2023)
- Table 92. Stella Chemifa Boron-10 Product
- Table 93. Dalian Boronten Sci&Tech Company Information
- Table 94. Dalian Boronten Sci&Tech Description and Business Overview
- Table 95. Dalian Boronten Sci&Tech Boron-10 Sales (Kg), Revenue (US$ Million), Price (US$/Kg) and Gross Margin (2018-2023)
- Table 96. Dalian Boronten Sci&Tech Boron-10 Product
- Table 97. NHTC Company Information
- Table 98. NHTC Description and Business Overview
- Table 99. NHTC Boron-10 Sales (Kg), Revenue (US$ Million), Price (US$/Kg) and Gross Margin (2018-2023)
- Table 100. NHTC Boron-10 Product
- Table 101. Liaoning Honghao Chemical Industry Company Information
- Table 102. Liaoning Honghao Chemical Industry Description and Business Overview
- Table 103. Liaoning Honghao Chemical Industry Boron-10 Sales (Kg), Revenue (US$ Million), Price (US$/Kg) and Gross Margin (2018-2023)
- Table 104. Liaoning Honghao Chemical Industry Boron-10 Product
- Table 105. Heavy Water Board (HWB) Company Information
- Table 106. Heavy Water Board (HWB) Description and Business Overview
- Table 107. Heavy Water Board (HWB) Boron-10 Sales (Kg), Revenue (US$ Million), Price (US$/Kg) and Gross Margin (2018-2023)
- Table 108. Heavy Water Board (HWB) Boron-10 Product
- Table 109. Shandong Chengwu Yixin Company Information
- Table 110. Shandong Chengwu Yixin Description and Business Overview
- Table 111. Shandong Chengwu Yixin Boron-10 Sales (Kg), Revenue (US$ Million), Price (US$/Kg) and Gross Margin (2018-2023)
- Table 112. Shandong Chengwu Yixin Boron-10 Product
- Table 113. Key Raw Materials Lists
- Table 114. Raw Materials Key Suppliers Lists
- Table 115. Boron-10 Distributors List
- Table 116. Boron-10 Customers List
- Table 117. Research Programs/Design for This Report
- Table 118. Key Data Information from Secondary Sources
- Table 119. Key Data Information from Primary Sources
- Table 120. QYR Business Unit and Senior & Team Lead Analysts
List of Figures
- Figure 1. Boron-10 Product Picture
- Figure 2. Global Boron-10 Revenue, (US$ Million), 2018 VS 2023 VS 2029
- Figure 3. Global Boron-10 Market Size 2018-2029 (US$ Million)
- Figure 4. Global Boron-10 Sales 2018-2029 (Kg)
- Figure 5. United States Boron-10 Revenue, (US$ Million), 2018 VS 2023 VS 2029
- Figure 6. United States Boron-10 Market Size 2018-2029 (US$ Million)
- Figure 7. United States Boron-10 Sales 2018-2029 (Kg)
- Figure 8. United States Boron-10 Market Share in Global, in Value (US$ Million) 2018-2029
- Figure 9. United States Boron-10 Market Share in Global, in Volume (Kg) 2018-2029
- Figure 10. In 2021 nuclear plants supplied 2653 TWh of electricity, up from 2553 TWh in 2020
- Figure 11. Boron-10 Report Years Considered
- Figure 12. Product Picture of Elemental Boron 10
- Figure 13. Product Picture of Boron 10 Acid
- Figure 14. Global Boron-10 Market Share by Type in 2022 & 2029
- Figure 15. Global Boron-10 Sales Market Share in Value by Type (2018-2029)
- Figure 16. Global Boron-10 Sales Market Share in Volume by Type (2018-2029)
- Figure 17. United States Boron-10 Market Share by Type in 2022 & 2029
- Figure 18. United States Boron-10 Sales Market Share in Value by Type (2018-2029)
- Figure 19. United States Boron-10 Sales Market Share in Volume by Type (2018-2029)
- Figure 20. Product Picture of Nuclear Industry
- Figure 21. Product Picture of Defence Industry
- Figure 22. Product Picture of Medical Treatment
- Figure 23. Global Boron-10 Market Share by Application in 2022 & 2029
- Figure 24. Global Boron-10 Sales Market Share in Value by Application (2018-2029)
- Figure 25. Global Boron-10 Sales Market Share in Volume by Application (2018-2029)
- Figure 26. United States Boron-10 Market Share by Application in 2022 & 2029
- Figure 27. United States Boron-10 Sales Market Share in Value by Application (2018-2029)
- Figure 28. United States Boron-10 Sales Market Share in Volume by Application (2018-2029)
- Figure 29. The Top 5 Largest Manufacturers of Boron-10 in the World: Market Share by Boron-10 Revenue in 2022
- Figure 30. Global Boron-10 Market Size Market Share by Region: 2018 VS 2023 VS 2029
- Figure 31. Global Boron-10 Sales in Volume Market Share by Region (2018-2029)
- Figure 32. Global Boron-10 Sales in Value Market Share by Region (2018-2029)
- Figure 33. Americas Boron-10 Sales in Volume Growth Rate 2018-2029 (Kg)
- Figure 34. Americas Boron-10 Sales in Value Growth Rate 2018-2029 (US$ Million)
- Figure 35. Americas Boron-10 Sales Market Share in Volume by Type (2018-2029)
- Figure 36. Americas Boron-10 Sales Market Share in Volume by Application (2018-2029)
- Figure 37. United States Boron-10 Sales in Value Growth Rate (2018-2029) & (US$ Million)
- Figure 38. Canada Boron-10 Sales in Value Growth Rate (2018-2029) & (US$ Million)
- Figure 39. Mexico Boron-10 Sales in Value Growth Rate (2018-2029) & (US$ Million)
- Figure 40. Brazil Boron-10 Sales in Value Growth Rate (2018-2029) & (US$ Million)
- Figure 41. EMEA Boron-10 Sales in Volume Growth Rate 2018-2029 (Kg)
- Figure 42. EMEA Boron-10 Sales in Value Growth Rate 2018-2029 (US$ Million)
- Figure 43. EMEA Boron-10 Sales Market Share in Volume by Type (2018-2029)
- Figure 44. EMEA Boron-10 Sales Market Share in Volume by Application (2018-2029)
- Figure 45. Europe Boron-10 Sales in Value Growth Rate (2018-2029) & (US$ Million)
- Figure 46. Middle East Boron-10 Sales in Value Growth Rate (2018-2029) & (US$ Million)
- Figure 47. Africa Boron-10 Sales in Value Growth Rate (2018-2029) & (US$ Million)
- Figure 48. China Boron-10 Sales in Volume Growth Rate 2018-2029 (Kg)
- Figure 49. China Boron-10 Sales in Value Growth Rate 2018-2029 (US$ Million)
- Figure 50. China Boron-10 Sales Market Share in Volume by Type (2018-2029)
- Figure 51. China Boron-10 Sales Market Share in Volume by Application (2018-2029)
- Figure 52. APAC Boron-10 Sales in Volume Growth Rate 2018-2029 (Kg)
- Figure 53. APAC Boron-10 Sales in Value Growth Rate 2018-2029 (US$ Million)
- Figure 54. APAC Boron-10 Sales Market Share in Volume by Type (2018-2029)
- Figure 55. APAC Boron-10 Sales Market Share in Volume by Application (2018-2029)
- Figure 56. Japan Boron-10 Sales in Value Growth Rate (2018-2029) & (US$ Million)
- Figure 57. South Korea Boron-10 Sales in Value Growth Rate (2018-2029) & (US$ Million)
- Figure 58. Southeast Asia Boron-10 Sales in Value Growth Rate (2018-2029) & (US$ Million)
- Figure 59. India Boron-10 Sales in Value Growth Rate (2018-2029) & (US$ Million)
- Figure 60. Boron-10 Value Chain
- Figure 61. Channels of Distribution
- Figure 62. Distributors Profiles
- Figure 63. Bottom-up and Top-down Approaches for This Report
- Figure 64. Data Triangulation
- Figure 65. Key Executives Interviewed
The global Boron-10 revenue was US$ 38.98 million in 2022 and is forecast to a readjusted size of US$ 72.47 million by 2029 with a CAGR of 8.53% during the review period (2023-2029).
In United States the Boron-10 revenue is expected to grow from US$ 10.61 million in 2022 to US$ 14.36 million by 2029, at a CAGR of 5.00% during the forecast period (2023-2029).
This report focuses on global and United States Boron-10 market, also covers the segmentation data of other regions in regional level and county level.
The global key players of Boron-10 include: 3M, Stella Chemifa, Dalian Boronten Sci&Tech and NHTC. The global five biggest players hold a share of 91.68% in 2022.
Scope and Market Size:
Boron-10 market is segmented in regional and country level, by players, by Type, and by Application. Companies, stakeholders, and other participants in the global Boron-10 market will be able to gain the upper hand as they use the report as a powerful resource. The segmental analysis focuses on sales, revenue and forecast by Type and by Application for the period 2018-2029.
For United States market, this report focuses on the Boron-10 market size by players, by Type, and by Application, for the period 2018-2029. The key players include the global and local players which play important roles in United States.
By Company
- 3M
- Stella Chemifa
- Dalian Boronten Sci&Tech
- NHTC
- Liaoning Honghao Chemical
- Heavy Water Board (HWB)
- Shandong Chengwu Yixin
Segment by Type
- Elemental Boron 10
- Boron 10 Acid
- Other
Segment by Application
- Nuclear Industry
- Defence Industry
- Medical Treatment
- Others
By Region
- Americas
- United States
- Canada
- Mexico
- Brazil
- China
- APAC (excluding China)
- Japan
- South Korea
- SEA
- India
Table of Contents
1 Study Coverage
- 1.1 Boron-10 Product Introduction
- 1.2 Global Boron-10 Outlook 2018 VS 2023 VS 2029
- 1.2.1 Global Boron-10 Sales in US$ Million for the Year 2018-2029
- 1.2.2 Global Boron-10 Sales in Volume for the Year 2018-2029
- 1.3 United States Boron-10 Outlook 2018 VS 2023 VS 2029
- 1.3.1 United States Boron-10 Sales in US$ Million for the Year 2018-2029
- 1.3.2 United States Boron-10 Sales in Volume for the Year 2018-2029
- 1.4 Boron-10 Market Size, United States VS Global, 2018 VS 2023 VS 2029
- 1.4.1 The Market Share of United States Boron-10 in Global, 2018 VS 2023 VS 2029
- 1.4.2 The Growth Rate of Boron-10 Market Size, United States VS Global, 2018 VS 2023 VS 2029
- 1.5 Boron-10 Market Dynamics
- 1.5.1 Boron-10 Industry Trends
- 1.5.2 Boron-10 Market Drivers
- 1.5.3 Boron-10 Market Challenges
- 1.5.4 Boron-10 Market Restraints
- 1.6 Assumptions and Limitations
- 1.7 Study Objectives
- 1.8 Years Considered
2 Boron-10 by Type
- 2.1 Boron-10 Market by Type
- 2.1.1 Elemental Boron 10
- 2.1.2 Boron 10 Acid
- 2.1.3 Other
- 2.2 Global Boron-10 Market Size by Type
- 2.2.1 Global Boron-10 Sales in Value, by Type (2018, 2022 & 2029)
- 2.2.2 Global Boron-10 Sales in Volume, by Type (2018, 2022 & 2029)
- 2.2.3 Global Boron-10 Average Selling Price (ASP) by Type (2018, 2022 & 2029)
- 2.3 United States Boron-10 Market Size by Type
- 2.3.1 United States Boron-10 Sales in Value, by Type (2018, 2022 & 2029)
- 2.3.2 United States Boron-10 Sales in Volume, by Type (2018, 2022 & 2029)
- 2.3.3 United States Boron-10 Average Selling Price (ASP) by Type (2018, 2022 & 2029)
3 Boron-10 by Application
- 3.1 Boron-10 Market by Application
- 3.1.1 Nuclear Industry
- 3.1.2 Defence Industry
- 3.1.3 Medical Treatment
- 3.2 Global Boron-10 Market Size by Application
- 3.2.1 Global Boron-10 Sales in Value, by Application (2018, 2022 & 2029)
- 3.2.2 Global Boron-10 Sales in Volume, by Application (2018, 2022 & 2029)
- 3.2.3 Global Boron-10 Average Selling Price (ASP) by Application (2018, 2022 & 2029)
- 3.3 United States Boron-10 Market Size by Application
- 3.3.1 United States Boron-10 Sales in Value, by Application (2018, 2022 & 2029)
- 3.3.2 United States Boron-10 Sales in Volume, by Application (2018, 2022 & 2029)
- 3.3.3 United States Boron-10 Average Selling Price (ASP) by Application (2018, 2022 & 2029)
4 Global Boron-10 Competitor Landscape by Company
- 4.1 Global Boron-10 Market Size by Company
- 4.1.1 Global Key Manufacturers of Boron-10, Ranked by Revenue (2022)
- 4.1.2 Global Boron-10 Revenue by Manufacturer (2018-2023)
- 4.1.3 Global Boron-10 Sales by Manufacturer (2018-2023)
- 4.1.4 Global Boron-10 Price by Manufacturer (2018-2023)
- 4.2 Global Boron-10 Concentration Ratio (CR)
- 4.2.1 Boron-10 Market Concentration Ratio
- 4.2.2 Global Top 5 Largest Manufacturers of Boron-10 in 2022
- 4.2.3 Global Boron-10 Market Share by Company Type (Tier 1, Tier 2, and Tier 3)
- 4.3 Global Key Manufacturers of Boron-10, Manufacturing Base Distribution and Headquarters
- 4.4 Global Key Manufacturers of Boron-10, Product Offered and Application
- 4.5 Global Key Manufacturers of Boron-10, Date of Enter into This Industry
- 4.6 Manufacturers Mergers & Acquisitions, Expansion Plans
- 4.7 United States Boron-10 Market Size by Company
- 4.7.1 Key Players of Boron-10 in United States, Ranked by Revenue (2022)
- 4.7.2 United States Boron-10 Revenue by Players (2018-2023)
- 4.7.3 United States Boron-10 Sales by Players (2018-2023)
5 Global Boron-10 Market Size by Region
- 5.1 Global Boron-10 Market Size by Region: 2018 VS 2023 VS 2029
- 5.2 Global Boron-10 Market Size in Volume by Region (2018-2029)
- 5.2.1 Global Boron-10 Sales in Volume by Region: 2018-2023
- 5.2.2 Global Boron-10 Sales in Volume Forecast by Region (2023-2029)
- 5.3 Global Boron-10 Market Size in Value by Region (2018-2029)
- 5.3.1 Global Boron-10 Sales in Value by Region: 2018-2023
- 5.3.2 Global Boron-10 Sales in Value by Region: 2023-2029
6 Americas
- 6.1 Americas Boron-10 Market Size YoY Growth 2018-2029
- 6.2 Americas Boron-10 Sales in Volume, by Type (2018, 2022 & 2029)
- 6.3 Americas Boron-10 Sales in Volume, by Application (2018, 2022 & 2029)
- 6.4 Americas Boron-10 Market Facts & Figures by Country (2018, 2022 & 2029)
- 6.4.1 Americas Boron-10 Sales in Value by Country (2018, 2022 & 2029)
- 6.4.2 Americas Boron-10 Sales in Volume by Country (2018, 2022 & 2029)
- 6.4.3 United States
- 6.4.4 Canada
- 6.4.5 Mexico
- 6.4.6 Brazil
7 EMEA
- 7.1 EMEA Boron-10 Market Size YoY Growth 2018-2029
- 7.2 EMEA Boron-10 Sales in Volume, by Type (2018, 2022 & 2029)
- 7.3 EMEA Boron-10 Sales in Volume, by Application (2018, 2022 & 2029)
- 7.4 EMEA Boron-10 Market Facts & Figures by Country (2018, 2022 & 2029)
- 7.4.1 EMEA Boron-10 Sales in Value by Country (2018, 2022 & 2029)
- 7.4.2 EMEA Boron-10 Sales in Volume by Country (2018, 2022 & 2029)
- 7.4.3 Europe
- 7.4.4 Middle East
- 7.4.5 Africa
8 China
- 8.1 China Boron-10 Market Size YoY Growth 2018-2029
- 8.2 China Boron-10 Sales in Volume, by Type (2018, 2022 & 2029)
- 8.3 China Boron-10 Sales in Volume, by Application (2018, 2022 & 2029)
9 APAC
- 9.1 APAC Boron-10 Market Size YoY Growth 2018-2029
- 9.2 APAC Boron-10 Sales in Volume, by Type (2018, 2022 & 2029)
- 9.3 APAC Boron-10 Sales in Volume, by Application (2018, 2022 & 2029)
- 9.4 APAC Boron-10 Market Facts & Figures by Country (2018, 2022 & 2029)
- 9.4.1 APAC Boron-10 Sales in Value by Country (2018, 2022 & 2029)
- 9.4.2 APAC Boron-10 Sales in Volume by Country (2018, 2022 & 2029)
- 9.4.3 Japan
- 9.4.4 South Korea
- 9.4.5 Southeast Asia
- 9.4.6 India
10 Company Profiles
- 10.1 3M
- 10.1.1 3M Company Information
- 10.1.2 3M Description and Business Overview
- 10.1.3 3M Boron-10 Sales, Revenue and Gross Margin (2018-2023)
- 10.1.4 3M Boron-10 Products Offered
- 10.2 Stella Chemifa
- 10.2.1 Stella Chemifa Company Information
- 10.2.2 Stella Chemifa Description and Business Overview
- 10.2.3 Stella Chemifa Boron-10 Sales, Revenue and Gross Margin (2018-2023)
- 10.2.4 Stella Chemifa Boron-10 Products Offered
- 10.3 Dalian Boronten Sci&Tech
- 10.3.1 Dalian Boronten Sci&Tech Company Information
- 10.3.2 Dalian Boronten Sci&Tech Description and Business Overview
- 10.3.3 Dalian Boronten Sci&Tech Boron-10 Sales, Revenue and Gross Margin (2018-2023)
- 10.3.4 Dalian Boronten Sci&Tech Boron-10 Products Offered
- 10.4 NHTC
- 10.4.1 NHTC Company Information
- 10.4.2 NHTC Description and Business Overview
- 10.4.3 NHTC Boron-10 Sales, Revenue and Gross Margin (2018-2023)
- 10.4.4 NHTC Boron-10 Products Offered
- 10.5 Liaoning Honghao Chemical Industry
- 10.5.1 Liaoning Honghao Chemical Industry Company Information
- 10.5.2 Liaoning Honghao Chemical Industry Description and Business Overview
- 10.5.3 Liaoning Honghao Chemical Industry Boron-10 Sales, Revenue and Gross Margin (2018-2023)
- 10.5.4 Liaoning Honghao Chemical Industry Boron-10 Products Offered
- 10.6 Heavy Water Board (HWB)
- 10.6.1 Heavy Water Board (HWB) Company Information
- 10.6.2 Heavy Water Board (HWB) Description and Business Overview
- 10.6.3 Heavy Water Board (HWB) Boron-10 Sales, Revenue and Gross Margin (2018-2023)
- 10.6.4 Heavy Water Board (HWB) Boron-10 Products Offered
- 10.7 Shandong Chengwu Yixin
- 10.7.1 Shandong Chengwu Yixin Company Information
- 10.7.2 Shandong Chengwu Yixin Description and Business Overview
- 10.7.3 Shandong Chengwu Yixin Boron-10 Sales, Revenue and Gross Margin (2018-2023)
- 10.7.4 Shandong Chengwu Yixin Boron-10 Products Offered
11 Industry Chain and Sales Channels Analysis
- 11.1 Boron-10 Industry Chain Analysis
- 11.2 Boron-10 Key Raw Materials
- 11.2.1 Key Raw Materials
- 11.2.2 Raw Materials Key Suppliers
- 11.3 Boron-10 Production Mode & Process
- 11.4 Boron-10 Sales and Marketing
- 11.4.1 Boron-10 Sales Channels
- 11.4.2 Boron-10 Distributors
- 11.5 Boron-10 Customers
12 Research Findings and Conclusion
13 Appendix
- 13.1 Research Methodology
- 13.1.1 Methodology/Research Approach
- 13.1.2 Data Source
- 13.2 Author Details
- 13.3 Disclaimer
