|
|
市場調査レポート
商品コード
1313266
ショッププライマーの世界市場:実績と予測(2018年~2029年)Global Shop Primer Market Report, History and Forecast 2018-2029 |
||||||
カスタマイズ可能
適宜更新あり
|
|||||||


| ショッププライマーの世界市場:実績と予測(2018年~2029年) |
|
出版日: 2023年07月21日
発行: QYResearch
ページ情報: 英文 190 Pages
納期: 2~3営業日
|

- 全表示
- 概要
- 図表
- 目次
世界のショッププライマーの市場規模は、2022年に7億7,734万米ドルとなりました。
同市場は、予測期間の2023年~2029年に4.93%のCAGRで拡大し、2029年には11億1,849万米ドルに達すると予測されています。
当レポートでは、世界のショッププライマー市場について調査し、市場の概要とともに、企業別、タイプ別、用途別、地域別の動向、および市場に参入する企業のプロファイルなどを提供しています。
目次
第1章 ショッププライマー市場概要
第2章 企業によるショッププライマー市場競争
第3章 ショッププライマーの状況と見通し、地域別
- 世界のショッププライマー市場規模とCAGR:2018年VS2022年VS2029年、地域別
- 世界のショッププライマー市場規模実績、地域別
- 世界のショッププライマー市場規模予測
第4章 ショッププライマー、用途別
第5章 北米のショッププライマー、国別
第6章 欧州のショッププライマー、国別
第7章 アジア太平洋のショッププライマー、地域別
第8章 ラテンアメリカのショッププライマー、国別
第9章 中東・アフリカのショッププライマー、国別
第10章 企業プロファイル
- AkzoNobel
- Sherwin-Williams
- PPG Industries
- Nippon Paint
- Kansai Paint
- Jotun
- BASF
- Hempel
- Chugoku Marine Paints
- Fixall(ICP Group)
- Rust-Oleum
- Tnemec
- Zhuzhou Feilu
- BESA
- Kelly-Moore Paints
- Yejian New Material
- Cloverdale Paint
- Tianjin Jinhai
- Grand Polycoats
- ZINDN
第11章 上流、機会、課題、リスクおよび影響要因の分析
第12章 マーケティング戦略分析、販売代理店
第13章 調査結果と結論
第14章 付録
List of Tables
- Table 1. Global Shop Primer Sales by Type: 2018 VS 2022 VS 2029 (US$ Million)
- Table 2. Global Shop Primer Sales by Type (2018-2023) & (Tons)
- Table 3. Global Shop Primer Sales Market Share in Volume by Type (2018-2023)
- Table 4. Global Shop Primer Sales by Type (2018-2023) & (US$ Million)
- Table 5. Global Shop Primer Sales Market Share in Value by Type (2018-2023)
- Table 6. Global Shop Primer Price by Type (2018-2023) & (US$/Ton)
- Table 7. Global Shop Primer Sales by Type (2024-2029) & (Tons)
- Table 8. Global Shop Primer Sales Market Share in Volume by Type (2024-2029)
- Table 9. Global Shop Primer Sales by Type (2024-2029) & (US$ Million)
- Table 10. Global Shop Primer Sales Market Share in Value by Type (2024-2029)
- Table 11. Global Shop Primer Price by Type (2024-2029) & (US$/Ton)
- Table 12. North America Shop Primer Sales by Type (2018-2023) & (Tons)
- Table 13. North America Shop Primer Sales by Type (2018-2023) & (US$ Million)
- Table 14. Europe Shop Primer Sales (Tons) by Type (2018-2023)
- Table 15. Europe Shop Primer Sales by Type (2018-2023) & (US$ Million)
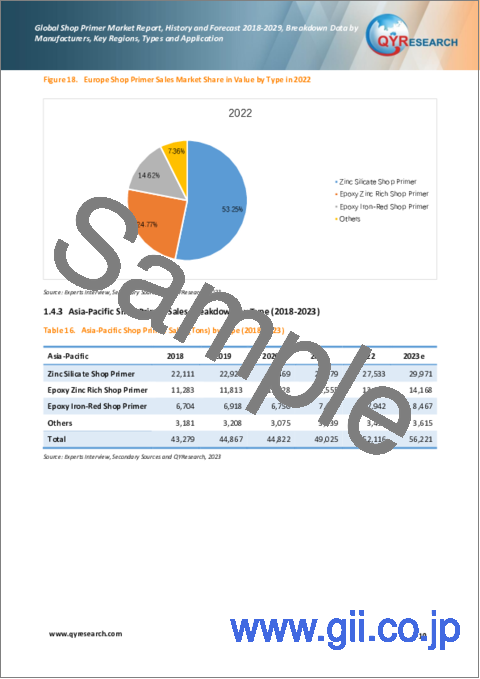
- Table 16. Asia-Pacific Shop Primer Sales (Tons) by Type (2018-2023)
- Table 17. Asia-Pacific Shop Primer Sales by Type (2018-2023) & (US$ Million)
- Table 18. Latin America Shop Primer Sales (Tons) by Type (2018-2023)
- Table 19. Latin America Shop Primer Sales by Type (2018-2023) & (US$ Million)
- Table 20. Middle East and Africa Shop Primer Sales (Tons) by Type (2018-2023)
- Table 21. Middle East and Africa Shop Primer Sales by Type (2018-2023) & (US$ Million)
- Table 22. Global Shop Primer Sales by Company (2018-2023) & (Tons)
- Table 23. Global Shop Primer Sales Share by Company (2018-2023)
- Table 24. Global Shop Primer Sales Share by Company in 2022
- Table 25. Global Shop Primer Revenue by Company (2018-2023) & (US$ Million)
- Table 26. Global Shop Primer Revenue Share by Company (2018-2023)
- Table 27. Global Shop Primer Revenue Share by Company in 2022
- Table 28. Global Market Shop Primer Price by Company (2018-2023) & (US$/Ton)
- Table 29. Global Shop Primer Top Manufacturers Headquarters and Sales Area
- Table 30. Global Shop Primer Manufacturers Market Concentration Ratio (CR5)
- Table 31. Global Top Manufacturers Market Share by Company Type (Tier 1, Tier 2, and Tier 3) & (based on the Revenue in Shop Primer as of 2022)
- Table 32. Establish Date of Key Shop Primer Manufacturers
- Table 33. Key Manufacturers Shop Primer Product Type
- Table 34. Mergers & Acquisitions, Expansion Plans
- Table 35. Global Shop Primer Market Size Comparison by Region (US$ Million): 2018 VS 2022 VS 2029
- Table 36. Global Shop Primer Sales by Region (2018-2023) & (Tons)
- Table 37. Global Shop Primer Sales Market Share in Volume by Region (2018-2023)
- Table 38. Global Shop Primer Sales by Region (2018-2023) & (US$ Million)
- Table 39. Global Shop Primer Sales Market Share in Value by Region (2018-2023)
- Table 40. Global Shop Primer Sales (Tons), Value (US$ Million) and Price (US$/Ton) (2018-2023)
- Table 41. Global Shop Primer Sales by Region (2024-2029) & (Tons)
- Table 42. Global Shop Primer Sales Market Share in Volume by Region (2024-2029)
- Table 43. Global Shop Primer Sales by Region (2024-2029) & (US$ Million)
- Table 44. Global Shop Primer Sales Market Share in Value by Region (2024-2029)
- Table 45. Global Shop Primer Sales (Tons), Value (US$ Million) and Price (US$/Ton) (2024-2029)
- Table 46. Global Shop Primer Sales by Application: 2018 VS 2022 VS 2029 (US$ Million)
- Table 47. Global Shop Primer Sales by Application (2018-2023) & (Tons)
- Table 48. Global Shop Primer Sales Market Share in Volume by Application (2018-2023)
- Table 49. Global Shop Primer Sales by Application (2018-2023) & (US$ Million)
- Table 50. Global Shop Primer Sales Market Share in Value by Application (2018-2023)
- Table 51. Global Shop Primer Price by Application (2018-2023) & (US$/Ton)
- Table 52. Global Shop Primer Sales by Application (2024-2029) & (Tons)
- Table 53. Global Shop Primer Sales Market Share in Volume by Application (2024-2029)
- Table 54. Global Shop Primer Sales by Application (2024-2029) & (US$ Million)
- Table 55. Global Shop Primer Sales Market Share in Value by Application (2024-2029)
- Table 56. Global Shop Primer Price by Application (2024-2029) & (US$/Ton)
- Table 57. North America Shop Primer Sales by Application (2018-2023) & (Tons)
- Table 58. North America Shop Primer Sales by Application (2018-2023) & (US$ Million)
- Table 59. Europe Shop Primer Sales (Tons) by Application (2018-2023)
- Table 60. Europe Shop Primer Sales by Application (2018-2023) & (US$ Million)
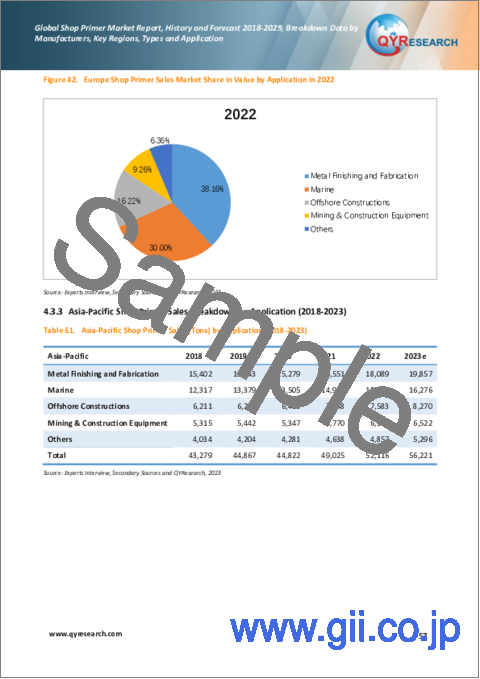
- Table 61. Asia-Pacific Shop Primer Sales (Tons) by Application (2018-2023)
- Table 62. Asia-Pacific Shop Primer Sales by Application (2018-2023) & (US$ Million)
- Table 63. Latin America Shop Primer Sales (Tons) by Application (2018-2023)
- Table 64. Latin America Shop Primer Sales by Application (2018-2023) & (US$ Million)
- Table 65. Middle East and Africa Shop Primer Sales (Tons) by Application (2018-2023)
- Table 66. Middle East and Africa Shop Primer Sales by Application (2018-2023) & (US$ Million)
- Table 67. North America Shop Primer Market Size Growth Rate (CAGR) by Country (US$ Million): 2018 VS 2022 VS 2029
- Table 68. North America Shop Primer Sales by Country (2018-2023) & (Tons)
- Table 69. North America Shop Primer Sales Market Share in Volume by Country (2018-2023)
- Table 70. North America Shop Primer Sales by Country (2018-2023) & (US$ Million)
- Table 71. North America Shop Primer Sales Market Share in Value by Country (2018-2023)
- Table 72. North America Shop Primer Sales by Country (2024-2029) & (Tons)
- Table 73. North America Shop Primer Sales Market Share in Volume by Country (2024-2029)
- Table 74. North America Shop Primer Sales by Country (2024-2029) & (US$ Million)
- Table 75. North America Shop Primer Sales Market Share in Value by Country (2024-2029)
- Table 76. Europe Shop Primer Market Size Growth Rate (CAGR) by Country (US$ Million): 2018 VS 2022 VS 2029
- Table 77. Europe Shop Primer Sales by Country (2018-2023) & (Tons)
- Table 78. Europe Shop Primer Sales Market Share in Volume by Country (2018-2023)
- Table 79. Europe Shop Primer Sales by Country (2018-2023) & (US$ Million)
- Table 80. Europe Shop Primer Sales Market Share in Value by Country (2018-2023)
- Table 81. Europe Shop Primer Sales by Country (2024-2029) & (Tons)
- Table 82. Europe Shop Primer Sales Market Share in Volume by Country (2024-2029)
- Table 83. Europe Shop Primer Sales by Country (2024-2029) & (US$ Million)
- Table 84. Europe Shop Primer Sales Market Share in Value by Country (2024-2029)
- Table 85. Asia-Pacific Shop Primer Market Size Growth Rate (CAGR) by Region (US$ Million): 2018 VS 2022 VS 2029
- Table 86. Asia-Pacific Shop Primer Sales by Region (2018-2023) & (Tons)
- Table 87. Asia-Pacific Shop Primer Sales Market Share in Volume by Region (2018-2023)
- Table 88. Asia-Pacific Shop Primer Sales by Region (2018-2023) & (US$ Million)
- Table 89. Asia-Pacific Shop Primer Sales Market Share in Value by Region (2018-2023)
- Table 90. Asia-Pacific Shop Primer Sales by Region (2024-2029) & (Tons)
- Table 91. Asia-Pacific Shop Primer Sales Market Share in Volume by Region (2024-2029)
- Table 92. Asia-Pacific Shop Primer Sales by Region (2024-2029) & (US$ Million)
- Table 93. Asia-Pacific Shop Primer Sales Market Share in Value by Region (2024-2029)
- Table 94. Latin America Shop Primer Market Size Growth Rate (CAGR) by Country (US$ Million): 2018 VS 2022 VS 2029
- Table 95. Latin America Shop Primer Sales by Country (2018-2023) & (Tons)
- Table 96. Latin America Shop Primer Sales Market Share in Volume by Country (2018-2023)
- Table 97. Latin America Shop Primer Sales by Country (2018-2023) & (US$ Million)
- Table 98. Latin America Shop Primer Sales Market Share in Value by Country (2018-2023)
- Table 99. Latin America Shop Primer Sales by Country (2024-2029) & (Tons)
- Table 100. Latin America Shop Primer Sales Market Share in Volume by Country (2024-2029)
- Table 101. Latin America Shop Primer Sales by Country (2024-2029) & (US$ Million)
- Table 102. Latin America Shop Primer Sales Market Share in Value by Country (2024-2029)
- Table 103. Middle East and Africa Shop Primer Market Size Growth Rate (CAGR) by Country (US$ Million): 2018 VS 2022 VS 2029
- Table 104. Middle East and Africa Shop Primer Sales by Country (2018-2023) & (Tons)
- Table 105. Middle East and Africa Shop Primer Sales Market Share in Volume by Country (2018-2023)
- Table 106. Middle East and Africa Shop Primer Sales by Country (2018-2023) & (US$ Million)
- Table 107. Middle East and Africa Shop Primer Sales Market Share in Value by Country (2018-2023)
- Table 108. Middle East and Africa Shop Primer Sales by Country (2024-2029) & (Tons)
- Table 109. Middle East and Africa Shop Primer Sales Market Share by Country (2024-2029)
- Table 110. Middle East and Africa Shop Primer Sales by Country (2024-2029) & (US$ Million)
- Table 111. Middle East and Africa Shop Primer Sales Market Share in Value by Country (2024-2029)
- Table 112. AkzoNobel Company Information
- Table 113. AkzoNobel Introduction and Business Overview
- Table 114. AkzoNobel Shop Primer Sales (Tons), Revenue (US$ Million), Price (US$/Ton) and Gross Margin (2018-2023)
- Table 115. AkzoNobel Shop Primer Product
- Table 116. AkzoNobel Recent Development
- Table 117. Sherwin-Williams Company Information
- Table 118. Sherwin-Williams Introduction and Business Overview
- Table 119. Sherwin-Williams Shop Primer Sales (Tons), Revenue (US$ Million), Price (US$/Ton) and Gross Margin (2018-2023)
- Table 120. Sherwin-Williams Shop Primer Product
- Table 121. Sherwin-Williams Recent Development
- Table 122. PPG Industries Company Information
- Table 123. PPG Industries Introduction and Business Overview
- Table 124. PPG Industries Shop Primer Sales (Tons), Revenue (US$ Million), Price (US$/Ton) and Gross Margin (2018-2023)
- Table 125. PPG Industries Shop Primer Product
- Table 126. PPG Industries Recent Development
- Table 127. Nippon Paint Company Information
- Table 128. Nippon Paint Introduction and Business Overview
- Table 129. Nippon Paint Shop Primer Sales (Tons), Revenue (US$ Million), Price (US$/Ton) and Gross Margin (2018-2023)
- Table 130. Nippon Paint Shop Primer Product
- Table 131. Nippon Paint Recent Development
- Table 132. Kansai Paint Company Information
- Table 133. Kansai Paint Introduction and Business Overview
- Table 134. Kansai Paint Shop Primer Sales (Tons), Revenue (US$ Million), Price (US$/Ton) and Gross Margin (2018-2023)
- Table 135. Kansai Paint Shop Primer Product
- Table 136. Kansai Paint Recent Development
- Table 137. Jotun Company Information
- Table 138. Jotun Introduction and Business Overview
- Table 139. Jotun Shop Primer Sales (Tons), Revenue (US$ Million), Price (US$/Ton) and Gross Margin (2018-2023)
- Table 140. Jotun Shop Primer Product
- Table 141. BASF Company Information
- Table 142. BASF Introduction and Business Overview
- Table 143. BASF Shop Primer Sales (Tons), Revenue (US$ Million), Price (US$/Ton) and Gross Margin (2018-2023)
- Table 144. BASF Shop Primer Product
- Table 145. Hempel Company Information
- Table 146. Hempel Introduction and Business Overview
- Table 147. Hempel Shop Primer Sales (Tons), Revenue (US$ Million), Price (US$/Ton) and Gross Margin (2018-2023)
- Table 148. Hempel Shop Primer Product
- Table 149. Hempel Recent Development
- Table 150. Chugoku Marine Paints Company Information
- Table 151. Chugoku Marine Paints Introduction and Business Overview
- Table 152. Chugoku Marine Paints Shop Primer Sales (Tons), Revenue (US$ Million), Price (US$/Ton) and Gross Margin (2018-2023)
- Table 153. Chugoku Marine Paints Shop Primer Product
- Table 154. Fixall (ICP Group) Company Information
- Table 155. Fixall (ICP Group) Introduction and Business Overview
- Table 156. Fixall (ICP Group) Shop Primer Sales (Tons), Revenue (US$ Million), Price (US$/Ton) and Gross Margin (2018-2023)
- Table 157. Fixall (ICP Group) Shop Primer Product
- Table 158. Rust-Oleum Company Information
- Table 159. Rust-Oleum Introduction and Business Overview
- Table 160. Rust-Oleum Shop Primer Sales (Tons), Revenue (US$ Million), Price (US$/Ton) and Gross Margin (2018-2023)
- Table 161. Rust-Oleum Shop Primer Product
- Table 162. Tnemec Company Information
- Table 163. Tnemec Introduction and Business Overview
- Table 164. Tnemec Shop Primer Sales (Tons), Revenue (US$ Million), Price (US$/Ton) and Gross Margin (2018-2023)
- Table 165. Tnemec Shop Primer Product
- Table 166. Tnemec Recent Development
- Table 167. Zhuzhou Feilu Company Information
- Table 168. Zhuzhou Feilu Introduction and Business Overview
- Table 169. Zhuzhou Feilu Shop Primer Sales (Tons), Revenue (US$ Million), Price (US$/Ton) and Gross Margin (2018-2023)
- Table 170. Zhuzhou Feilu Shop Primer Product
- Table 171. BESA Company Information
- Table 172. BESA Introduction and Business Overview
- Table 173. BESA Shop Primer Sales (Tons), Revenue (US$ Million), Price (US$/Ton) and Gross Margin (2018-2023)
- Table 174. BESA Shop Primer Product
- Table 175. Kelly-Moore Paints Company Information
- Table 176. Kelly-Moore Paints Introduction and Business Overview
- Table 177. Kelly-Moore Paints Shop Primer Sales (Tons), Revenue (US$ Million), Price (US$/Ton) and Gross Margin (2018-2023)
- Table 178. Kelly-Moore Paints Shop Primer Product
- Table 179. Kelly-Moore Paints Recent Development
- Table 180. Yejian New Material Company Information
- Table 181. Yejian New Material Introduction and Business Overview
- Table 182. Yejian New Material Shop Primer Sales (Tons), Revenue (US$ Million), Price (US$/Ton) and Gross Margin (2018-2023)
- Table 183. Yejian New Material Shop Primer Product
- Table 184. Cloverdale Paint Company Information
- Table 185. Cloverdale Paint Introduction and Business Overview
- Table 186. Cloverdale Paint Shop Primer Sales (Tons), Revenue (US$ Million), Price (US$/Ton) and Gross Margin (2018-2023)
- Table 187. Cloverdale Paint Shop Primer Product
- Table 188. Cloverdale Paint Recent Development
- Table 189. Tianjin Jinhai Company Information
- Table 190. Tianjin Jinhai Introduction and Business Overview
- Table 191. Tianjin Jinhai Shop Primer Sales (Tons), Revenue (US$ Million), Price (US$/Ton) and Gross Margin (2018-2023)
- Table 192. Tianjin Jinhai Shop Primer Product
- Table 193. Grand Polycoats Company Information
- Table 194. Grand Polycoats Introduction and Business Overview
- Table 195. Grand Polycoats Shop Primer Sales (Tons), Revenue (US$ Million), Price (US$/Ton) and Gross Margin (2018-2023)
- Table 196. Grand Polycoats Shop Primer Product
- Table 197. ZINDN Company Information
- Table 198. ZINDN Introduction and Business Overview
- Table 199. ZINDN Shop Primer Sales (Tons), Revenue (US$ Million), Price (US$/Ton) and Gross Margin (2018-2023)
- Table 200. ZINDN Shop Primer Product
- Table 201. Raw Materials Key Suppliers Lists
- Table 202. Shop Primer Market Trends
- Table 203. Shop Primer Market Drivers
- Table 204. Shop Primer Market Challenges
- Table 205. Shop Primer Market Restraints
- Table 206. Shop Primer Distributors List
- Table 207. Shop Primer Downstream Customers
- Table 208. Research Programs/Design for This Report
- Table 209. Key Data Information from Secondary Sources
- Table 210. Key Data Information from Primary Sources
- Table 211. QYR Business Unit and Senior & Team Lead Analysts
List of Figures
- Figure 1. Shop Primer Product Picture
- Figure 2. Global Shop Primer Market Size, 2018 VS 2022 VS 2029 (US$ Million)
- Figure 3. Global Shop Primer Market Size Status and Outlook (2018-2029) & (US$ Million)
- Figure 4. Global Shop Primer Sales Status and Outlook (2018-2029) & (Tons)
- Figure 5. Product Picture of Zinc Silicate Shop Primer
- Figure 6. Global Zinc Silicate Shop Primer Sales YoY Growth (2018-2029) & (Tons)
- Figure 7. Product Picture of Epoxy Zinc Rich Shop Primer
- Figure 8. Global Epoxy Zinc Rich Shop Primer Sales YoY Growth (2018-2029) & (Tons)
- Figure 9. Product Picture of Epoxy Iron-Red Shop Primer
- Figure 10. Global Epoxy Iron-Red Shop Primer Sales YoY Growth (2018-2029) & (Tons)
- Figure 11. Product Picture of Others
- Figure 12. Global Others Sales YoY Growth (2018-2029) & (Tons)
- Figure 13. Global Shop Primer Sales by Type (2018-2029) & (US$ Million)
- Figure 14. Global Shop Primer Market Share by Type in 2022 & 2029
- Figure 15. North America Shop Primer Sales Market Share in Volume by Type in 2022
- Figure 16. North America Shop Primer Sales Market Share in Value by Type in 2022
- Figure 17. Europe Shop Primer Sales Market Share in Volume by Type in 2022
- Figure 18. Europe Shop Primer Sales Market Share in Value by Type in 2022
- Figure 19. Asia-Pacific Shop Primer Sales Market Share in Volume by Type in 2022
- Figure 20. Asia-Pacific Shop Primer Sales Market Share in Value by Type in 2022
- Figure 21. Latin America Shop Primer Sales Market Share in Volume by Type in 2022
- Figure 22. Latin America Shop Primer Sales Market Share in Value by Type in 2022
- Figure 23. Middle East and Africa Shop Primer Sales Market Share in Volume by Type in 2022
- Figure 24. Middle East and Africa Shop Primer Sales Market Share in Value by Type in 2022
- Figure 25. The 3 and 5 Largest Manufacturers in the World: Market Share by Shop Primer Sales in 2022
- Figure 26. The 3 and 5 Largest Manufacturers in the World: Market Share by Shop Primer Revenue in 2022
- Figure 27. Product Picture of Metal Finishing and Fabrication
- Figure 28. Global Metal Finishing and Fabrication Sales YoY Growth (2018-2029) & (Tons)
- Figure 29. Product Picture of Marine
- Figure 30. Global Marine Sales YoY Growth (2018-2029) & (Tons)
- Figure 31. Product Picture of Offshore Constructions
- Figure 32. Global Offshore Constructions Sales YoY Growth (2018-2029) & (Tons)
- Figure 33. Product Picture of Mining & Construction Equipment
- Figure 34. Global Mining & Construction Equipment Sales YoY Growth (2018-2029) & (Tons)
- Figure 35. Product Picture of Others
- Figure 36. Global Others Sales YoY Growth (2018-2029) & (Tons)
- Figure 37. Global Shop Primer Sales by Application (2018-2029) & (US$ Million)
- Figure 38. Global Shop Primer Market Share by Application in 2022 & 2029
- Figure 39. North America Shop Primer Sales Market Share in Volume by Application in 2022
- Figure 40. North America Shop Primer Sales Market Share in Value by Application in 2022
- Figure 41. Europe Shop Primer Sales Market Share in Volume by Application in 2022
- Figure 42. Europe Shop Primer Sales Market Share in Value by Application in 2022
- Figure 43. Asia-Pacific Shop Primer Sales Market Share in Volume by Application in 2022
- Figure 44. Asia-Pacific Shop Primer Sales Market Share in Value by Application in 2022
- Figure 45. Latin America Shop Primer Sales Market Share in Volume by Application in 2022
- Figure 46. Latin America Shop Primer Sales Market Share in Value by Application in 2022
- Figure 47. Middle East and Africa Shop Primer Sales Market Share in Volume by Application in 2022
- Figure 48. Middle East and Africa Shop Primer Sales Market Share in Value by Application in 2022
- Figure 49. Zinc Powder Price
- Figure 50. Epoxy Resin Price
- Figure 51. Shop Primer Manufacturing Cost Structure
- Figure 52. Shop Primer Industrial Chain Analysis
- Figure 53. Channels of Distribution
- Figure 54. Distributors Profiles
- Figure 55. Bottom-up and Top-down Approaches for This Report
- Figure 56. Data Triangulation
- Figure 57. Key Executives Interviewed
The global market for Shop Primer was estimated at US$ 777.34 million in the year 2022, is projected to reach a revised size of US$ 1,118.49 million by 2029, growing at a CAGR of 4.93% during the forecast period 2023-2029.
North America market for Shop Primer was valued at $ 172.35 million in 2022 and will reach $ 241.84 million by 2029, at a CAGR of 4.34% during the forecast period of 2023 through 2029.
Europe market for Shop Primer was valued at $ 204.98 million in 2022 and will reach $ 286.15 million by 2029, at a CAGR of 4.49% during the forecast period of 2023 through 2029.
Asia-Pacific market for Shop Primer was valued at $ 322.65 million in 2022 and will reach $ 490.70 million by 2029, at a CAGR of 5.79% during the forecast period of 2023 through 2029.
Report Scope
This report aims to provide a comprehensive presentation of the global market for Shop Primer, with both quantitative and qualitative analysis, to help readers develop business/growth strategies, assess the market competitive situation, analyze their position in the current marketplace, and make informed business decisions regarding Shop Primer.
The Shop Primer market size, estimations, and forecasts are provided in terms of sales volume (Tons) and revenue ($ millions), considering 2022 as the base year, with history and forecast data for the period from 2018 to 2029. This report segments the global Shop Primer market comprehensively. Regional market sizes, concerning products by Type, by Application, and by players, are also provided. The influence of COVID-19 and the Russia-Ukraine War were considered while estimating market sizes.
For a more in-depth understanding of the market, the report provides profiles of the competitive landscape, key competitors, and their respective market ranks. The report also discusses technological trends and new product developments.
This report will help the readers to understand the competition within the industries and strategies for the competitive environment to enhance the potential profit. The report also focuses on the competitive landscape of the global Shop Primer market, and introduces in detail the market share, industry ranking, competitor ecosystem, market performance, new product development, operation situation, expansion, and acquisition. etc. of the main players, which helps the readers to identify the main competitors and deeply understand the competition pattern of the market.
Market Segmentation
This report covers the Shop Primer segments by manufacturers, by Type, by Application, by region and country, and provides market size (value, volume and average price) and CAGR for the history and forecast period (2018-2022, 2023-2029), considering 2022 as the base year. It elucidates potential revenue opportunities across different segments and explains attractive investment proposition matrices for this market.
By Company
- AkzoNobel
- Sherwin-Williams
- PPG Industries
- Nippon Paint
- Kansai Paint
- Jotun
- BASF
- Hempel
- Chugoku Marine Paints
- Fixall (ICP Group)
- Rust-Oleum
- Tnemec
- Zhuzhou Feilu
- BESA
- Kelly-Moore Paints
- Yejian New Material
- Cloverdale Paint
- Tianjin Jinhai
- Grand Polycoats
- ZINDN
Segment by Type
- Zinc Silicate Shop Primer
- Epoxy Zinc Rich Shop Primer
- Epoxy Iron-Red Shop Primer
- Others
Segment by Application
- Metal Finishing and Fabrication
- Marine
- Offshore Constructions
- Mining & Construction Equipment
- Others
By Region
- North America
- United States
- Canada
- Asia-Pacific
- China
- Japan
- South Korea
- India
- Australia
- Southeast Asia
- Europe
- Germany
- France
- U.K.
- Italy
- Russia
- Latin America
- Mexico
- Brazil
- Argentina
- Colombia
- Middle East & Africa
- Turkey
- Saudi Arabia
- UAE
Core Chapters
- Chapter One: Introduces the study scope of this report, executive summary of market segments by Type, market size segments for North America, Europe, Asia Pacific, Latin America, Middle East & Africa.
- Chapter Two: Detailed analysis of Shop Primer manufacturers competitive landscape, price, sales, revenue, market share and ranking, latest development plan, merger, and acquisition information, etc.
- Chapter Three: Sales, revenue of Shop Primer in regional level. It provides a quantitative analysis of the market size and development potential of each region and introduces the future development prospects, and market space in the world.
- Chapter Four: Introduces market segments by Application, market size segment for North America, Europe, Asia Pacific, Latin America, Middle East & Africa.
- Chapter Five, Six, Seven, Eight and Nine: North America, Europe, Asia Pacific, Latin America, Middle East & Africa, sales and revenue by country.
- Chapter Ten: Provides profiles of key players, introducing the basic situation of the main companies in the market in detail, including product sales, revenue, price, gross margin, product introduction, recent development, etc.
- Chapter Eleven: Analysis of industrial chain, key raw materials, manufacturing cost, and market dynamics. Introduces the market dynamics, latest developments of the market, the driving factors and restrictive factors of the market, the challenges and risks faced by manufacturers in the industry, and the analysis of relevant policies in the industry.
- Chapter Twelve: Analysis of sales channel, distributors and customers.
- Chapter Thirteen: Research Findings and Conclusion.
Table of Contents
1 Shop Primer Market Overview
- 1.1 Shop Primer Product Overview
- 1.2 Shop Primer Market by Type
- 1.2.1 Zinc Silicate Shop Primer
- 1.2.2 Epoxy Zinc Rich Shop Primer
- 1.2.3 Epoxy Iron-Red Shop Primer
- 1.2.4 Others
- 1.3 Global Shop Primer Market Size by Type
- 1.3.1 Global Shop Primer Market Size Overview by Type (2018-2029)
- 1.3.2 Global Shop Primer Historic Market Size Review by Type (2018-2023)
- 1.3.3 Global Shop Primer Forecasted Market Size by Type (2024-2029)
- 1.4 Key Regions Market Size by Type
- 1.4.1 North America Shop Primer Sales Breakdown by Type (2018-2023)
- 1.4.2 Europe Shop Primer Sales Breakdown by Type (2018-2023)
- 1.4.3 Asia-Pacific Shop Primer Sales Breakdown by Type (2018-2023)
- 1.4.4 Latin America Shop Primer Sales Breakdown by Type (2018-2023)
- 1.4.5 Middle East and Africa Shop Primer Sales Breakdown by Type (2018-2023)
2 Shop Primer Market Competition by Company
- 2.1 Global Top Players by Shop Primer Sales (2018-2023)
- 2.2 Global Top Players by Shop Primer Revenue (2018-2023)
- 2.3 Global Top Players by Shop Primer Price (2018-2023)
- 2.4 Global Top Manufacturers Shop Primer Headquarters and Sales Area
- 2.5 Shop Primer Market Competitive Situation and Trends
- 2.5.1 Shop Primer Market Concentration Rate (2018-2023)
- 2.5.2 Global 3 and 5 Largest Manufacturers by Shop Primer Sales and Revenue in 2022
- 2.6 Global Top Manufacturers by Company Type (Tier 1, Tier 2, and Tier 3) & (based on the Revenue in Shop Primer as of 2022)
- 2.7 Establish Date of Key Shop Primer Manufacturers
- 2.8 Key Manufacturers Shop Primer Product Offered
- 2.9 Mergers & Acquisitions, Expansion
3 Shop Primer Status and Outlook by Region
- 3.1 Global Shop Primer Market Size and CAGR by Region: 2018 VS 2022 VS 2029
- 3.2 Global Shop Primer Historic Market Size by Region
- 3.2.1 Global Shop Primer Sales in Volume by Region (2018-2023)
- 3.2.2 Global Shop Primer Sales in Value by Region (2018-2023)
- 3.2.3 Global Shop Primer Sales (Volume & Value) and Price (2018-2023)
- 3.3 Global Shop Primer Forecasted Market Size by Region
- 3.3.1 Global Shop Primer Sales in Volume by Region (2024-2029)
- 3.3.2 Global Shop Primer Sales in Value by Region (2024-2029)
- 3.3.3 Global Shop Primer Sales (Volume & Value) and Price (2024-2029)
4 Shop Primer by Application
- 4.1 Shop Primer Market by Application
- 4.1.1 Metal Finishing and Fabrication
- 4.1.2 Marine
- 4.1.3 Offshore Constructions
- 4.1.4 Mining & Construction Equipment
- 4.1.5 Others
- 4.2 Global Shop Primer Market Size by Application
- 4.2.1 Global Shop Primer Market Size Overview by Application (2018-2029)
- 4.2.2 Global Shop Primer Historic Market Size Review by Application (2018-2023)
- 4.2.3 Global Shop Primer Forecasted Market Size by Application (2024-2029)
- 4.3 Key Regions Market Size by Application
- 4.3.1 North America Shop Primer Sales Breakdown by Application (2018-2023)
- 4.3.2 Europe Shop Primer Sales Breakdown by Application (2018-2023)
- 4.3.3 Asia-Pacific Shop Primer Sales Breakdown by Application (2018-2023)
- 4.3.4 Latin America Shop Primer Sales Breakdown by Application (2018-2023)
- 4.3.5 Middle East and Africa Shop Primer Sales Breakdown by Application (2018-2023)
5 North America Shop Primer by Country
- 5.1 North America Shop Primer Historic Market Size by Country
- 5.1.1 North America Shop Primer Market Size Growth Rate (CAGR) by Country: 2018 VS 2022 VS 2029
- 5.1.2 North America Shop Primer Sales in Volume by Country (2018-2023)
- 5.1.3 North America Shop Primer Sales in Value by Country (2018-2023)
- 5.2 North America Shop Primer Forecasted Market Size by Country
- 5.2.1 North America Shop Primer Sales in Volume by Country (2024-2029)
- 5.2.2 North America Shop Primer Sales in Value by Country (2024-2029)
6 Europe Shop Primer by Country
- 6.1 Europe Shop Primer Historic Market Size by Country
- 6.1.1 Europe Shop Primer Market Size Growth Rate (CAGR) by Country: 2018 VS 2022 VS 2029
- 6.1.2 Europe Shop Primer Sales in Volume by Country (2018-2023)
- 6.1.3 Europe Shop Primer Sales in Value by Country (2018-2023)
- 6.2 Europe Shop Primer Forecasted Market Size by Country
- 6.2.1 Europe Shop Primer Sales in Volume by Country (2024-2029)
- 6.2.2 Europe Shop Primer Sales in Value by Country (2024-2029)
7 Asia-Pacific Shop Primer by Region
- 7.1 Asia-Pacific Shop Primer Historic Market Size by Region
- 7.1.1 Asia-Pacific Shop Primer Market Size Growth Rate (CAGR) by Region: 2018 VS 2022 VS 2029
- 7.1.2 Asia-Pacific Shop Primer Sales in Volume by Region (2018-2023)
- 7.1.3 Asia-Pacific Shop Primer Sales in Value by Region (2018-2023)
- 7.2 Asia-Pacific Shop Primer Forecasted Market Size by Region
- 7.2.1 Asia-Pacific Shop Primer Sales in Volume by Region (2024-2029)
- 7.2.2 Asia-Pacific Shop Primer Sales in Value by Region (2024-2029)
8 Latin America Shop Primer by Country
- 8.1 Latin America Shop Primer Historic Market Size by Country
- 8.1.1 Latin America Shop Primer Market Size Growth Rate (CAGR) by Country: 2018 VS 2022 VS 2029
- 8.1.2 Latin America Shop Primer Sales in Volume by Country (2018-2023)
- 8.1.3 Latin America Shop Primer Sales in Value by Country (2018-2023)
- 8.2 Latin America Shop Primer Forecasted Market Size by Country
- 8.2.1 Latin America Shop Primer Sales in Volume by Country (2024-2029)
- 8.2.2 Latin America Shop Primer Sales in Value by Country (2024-2029)
9 Middle East and Africa Shop Primer by Country
- 9.1 Middle East and Africa Shop Primer Historic Market Size by Country
- 9.1.1 Middle East and Africa Shop Primer Market Size Growth Rate (CAGR) by Country: 2018 VS 2022 VS 2029
- 9.1.2 Middle East and Africa Shop Primer Sales in Volume by Country (2018-2023)
- 9.1.3 Middle East and Africa Shop Primer Sales in Value by Country (2018-2023)
- 9.2 Middle East and Africa Shop Primer Forecasted Market Size by Country
- 9.2.1 Middle East and Africa Shop Primer Sales in Volume by Country (2024-2029)
- 9.2.2 Middle East and Africa Shop Primer Sales in Value by Country (2024-2029)
10 Company Profiles
- 10.1 AkzoNobel
- 10.1.1 AkzoNobel Company Information
- 10.1.2 AkzoNobel Introduction and Business Overview
- 10.1.3 AkzoNobel Shop Primer Sales, Revenue and Gross Margin (2018-2023)
- 10.1.4 AkzoNobel Shop Primer Products Offered
- 10.1.5 AkzoNobel Recent Development
- 10.2 Sherwin-Williams
- 10.2.1 Sherwin-Williams Company Information
- 10.2.2 Sherwin-Williams Introduction and Business Overview
- 10.2.3 Sherwin-Williams Shop Primer Sales, Revenue and Gross Margin (2018-2023)
- 10.2.4 Sherwin-Williams Shop Primer Products Offered
- 10.2.5 Sherwin-Williams Recent Development
- 10.3 PPG Industries
- 10.3.1 PPG Industries Company Information
- 10.3.2 PPG Industries Introduction and Business Overview
- 10.3.3 PPG Industries Shop Primer Sales, Revenue and Gross Margin (2018-2023)
- 10.3.4 PPG Industries Shop Primer Products Offered
- 10.3.5 PPG Industries Recent Development
- 10.4 Nippon Paint
- 10.4.1 Nippon Paint Company Information
- 10.4.2 Nippon Paint Introduction and Business Overview
- 10.4.3 Nippon Paint Shop Primer Sales, Revenue and Gross Margin (2018-2023)
- 10.4.4 Nippon Paint Shop Primer Products Offered
- 10.4.5 Nippon Paint Recent Development
- 10.5 Kansai Paint
- 10.5.1 Kansai Paint Company Information
- 10.5.2 Kansai Paint Introduction and Business Overview
- 10.5.3 Kansai Paint Shop Primer Sales, Revenue and Gross Margin (2018-2023)
- 10.5.4 Kansai Paint Shop Primer Products Offered
- 10.5.5 Kansai Paint Recent Development
- 10.6 Jotun
- 10.6.1 Jotun Company Information
- 10.6.2 Jotun Introduction and Business Overview
- 10.6.3 Jotun Shop Primer Sales, Revenue and Gross Margin (2018-2023)
- 10.6.4 Jotun Shop Primer Products Offered
- 10.7 BASF
- 10.7.1 BASF Company Information
- 10.7.2 BASF Introduction and Business Overview
- 10.7.3 BASF Shop Primer Sales, Revenue and Gross Margin (2018-2023)
- 10.7.4 BASF Shop Primer Products Offered
- 10.8 Hempel
- 10.8.1 Hempel Company Information
- 10.8.2 Hempel Introduction and Business Overview
- 10.8.3 Hempel Shop Primer Sales, Revenue and Gross Margin (2018-2023)
- 10.8.4 Hempel Shop Primer Products Offered
- 10.8.5 Hempel Recent Development
- 10.9 Chugoku Marine Paints
- 10.9.1 Chugoku Marine Paints Company Information
- 10.9.2 Chugoku Marine Paints Introduction and Business Overview
- 10.9.3 Chugoku Marine Paints Shop Primer Sales, Revenue and Gross Margin (2018-2023)
- 10.9.4 Chugoku Marine Paints Shop Primer Products Offered
- 10.10 Fixall (ICP Group)
- 10.10.1 Fixall (ICP Group) Company Information
- 10.10.2 Fixall (ICP Group) Introduction and Business Overview
- 10.10.3 Fixall (ICP Group) Shop Primer Sales, Revenue and Gross Margin (2018-2023)
- 10.10.4 Fixall (ICP Group) Shop Primer Products Offered
- 10.11 Rust-Oleum
- 10.11.1 Rust-Oleum Company Information
- 10.11.2 Rust-Oleum Introduction and Business Overview
- 10.11.3 Rust-Oleum Shop Primer Sales, Revenue and Gross Margin (2018-2023)
- 10.11.4 Rust-Oleum Shop Primer Products Offered
- 10.12 Tnemec
- 10.12.1 Tnemec Company Information
- 10.12.2 Tnemec Introduction and Business Overview
- 10.12.3 Tnemec Shop Primer Sales, Revenue and Gross Margin (2018-2023)
- 10.12.4 Tnemec Shop Primer Products Offered
- 10.12.5 Tnemec Recent Development
- 10.13 Zhuzhou Feilu
- 10.13.1 Zhuzhou Feilu Company Information
- 10.13.2 Zhuzhou Feilu Introduction and Business Overview
- 10.13.3 Zhuzhou Feilu Shop Primer Sales, Revenue and Gross Margin (2018-2023)
- 10.13.4 Zhuzhou Feilu Shop Primer Products Offered
- 10.14 BESA
- 10.14.1 BESA Company Information
- 10.14.2 BESA Introduction and Business Overview
- 10.14.3 BESA Shop Primer Sales, Revenue and Gross Margin (2018-2023)
- 10.14.4 BESA Shop Primer Products Offered
- 10.15 Kelly-Moore Paints
- 10.15.1 Kelly-Moore Paints Company Information
- 10.15.2 Kelly-Moore Paints Introduction and Business Overview
- 10.15.3 Kelly-Moore Paints Shop Primer Sales, Revenue and Gross Margin (2018-2023)
- 10.15.4 Kelly-Moore Paints Shop Primer Products Offered
- 10.15.5 Kelly-Moore Paints Recent Development
- 10.16 Yejian New Material
- 10.16.1 Yejian New Material Company Information
- 10.16.2 Yejian New Material Introduction and Business Overview
- 10.16.3 Yejian New Material Shop Primer Sales, Revenue and Gross Margin (2018-2023)
- 10.16.4 Yejian New Material Shop Primer Products Offered
- 10.17 Cloverdale Paint
- 10.17.1 Cloverdale Paint Company Information
- 10.17.2 Cloverdale Paint Introduction and Business Overview
- 10.17.3 Cloverdale Paint Shop Primer Sales, Revenue and Gross Margin (2018-2023)
- 10.17.4 Cloverdale Paint Shop Primer Products Offered
- 10.17.5 Cloverdale Paint Recent Development
- 10.18 Tianjin Jinhai
- 10.18.1 Tianjin Jinhai Company Information
- 10.18.2 Tianjin Jinhai Introduction and Business Overview
- 10.18.3 Tianjin Jinhai Shop Primer Sales, Revenue and Gross Margin (2018-2023)
- 10.18.4 Tianjin Jinhai Shop Primer Products Offered
- 10.19 Grand Polycoats
- 10.19.1 Grand Polycoats Company Information
- 10.19.2 Grand Polycoats Introduction and Business Overview
- 10.19.3 Grand Polycoats Shop Primer Sales, Revenue and Gross Margin (2018-2023)
- 10.19.4 Grand Polycoats Shop Primer Products Offered
- 10.20 ZINDN
- 10.20.1 ZINDN Company Information
- 10.20.2 ZINDN Introduction and Business Overview
- 10.20.3 ZINDN Shop Primer Sales, Revenue and Gross Margin (2018-2023)
- 10.20.4 ZINDN Shop Primer Products Offered
11 Upstream, Opportunities, Challenges, Risks and Influences Factors Analysis
- 11.1 Shop Primer Key Raw Materials
- 11.1.1 Key Raw Materials
- 11.1.2 Key Raw Materials Price
- 11.1.3 Raw Materials Key Suppliers
- 11.2 Manufacturing Cost Structure
- 11.2.1 Raw Materials
- 11.2.2 Labor Cost
- 11.2.3 Manufacturing Expenses
- 11.3 Shop Primer Industrial Chain Analysis
- 11.4 Shop Primer Market Dynamics
- 11.4.1 Shop Primer Industry Trends
- 11.4.2 Shop Primer Market Drivers
- 11.4.3 Shop Primer Market Challenges
- 11.4.4 Shop Primer Market Restraints
12 Marketing Strategy Analysis, Distributors
- 12.1 Sales Channel
- 12.2 Shop Primer Distributors
- 12.3 Shop Primer Downstream Customers
13 Research Findings and Conclusion
14 Appendix
- 14.1 Research Methodology
- 14.1.1 Methodology/Research Approach
- 14.1.2 Data Source
- 14.2 Author Details
- 14.3 Disclaimer
