|
|
市場調査レポート
商品コード
1289060
セラミックパウダーの世界市場:2029年までの予測Global Ceramic Powder Market Insights, Forecast to 2029 |
||||||
|
|
|||||||
|
● お客様のご希望に応じて、既存データの加工や未掲載情報(例:国別セグメント)の追加などの対応が可能です。 詳細はお問い合わせください。 |
|||||||


| セラミックパウダーの世界市場:2029年までの予測 |
|
出版日: 2023年06月12日
発行: QYResearch
ページ情報: 英文 239 Pages
納期: 2~3営業日
|
- 全表示
- 概要
- 図表
- 目次
世界のセラミックパウダーの市場規模は、COVID-19パンデミックとロシア・ウクライナ戦争の影響により2022年に35億7,258万米ドルとなりました。
同市場は、予測期間の2023年~2029年に5.57%のCAGRで拡大し、2029年には62億1,317万米ドルに達すると予測されています。
セラミックパウダーの北米市場は、2023年の10億1,174万米ドルから2029年には13億1,634万米ドルに達すると推定され、2023年から2029年の予測期間中に4.48%のCAGRで増加するとされています。
セラミックパウダーの中国市場は、2023年の7億4,730万米ドルから2029年には12億2,644万米ドルに達すると推定され、2023年から2029年までの予測期間中にCAGR8.61%で増加する見込みです。
セラミックパウダーのヨーロッパ市場は、2023年の10億7,625万米ドルから2029年には14億5,295万米ドルに達すると推定され、2023年から2029年までの予測期間中にCAGRは5.13%になるとされています。
当レポートでは、世界のセラミックパウダー市場について調査し、市場の概要とともに、企業別、タイプ別、用途別、地域別の動向、および市場に参入する企業のプロファイルなどを提供しています。
目次
第1章 調査範囲
- セラミックパウダーの製品イントロダクション
- タイプ別市場
- 用途別市場
- 前提と制限
- 調査目的
- 対象年
第2章 世界のセラミックパウダーの生産
第3章 エグゼクティブサマリー
第4章 メーカー別競合
第5章 市場規模、タイプ別
- 世界のセラミックパウダーの売上、タイプ別
- 世界のセラミックパウダーの収益、タイプ別
- 世界のセラミックパウダーの価格、タイプ別
第6章 市場規模、用途別
- 世界のセラミックパウダーの売上、用途別
- 世界のセラミックパウダーの収益、用途別
- 世界のセラミックパウダーの価格、用途別
第7章 北米
第8章 欧州
第9章 アジア太平洋
第10章 ラテンアメリカ
第11章 中東・アフリカ
第12章 会社概要
- DKKK
- Saint-Gobain
- Tosoh
- Solvay
- KCM Corporation
- Showa Denko
- Orient Zirconic
- Sinocera
- Nanomakers
- Washington Mills
- Fujimi
- Hoganas
- Fiven
- Pacific Rundum
- Shin-Etsu Chemical
- Jicheng Advanced Ceramics
- Tokuyama
- HC Starck
- Toyo Aluminium KK
- UBE
- AlzChem
- Denka
- Hebei Corefra Silicon Nitride Material
- CUP New Materials
- 3M
- Sumitomo Chemical
- Baikowski
- XuanCheng JingRui New Material
第13章 産業チェーンと販売チャネルの分析
- セラミックパウダー産業チェーン分析
- セラミックパウダーの主要原料
- セラミックパウダーの製造方法とプロセス
- セラミックパウダーの販売・マーケティング
- セラミックパウダーの顧客
第14章 セラミックパウダー市場力学
第15章 世界のセラミックパウダー調査における主な調査結果
第16章 付録
List of Tables
- Table 1. Global Ceramic Powder Market Size Growth Rate by Type, 2018 VS 2022 VS 2029 (US$ Million)
- Table 2. Key Manufacturers of Zirconia
- Table 3. Key Manufacturers of Silicon Carbide
- Table 4. Key Manufacturers of Aluminum Nitride
- Table 5. Key Manufacturers of Silicon Nitride
- Table 6. Key Manufacturers of Boron Carbide and Boron Nitride
- Table 7. Global Ceramic Powder Market Size Growth Rate by Application, 2018 VS 2022 VS 2029 (US$ Million)
- Table 8. Global Ceramic Powder Production Growth Rate (CAGR) by Region: 2018 VS 2022 VS 2029 (Tons)
- Table 9. Global Ceramic Powder Production by Region (2018-2023) & (Tons)
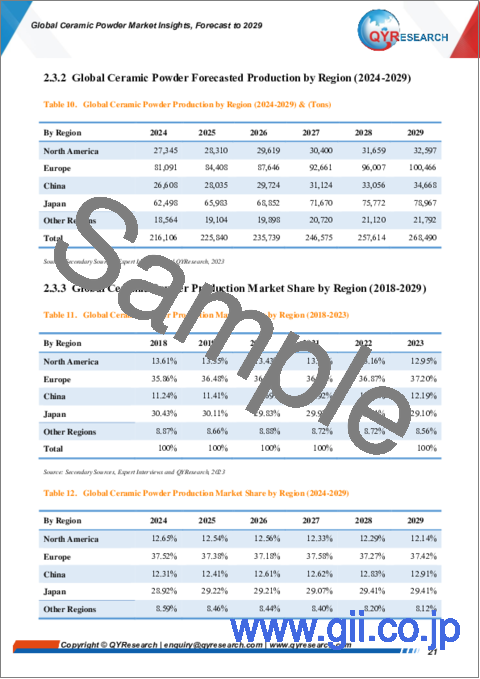
- Table 10. Global Ceramic Powder Production by Region (2024-2029) & (Tons)
- Table 11. Global Ceramic Powder Production Market Share by Region (2018-2023)
- Table 12. Global Ceramic Powder Production Market Share by Region (2024-2029)
- Table 13. Global Ceramic Powder Revenue Grow Rate (CAGR) by Region: 2018 VS 2022 VS 2029 (US$ Million)
- Table 14. Global Ceramic Powder Revenue by Region (2018-2023) & (US$ Million)
- Table 15. Global Ceramic Powder Revenue by Region (2024-2029) & (US$ Million)
- Table 16. Global Ceramic Powder Revenue Market Share by Region (2018-2023)
- Table 17. Global Ceramic Powder Revenue Market Share by Region (2024-2029)
- Table 18. Global Ceramic Powder Sales Grow Rate (CAGR) by Region: 2018 VS 2022 VS 2029 (Tons)
- Table 19. Global Ceramic Powder Sales by Region (2018-2023) & (Tons)
- Table 20. Global Ceramic Powder Sales by Region (2024-2029) & (Tons)
- Table 21. Global Ceramic Powder Sales Market Share by Region (2018-2023)
- Table 22. Global Ceramic Powder Sales Market Share by Region (2024-2029)
- Table 23. Global Ceramic Powder Sales by Manufacturers (2018-2023) & (Tons)
- Table 24. Global Ceramic Powder Sales Share by Manufacturers (2018-2023)
- Table 25. Global Ceramic Powder Revenue by Manufacturers (2018-2023) & (US$ Million)
- Table 26. Global Ceramic Powder Revenue Market Share by Manufacturers (2018-2023)
- Table 27. Ceramic Powder Price by Manufacturers (2018-2023) & (US$/Kg)
- Table 28. Global Key Players of Ceramic Powder, Industry Ranking, 2021 VS 2022
- Table 29. Global Ceramic Powder Manufacturers Market Concentration Ratio (CR5 and HHI)
- Table 30. Global Ceramic Powder by Company Type (Tier 1, Tier 2, and Tier 3) & (based on the Revenue in Ceramic Powder as of 2022)
- Table 31. Global Key Manufacturers of Ceramic Powder Headquarters Distribution
- Table 32. Global Key Manufacturers of Ceramic Powder Product Offered
- Table 33. Establishing Date of Global Key Manufacturers of Ceramic Powder Market
- Table 34. Global Ceramic Powder Sales by Type (2018-2023) & (Tons)
- Table 35. Global Ceramic Powder Sales by Type (2024-2029) & (Tons)
- Table 36. Global Ceramic Powder Sales Share by Type (2018-2023)
- Table 37. Global Ceramic Powder Sales Share by Type (2024-2029)
- Table 38. Global Ceramic Powder Revenue by Type (2018-2023) & (US$ Million)
- Table 39. Global Ceramic Powder Revenue by Type (2024-2029) & (US$ Million)
- Table 40. Global Ceramic Powder Revenue Share by Type (2018-2023)
- Table 41. Global Ceramic Powder Revenue Share by Type (2024-2029)
- Table 42. Ceramic Powder Price by Type (2018-2023) & (US$/Kg)
- Table 43. Global Ceramic Powder Price Forecast by Type (2024-2029) & (US$/Kg)
- Table 44. Global Ceramic Powder Sales by Application (2018-2023) & (Tons)
- Table 45. Global Ceramic Powder Sales by Application (2024-2029) & (Tons)
- Table 46. Global Ceramic Powder Sales Share by Application (2018-2023)
- Table 47. Global Ceramic Powder Sales Share by Application (2024-2029)
- Table 48. Global Ceramic Powder Revenue by Application (2018-2023) & (US$ Million)
- Table 49. Global Ceramic Powder Revenue by Application (2024-2029) & (US$ Million)
- Table 50. Global Ceramic Powder Revenue Share by Application (2018-2023)
- Table 51. Global Ceramic Powder Revenue Share by Application (2024-2029)
- Table 52. Ceramic Powder Price by Application (2018-2023) & (US$/Kg)
- Table 53. Global Ceramic Powder Price Forecast by Application (2024-2029) & (US$/Kg)
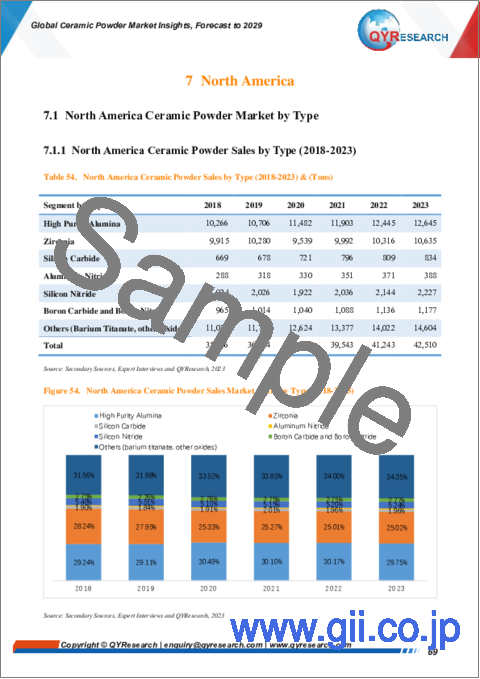
- Table 54. North America Ceramic Powder Sales by Type (2018-2023) & (Tons)
- Table 55. North America Ceramic Powder Sales by Type (2024-2029) & (Tons)
- Table 56. North America Ceramic Powder Sales by Application (2018-2023) & (Tons)
- Table 57. North America Ceramic Powder Sales by Application (2024-2029) & (Tons)
- Table 58. North America Ceramic Powder Revenue Grow Rate (CAGR) by Country: 2018 VS 2022 VS 2029 (US$ Million)
- Table 59. North America Ceramic Powder Revenue by Country (2018-2023) & (US$ Million)
- Table 60. North America Ceramic Powder Revenue by Country (2024-2029) & (US$ Million)
- Table 61. North America Ceramic Powder Sales by Country (2018-2023) & (Tons)
- Table 62. North America Ceramic Powder Sales by Country (2024-2029) & (Tons)
- Table 63. Europe Ceramic Powder Sales by Type (2018-2023) & (Tons)
- Table 64. Europe Ceramic Powder Sales by Type (2024-2029) & (Tons)
- Table 65. Europe Ceramic Powder Sales by Application (2018-2023) & (Tons)
- Table 66. Europe Ceramic Powder Sales by Application (2024-2029) & (Tons)
- Table 67. Europe Ceramic Powder Revenue Grow Rate (CAGR) by Country: 2018 VS 2022 VS 2029 (US$ Million)
- Table 68. Europe Ceramic Powder Revenue by Country (2018-2023) & (US$ Million)
- Table 69. Europe Ceramic Powder Revenue by Country (2024-2029) & (US$ Million)
- Table 70. Europe Ceramic Powder Sales by Country (2018-2023) & (Tons)
- Table 71. Europe Ceramic Powder Sales by Country (2024-2029) & (Tons)
- Table 72. Asia-Pacific Ceramic Powder Sales by Type (2018-2023) & (Tons)
- Table 73. Asia-Pacific Ceramic Powder Sales by Type (2024-2029) & (Tons)
- Table 74. Asia-Pacific Ceramic Powder Sales by Application (2018-2023) & (Tons)
- Table 75. Asia-Pacific Ceramic Powder Sales by Application (2024-2029) & (Tons)
- Table 76. Asia-Pacific Ceramic Powder Revenue Grow Rate (CAGR) by Region: 2018 VS 2022 VS 2029 (US$ Million)
- Table 77. Asia-Pacific Ceramic Powder Revenue by Region (2018-2023) & (US$ Million)
- Table 78. Asia-Pacific Ceramic Powder Revenue by Region (2024-2029) & (US$ Million)
- Table 79. Asia-Pacific Ceramic Powder Sales by Region (2018-2023) & (Tons)
- Table 80. Asia-Pacific Ceramic Powder Sales by Region (2024-2029) & (Tons)
- Table 81. Latin America Ceramic Powder Sales by Type (2018-2023) & (Tons)
- Table 82. Latin America Ceramic Powder Sales by Type (2024-2029) & (Tons)
- Table 83. Latin America Ceramic Powder Sales by Application (2018-2023) & (Tons)
- Table 84. Latin America Ceramic Powder Sales by Application (2024-2029) & (Tons)
- Table 85. Latin America Ceramic Powder Revenue Grow Rate (CAGR) by Country: 2018 VS 2022 VS 2029 (US$ Million)
- Table 86. Latin America Ceramic Powder Revenue by Country (2018-2023) & (US$ Million)
- Table 87. Latin America Ceramic Powder Revenue by Country (2024-2029) & (US$ Million)
- Table 88. Latin America Ceramic Powder Sales by Country (2018-2023) & (Tons)
- Table 89. Latin America Ceramic Powder Sales by Country (2024-2029) & (Tons)
- Table 90. Middle East & Africa Ceramic Powder Sales by Type (2018-2023) & (Tons)
- Table 91. Middle East & Africa Ceramic Powder Sales by Type (2024-2029) & (Tons)
- Table 92. Middle East and Africa Ceramic Powder Sales by Application (2018-2023) & (Tons)
- Table 93. Middle East and Africa Ceramic Powder Sales by Application (2024-2029) & (Tons)
- Table 94. Middle East and Africa Ceramic Powder Revenue Grow Rate (CAGR) by Region: 2018 VS 2022 VS 2029 (US$ Million)
- Table 95. Middle East and Africa Ceramic Powder Revenue by Region (2018-2023) & (US$ Million)
- Table 96. Middle East and Africa Ceramic Powder Revenue by Region (2024-2029) & (US$ Million)
- Table 97. Middle East and Africa Ceramic Powder Sales by Region (2018-2023) & (Tons)
- Table 98. Middle East and Africa Ceramic Powder Sales by Region (2024-2029) & (Tons)
- Table 99. DKKK Corporation Information
- Table 100. DKKK Description and Major Businesses
- Table 101. DKKK Ceramic Powder Capacity, Sales (Tons), Revenue (US$ Million), Price (US$/Kg) and Gross Margin (2018-2023)
- Table 102. DKKK Ceramic Powder Product Model Numbers, Pictures, Descriptions and Specifications
- Table 103. Saint-Gobain Corporation Information
- Table 104. Saint-Gobain Description and Major Businesses
- Table 105. Saint-Gobain Ceramic Powder Capacity, Sales (Tons), Revenue (US$ Million), Price (US$/Kg) and Gross Margin (2018-2023)
- Table 106. Saint-Gobain Ceramic Powder Product Model Numbers, Pictures, Descriptions and Specifications
- Table 107. Tosoh Corporation Information
- Table 108. Tosoh Description and Major Businesses
- Table 109. Tosoh Ceramic Powder Capacity, Sales (Tons), Revenue (US$ Million), Price (US$/Kg) and Gross Margin (2018-2023)
- Table 110. Tosoh Ceramic Powder Product Model Numbers, Pictures, Descriptions and Specifications
- Table 111. Tosoh Recent Developments
- Table 112. KCM Corporation Corporation Information
- Table 113. KCM Corporation Description and Major Businesses
- Table 114. KCM Corporation Ceramic Powder Capacity, Sales (Tons), Revenue (US$ Million), Price (US$/Kg) and Gross Margin (2018-2023)
- Table 115. KCM Corporation Ceramic Powder Product Model Numbers, Pictures, Descriptions and Specifications
- Table 116. Orient Zirconic Corporation Information
- Table 117. Orient Zirconic Description and Major Businesses
- Table 118. Orient Zirconic Ceramic Powder Capacity, Sales (Tons), Revenue (US$ Million), Price (US$/Kg) and Gross Margin (2018-2023)
- Table 119. Orient Zirconic Ceramic Powder Product Model Numbers, Pictures, Descriptions and Specifications
- Table 120. Sinocera Corporation Information
- Table 121. Sinocera Description and Major Businesses
- Table 122. Sinocera Ceramic Powder Capacity, Sales (Tons), Revenue (US$ Million), Price (US$/Kg) and Gross Margin (2018-2023)
- Table 123. Sinocera Ceramic Powder Product Model Numbers, Pictures, Descriptions and Specifications
- Table 124. Nanomakers Corporation Information
- Table 125. Nanomakers Description and Major Businesses
- Table 126. Nanomakers Ceramic Powder Capacity, Sales (Tons), Revenue (US$ Million), Price (US$/Kg) and Gross Margin (2018-2023)
- Table 127. Nanomakers Ceramic Powder Product Model Numbers, Pictures, Descriptions and Specifications
- Table 128. Washington Mills Corporation Information
- Table 129. Washington Mills Description and Major Businesses
- Table 130. Washington Mills Ceramic Powder Capacity, Sales (Tons), Revenue (US$ Million), Price (US$/Kg) and Gross Margin (2018-2023)
- Table 131. Washington Mills Ceramic Powder Product Model Numbers, Pictures, Descriptions and Specifications
- Table 132. Fujimi Corporation Information
- Table 133. Fujimi Description
- Table 134. Fujimi Ceramic Powder Capacity, Sales (Tons), Revenue (US$ Million), Price (US$/Kg) and Gross Margin (2018-2023)
- Table 135. Fujimi Ceramic Powder Product Model Numbers, Pictures, Descriptions and Specifications
- Table 136. Hoganas Corporation Information
- Table 137. Hoganas Description and Major Businesses
- Table 138. Hoganas Ceramic Powder Capacity, Sales (Tons), Revenue (US$ Million), Price (US$/Kg) and Gross Margin (2018-2023)
- Table 139. Hoganas Ceramic Powder Product Model Numbers, Pictures, Descriptions and Specifications
- Table 140. Hoganas Recent Developments
- Table 141. Fiven Corporation Information
- Table 142. Fiven Description and Major Businesses
- Table 143. Fiven Ceramic Powder Capacity, Sales (Tons), Revenue (US$ Million), Price (US$/Kg) and Gross Margin (2018-2023)
- Table 144. Fiven Ceramic Powder Product Model Numbers, Pictures, Descriptions and Specifications
- Table 145. Pacific Rundum Corporation Information
- Table 146. Pacific Rundum Description and Major Businesses
- Table 147. Pacific Rundum Ceramic Powder Capacity, Sales (Tons), Revenue (US$ Million), Price (US$/Kg) and Gross Margin (2018-2023)
- Table 148. Pacific Rundum Ceramic Powder Product Model Numbers, Pictures, Descriptions and Specifications
- Table 149. Shin-Etsu Chemical Corporation Information
- Table 150. Shin-Etsu Chemical Description and Major Businesses
- Table 151. Shin-Etsu Chemical Ceramic Powder Capacity, Sales (Tons), Revenue (US$ Million), Price (US$/Kg) and Gross Margin (2018-2023)
- Table 152. Shin-Etsu Chemical Ceramic Powder Product Model Numbers, Pictures, Descriptions and Specifications
- Table 153. Shin-Etsu Chemical Recent Developments
- Table 154. Jicheng Advanced Ceramics Corporation Information
- Table 155. Jicheng Advanced Ceramics Description and Major Businesses
- Table 156. Jicheng Advanced Ceramics Ceramic Powder Capacity, Sales (Tons), Revenue (US$ Million), Price (US$/Kg) and Gross Margin (2018-2023)
- Table 157. Jicheng Advanced Ceramics Ceramic Powder Product Model Numbers, Pictures, Descriptions and Specifications
- Table 158. Tokuyama Corporation Information
- Table 159. Tokuyama Description and Major Businesses
- Table 160. Tokuyama Ceramic Powder Capacity, Sales (Tons), Revenue (US$ Million), Price (US$/Kg) and Gross Margin (2018-2023)
- Table 161. Tokuyama Ceramic Powder Product Model Numbers, Pictures, Descriptions and Specifications
- Table 162. Tokuyama Recent Developments
- Table 163. H.C. Starck Corporation Information
- Table 164. H.C. Starck Description and Major Businesses
- Table 165. H.C. Starck Ceramic Powder Capacity, Sales (Tons), Revenue (US$ Million), Price (US$/Kg) and Gross Margin (2018-2023)
- Table 166. H.C. Starck Ceramic Powder Product Model Numbers, Pictures, Descriptions and Specifications
- Table 167. Toyo Aluminium K.K. Corporation Information
- Table 168. Toyo Aluminium K.K. Description and Major Businesses
- Table 169. Toyo Aluminium K.K. Ceramic Powder Capacity, Sales (Tons), Revenue (US$ Million), Price (US$/Kg) and Gross Margin (2018-2023)
- Table 170. Toyo Aluminium K.K. Ceramic Powder Product Model Numbers, Pictures, Descriptions and Specifications
- Table 171. Toyo Aluminium K.K. Recent Developments
- Table 172. UBE Corporation Information
- Table 173. UBE Description
- Table 174. UBE Ceramic Powder Capacity, Sales (Tons), Revenue (US$ Million), Price (US$/Kg) and Gross Margin (2018-2023)
- Table 175. UBE Ceramic Powder Product Model Numbers, Pictures, Descriptions and Specifications
- Table 176. AlzChem Corporation Information
- Table 177. AlzChem Description
- Table 178. AlzChem Ceramic Powder Capacity, Sales (Tons), Revenue (US$ Million), Price (US$/Kg) and Gross Margin (2018-2023)
- Table 179. AlzChem Ceramic Powder Product Model Numbers, Pictures, Descriptions and Specifications
- Table 180. Denka Corporation Information
- Table 181. Denka Description and Major Businesses
- Table 182. Denka Ceramic Powder Capacity, Sales (Tons), Revenue (US$ Million), Price (US$/Kg) and Gross Margin (2018-2023)
- Table 183. Denka Ceramic Powder Product Model Numbers, Pictures, Descriptions and Specifications
- Table 184. Hebei Corefra Silicon Nitride Material Corporation Information
- Table 185. Hebei Corefra Silicon Nitride Material Description and Major Businesses
- Table 186. Hebei Corefra Silicon Nitride Material Ceramic Powder Capacity, Sales (Tons), Revenue (US$ Million), Price (US$/Kg) and Gross Margin (2018-2023)
- Table 187. Hebei Corefra Silicon Nitride Material Ceramic Powder Product Model Numbers, Pictures, Descriptions and Specifications
- Table 188. CUP New Materials Corporation Information
- Table 189. CUP New Materials Description and Major Businesses
- Table 190. CUP New Materials Ceramic Powder Capacity, Sales (Tons), Revenue (US$ Million), Price (US$/Kg) and Gross Margin (2018-2023)
- Table 191. CUP New Materials Ceramic Powder Product Model Numbers, Pictures, Descriptions and Specifications
- Table 192. 3M Corporation Information
- Table 193. 3M Description and Major Businesses
- Table 194. 3M Ceramic Powder Capacity, Sales (Tons), Revenue (US$ Million), Price (US$/Kg) and Gross Margin (2018-2023)
- Table 195. 3M Ceramic Powder Product Model Numbers, Pictures, Descriptions and Specifications
- Table 196. Sumitomo Chemical Corporation Information
- Table 197. Sumitomo Chemical Description and Major Businesses
- Table 198. Sumitomo Chemical Ceramic Powder Capacity, Sales (Tons), Revenue (US$ Million), Price (US$/Kg) and Gross Margin (2018-2023)
- Table 199. Sumitomo Chemical Ceramic Powder Product Model Numbers, Pictures, Descriptions and Specifications
- Table 200. Sumitomo Chemical Recent Developments
- Table 201. Baikowski Corporation Information
- Table 202. Baikowski Description and Major Businesses
- Table 203. Baikowski Ceramic Powder Capacity, Sales (Tons), Revenue (US$ Million), Price (US$/Kg) and Gross Margin (2018-2023)
- Table 204. Baikowski Ceramic Powder Product Model Numbers, Pictures, Descriptions and Specifications
- Table 205. Baikowski Recent Developments
- Table 206. XuanCheng JingRui New Material Corporation Information
- Table 207. XuanCheng JingRui New Material Description and Major Businesses
- Table 208. XuanCheng JingRui New Material Ceramic Powder Capacity, Sales (Tons), Revenue (US$ Million), Price (US$/Kg) and Gross Margin (2018-2023)
- Table 209. XuanCheng JingRui New Material Ceramic Powder Product Model Numbers, Pictures, Descriptions and Specifications
- Table 210. Key Raw Materials Lists
- Table 211. Raw Materials Key Suppliers Lists
- Table 212. Ceramic Powder Distributors List
- Table 213. Ceramic Powder Customers List
- Table 214. Ceramic Powder Market Trends
- Table 215. Ceramic Powder Market Drivers
- Table 216. Research Programs/Design for This Report
- Table 217. Key Data Information from Secondary Sources
- Table 218. Key Data Information from Primary Sources
- Table 219. QYR Business Unit and Senior & Team Lead Analysts
List of Figures
- Figure 1. Ceramic Powder Product Picture
- Figure 2. Global Ceramic Powder Market Size Growth Rate by Type, 2018 VS 2022 VS 2029 (US$ Million)
- Figure 3. Global Ceramic Powder Market Share by Type: 2022 & 2029
- Figure 4. High Purity Alumina Product Picture
- Figure 5. Key Manufacturers of High Purity Alumina
- Figure 6. Zirconia Product Picture
- Figure 7. Silicon Carbide Product Picture
- Figure 8. Aluminum Nitride Product Picture
- Figure 9. Silicon Nitride Product Picture
- Figure 10. Boron Carbide and Boron Nitride Product Picture
- Figure 11. Barium Titanate Product Picture
- Figure 12. Global Ceramic Powder Market Size Growth Rate by Application, 2018 VS 2022 VS 2029 (US$ Million)
- Figure 13. Global Ceramic Powder Market Share by Application in 2022 & 2029
- Figure 14. Electronic
- Figure 15. Automobile
- Figure 16. Medical
- Figure 17. Energy
- Figure 18. Aerospace and Defense
- Figure 19. General Industry
- Figure 20. Ceramic Powder Report Years Considered
- Figure 21. Global Ceramic Powder Capacity, Production and Utilization (2018-2029) & (Tons)
- Figure 22. Global Ceramic Powder Production by Region: 2018 VS 2022 VS 2029 (Tons)
- Figure 23. Global Ceramic Powder Production Market Share by Region in Percentage: 2022 Versus 2029
- Figure 24. Global Ceramic Powder Production Market Share by Region (2018-2029)
- Figure 25. Ceramic Powder Production Growth Rate in North America (2018-2029) & (Tons)
- Figure 26. Ceramic Powder Production Growth Rate in Europe (2018-2029) & (Tons)
- Figure 27. Ceramic Powder Production Growth Rate in China (2018-2029) & (Tons)
- Figure 28. Ceramic Powder Production Growth Rate in Japan (2018-2029) & (Tons)
- Figure 29. Global Ceramic Powder Revenue, (US$ Million), 2018 VS 2022 VS 2029
- Figure 30. Global Ceramic Powder Revenue 2018-2029 (US$ Million)
- Figure 31. Global Ceramic Powder Revenue (CAGR) by Region: 2018 VS 2022 VS 2029 (US$ Million)
- Figure 32. Global Ceramic Powder Revenue Market Share by Region in Percentage: 2022 Versus 2029
- Figure 33. Global Ceramic Powder Revenue Market Share by Region (2018-2029)
- Figure 34. Global Ceramic Powder Sales 2018-2029 (Tons)
- Figure 35. Global Ceramic Powder Sales (CAGR) by Region: 2018 VS 2022 VS 2029 (Tons)
- Figure 36. Global Ceramic Powder Sales Market Share by Region (2018-2029)
- Figure 37. North America Ceramic Powder Sales YoY (2018-2029) & (Tons)
- Figure 38. North America Ceramic Powder Revenue YoY (2018-2029) & (US$ Million)
- Figure 39. Europe Ceramic Powder Sales YoY (2018-2029) & (Tons)
- Figure 40. Europe Ceramic Powder Revenue YoY (2018-2029) & (US$ Million)
- Figure 41. Asia-Pacific Ceramic Powder Sales YoY (2018-2029) & (Tons)
- Figure 42. Asia-Pacific Ceramic Powder Revenue YoY (2018-2029) & (US$ Million)
- Figure 43. Latin America Ceramic Powder Sales YoY (2018-2029) & (Tons)
- Figure 44. Latin America Ceramic Powder Revenue YoY (2018-2029) & (US$ Million)
- Figure 45. Middle East and Africa Ceramic Powder Sales YoY (2018-2029) & (Tons)
- Figure 46. Middle East and Africa Ceramic Powder Revenue YoY (2018-2029) & (US$ Million)
- Figure 47. The Ceramic Powder Market Share of Top 10 and Top 5 Largest Manufacturers Around the World in 2022
- Figure 48. The Top 5 and 10 Largest Manufacturers of Ceramic Powder in the World: Market Share by Ceramic Powder Revenue in 2022
- Figure 49. Global Ceramic Powder Market Share by Company Type (Tier 1, Tier 2, and Tier 3): 2018 VS 2022
- Figure 50. Global Ceramic Powder Sales Market Share by Type (2018-2029)
- Figure 51. Global Ceramic Powder Revenue Market Share by Type (2018-2029)
- Figure 52. Global Ceramic Powder Sales Market Share by Application (2018-2029)
- Figure 53. Global Ceramic Powder Revenue Market Share by Application (2018-2029)
- Figure 54. North America Ceramic Powder Sales Market Share by Type (2018-2023)
- Figure 55. North America Ceramic Powder Sales Market Share by Type (2024-2029)
- Figure 56. North America Ceramic Powder Sales Market Share by Application (2018-2023)
- Figure 57. North America Ceramic Powder Sales Market Share by Application (2024-2029)
- Figure 58. North America Ceramic Powder Revenue Share by Country (2018-2029)
- Figure 59. North America Ceramic Powder Sales Share by Country (2018-2029)
- Figure 60. US Ceramic Powder Revenue (2018-2029) & (US$ Million)
- Figure 61. Canada Ceramic Powder Revenue (2018-2029) & (US$ Million)
- Figure 62. Europe Ceramic Powder Sales Market Share by Type (2018-2023)
- Figure 63. Europe Ceramic Powder Sales Market Share by Type (2024-2029)
- Figure 64. Europe Ceramic Powder Sales Market Share by Application (2018-2023)
- Figure 65. Europe Ceramic Powder Sales Market Share by Application (2024-2029)
- Figure 66. Europe Ceramic Powder Revenue Share by Country (2018-2029)
- Figure 67. Europe Ceramic Powder Sales Share by Country (2018-2029)
- Figure 68. Germany Ceramic Powder Revenue (2018-2029) & (US$ Million)
- Figure 69. France Ceramic Powder Revenue (2018-2029) & (US$ Million)
- Figure 70. U.K. Ceramic Powder Revenue (2018-2029) & (US$ Million)
- Figure 71. Italy Ceramic Powder Revenue (2018-2029) & (US$ Million)
- Figure 72. Russia Ceramic Powder Revenue (2018-2029) & (US$ Million)
- Figure 73. Asia-Pacific Ceramic Powder Sales Market Share by Type (2018-2023)
- Figure 74. Asia-Pacific Ceramic Powder Sales Market Share by Type (2024-2029)
- Figure 75. Asia-Pacific Ceramic Powder Sales Market Share by Application (2018-2023)
- Figure 76. Asia-Pacific Ceramic Powder Sales Market Share by Application (2024-2029)
- Figure 77. Asia-Pacific Ceramic Powder Revenue Share by Region (2018-2029)
- Figure 78. Asia-Pacific Ceramic Powder Sales Share by Region (2018-2029)
- Figure 79. China Ceramic Powder Revenue (2018-2029) & (US$ Million)
- Figure 80. Japan Ceramic Powder Revenue (2018-2029) & (US$ Million)
- Figure 81. South Korea Ceramic Powder Revenue (2018-2029) & (US$ Million)
- Figure 82. India Ceramic Powder Revenue (2018-2029) & (US$ Million)
- Figure 83. Australia Ceramic Powder Revenue (2018-2029) & (US$ Million)
- Figure 84. Southeast Asia Ceramic Powder Revenue (2018-2029) & (US$ Million)
- Figure 85. China Taiwan Ceramic Powder Revenue (2018-2029) & (US$ Million)
- Figure 86. Latin America Ceramic Powder Sales Market Share by Type (2018-2023)
- Figure 87. Latin America Ceramic Powder Sales Market Share by Type (2024-2029)
- Figure 88. Latin America Ceramic Powder Sales Market Share by Application (2018-2023)
- Figure 89. Latin America Ceramic Powder Sales Market Share by Application (2024-2029)
- Figure 90. Latin America Ceramic Powder Revenue Share by Country (2018-2029)
- Figure 91. Latin America Ceramic Powder Sales Share by Country (2018-2029)
- Figure 92. Mexico Ceramic Powder Revenue (2018-2029) & (US$ Million)
- Figure 93. Brazil Ceramic Powder Revenue (2018-2029) & (US$ Million)
- Figure 94. Middle East & Africa Ceramic Powder Sales Market Share by Type (2018-2023)
- Figure 95. Middle East & Africa Ceramic Powder Sales Market Share by Type (2024-2029)
- Figure 96. Middle East and Africa Ceramic Powder Sales Market Share by Application (2018-2023)
- Figure 97. Middle East and Africa Ceramic Powder Sales Market Share by Application (2024-2029)
- Figure 98. Middle East and Africa Ceramic Powder Revenue Share by Region (2018-2029)
- Figure 99. Middle East and Africa Ceramic Powder Sales Share by Region (2018-2029)
- Figure 100. GCC Countries Ceramic Powder Revenue (2018-2029) & (US$ Million)
- Figure 101. Turkey Ceramic Powder Revenue (2018-2029) & (US$ Million)
- Figure 102. Africa Ceramic Powder Revenue (2018-2029) & (US$ Million)
- Figure 103. Ceramic Powder Value Chain
- Figure 104. Ceramic Powder Production Process
- Figure 105. Channels of Distribution
- Figure 106. Distributors Profiles
- Figure 107. Bottom-up and Top-down Approaches for This Report
- Figure 108. Data Triangulation
- Figure 109. Key Executives Interviewed
Due to the COVID-19 pandemic and Russia-Ukraine War Influence, the Ceramic Powder market was valued at US$ 3,572.58 million in 2022 and is projected to reach US$ 6,213.17 million by 2029, at a CAGR of 5.57% during the forecast period 2023-2029.
The North America market for Ceramic Powder is estimated to increase from $ 1,011.74 million in 2023 to reach $ 1,316.34 million by 2029, at a CAGR of 4.48% during the forecast period of 2023 through 2029.
The China market for Ceramic Powder is estimated to increase from $ 747.30 million in 2023 to reach $ 1,226.44 million by 2029, at a CAGR of 8.61% during the forecast period of 2023 through 2029.
The Europe market for Ceramic Powder is estimated to increase from $ 1,076.25 million in 2023 to reach $ 1,452.95 million by 2029, at a CAGR of 5.13% during the forecast period of 2023 through 2029.
The global key manufacturers of Ceramic Powder include DKKK, Saint-Gobain, Tosoh, Solvay, KCM Corporation, Showa Denko, Orient Zirconic, Sinocera, and Nanomakers, etc. In 2022, the global top five players had a share approximately 14.27% in terms of revenue.
In terms of production side, this report researches the Ceramic Powder production, growth rate, market share by manufacturers and by region (region level and country level), from 2018 to 2023, and forecast to 2029.
In terms of consumption side, this report focuses on the sales of Ceramic Powder by region (region level and country level), by company, by Type and by Application. from 2018 to 2023 and forecast to 2029.
Report Includes:
This report presents an overview of global market for Ceramic Powder, capacity, output, revenue and price. Analyses of the global market trends, with historic market revenue/sales data for 2018 - 2022, estimates for 2023, and projections of CAGR through 2029.
This report researches the key producers of Ceramic Powder, also provides the consumption of main regions and countries. Highlights of the upcoming market potential for Ceramic Powder, and key regions/countries of focus to forecast this market into various segments and sub-segments. Country specific data and market value analysis for the U.S., Canada, Mexico, Brazil, China, Japan, South Korea, Southeast Asia, India, Germany, the U.K., Italy, Middle East, Africa, and Other Countries.
This report focuses on the Ceramic Powder sales, revenue, market share and industry ranking of main manufacturers, data from 2018 to 2023. Identification of the major stakeholders in the global Ceramic Powder market, and analysis of their competitive landscape and market positioning based on recent developments and segmental revenues. This report will help stakeholders to understand the competitive landscape and gain more insights and position their businesses and market strategies in a better way.
This report analyzes the segments data by Type and by Application, sales, revenue, and price, from 2018 to 2029. Evaluation and forecast the market size for Ceramic Powder sales, projected growth trends, production technology, application and end-user industry.
Descriptive company profiles of the major global players, including DKKK, Saint-Gobain, Tosoh, Solvay, KCM Corporation, Showa Denko, Orient Zirconic, Sinocera, and Nanomakers, etc.
By Company
- DKKK
- Saint-Gobain
- Tosoh
- Solvay
- KCM Corporation
- Showa Denko
- Orient Zirconic
- Sinocera
- Nanomakers
- Washington Mills
- Fujimi
- Hoganas
- Fiven
- Pacific Rundum
- Shin-Etsu Chemical
- Jicheng Advanced Ceramics
- Tokuyama
- H.C. Starck
- Toyo Aluminium K.K.
- UBE
- AlzChem
- Denka
- Hebei Corefra
- CUP New Materials
- 3M
- Sumitomo Chemical
- Baikowski
- XuanCheng JingRui
Segment by Type
- High Purity Alumina
- Zirconia
- Silicon Carbide
- Aluminum Nitride
- Silicon Nitride
- Boron Carbide and Boron Nitride
- Others (Barium Titanate, other Oxides)
Segment by Application
- Electronic
- Automobile
- Medical
- Energy
- Aerospace and Defense
- General Industry
- Other
Production by Region
- North America
- Europe
- China
- Japan
Sales by Region
- North America
- U.S.
- Canada
- China
- Asia-Pacific
- Japan
- South Korea
- China Taiwan
- Southeast Asia
- India
- Europe
- Germany
- France
- U.K.
- Italy
- Russia
- Middle East, Africa, Latin America
- Brazil
- Mexico
- Turkey
- Israel
- GCC Countries
Chapter Outline
- Chapter 1: Introduces the report scope of the report, executive summary of different market segments (by Type and by Application, etc), including the market size of each market segment, future development potential, and so on. It offers a high-level view of the current state of the market and its likely evolution in the short to mid-term, and long term.
- Chapter 2: Ceramic Powder production/output of global and key producers (regions/countries). It provides a quantitative analysis of the production, and development potential of each producer in the next six years.
- Chapter 3: Sales (consumption), revenue of Ceramic Powder in global, regional level and country level. It provides a quantitative analysis of the market size and development potential of each region and its main countries and introduces the market development, future development prospects, market space of each country in the world.
- Chapter 4: Detailed analysis of Ceramic Powder manufacturers competitive landscape, price, sales, revenue, market share and industry ranking, latest development plan, merger, and acquisition information, etc.
- Chapter 5: Provides the analysis of various market segments by Type, covering the sales, revenue, average price, and development potential of each market segment, to help readers find the blue ocean market in different market segments.
- Chapter 6: Provides the analysis of various market segments by Application, covering the sales, revenue, average price, and development potential of each market segment, to help readers find the blue ocean market in different downstream markets.
- Chapter 7: North America by Type, by Application and by country, sales, and revenue for each segment.
- Chapter 8: Europe by Type, by Application and by country, sales, and revenue for each segment.
- Chapter 9: Asia-Pacific by Type, by Application and by region, sales, and revenue for each segment.
- Chapter 10: Latin America by Type, by Application and by country, sales, and revenue for each segment.
- Chapter 11: Middle East, Africa, by Type, by Application and by country, sales, and revenue for each segment.
- Chapter 12: Provides profiles of key manufacturers, introducing the basic situation of the main companies in the market in detail, including product descriptions and specifications, Ceramic Powder sales, revenue, price, gross margin, and recent development, etc.
- Chapter 13: Analysis of industrial chain, sales channel, key raw materials, distributors and customers.
- Chapter 14: Introduces the market dynamics, latest developments of the market, the driving factors and restrictive factors of the market, the challenges and risks faced by manufacturers in the industry, and the analysis of relevant policies in the industry.
- Chapter 15: The main points and conclusions of the report.
Table of Contents
1 Study Coverage
- 1.1 Ceramic Powder Product Introduction
- 1.2 Market by Type
- 1.2.1 Global Ceramic Powder Market Size by Type, 2018 VS 2022 VS 2029
- 1.2.2 High Purity Alumina
- 1.2.3 Zirconia
- 1.2.4 Silicon Carbide
- 1.2.5 Aluminum Nitride
- 1.2.6 Silicon Nitride
- 1.2.7 Boron Carbide and Boron Nitride
- 1.2.8 Others (Barium Titanate, other Oxides)
- 1.3 Market by Application
- 1.3.1 Global Ceramic Powder Market Size by Application, 2018 VS 2022 VS 2029
- 1.3.2 Electronic
- 1.3.3 Automobile
- 1.3.4 Medical
- 1.3.5 Energy
- 1.3.6 Aerospace and Defense
- 1.3.7 General Industry
- 1.3.8 Others
- 1.4 Assumptions and Limitations
- 1.5 Study Objectives
- 1.6 Years Considered
2 Global Ceramic Powder Production
- 2.1 Global Ceramic Powder Production Capacity (2018-2029)
- 2.2 Global Ceramic Powder Production by Region: 2018 VS 2022 VS 2029
- 2.3 Global Ceramic Powder Production by Region
- 2.3.1 Global Ceramic Powder Historic Production by Region (2018-2023)
- 2.3.2 Global Ceramic Powder Forecasted Production by Region (2024-2029)
- 2.3.3 Global Ceramic Powder Production Market Share by Region (2018-2029)
- 2.4 North America
- 2.5 Europe
- 2.6 China
- 2.7 Japan
3 Executive Summary
- 3.1 Global Ceramic Powder Revenue Estimates and Forecasts 2018-2029
- 3.2 Global Ceramic Powder Revenue by Region
- 3.2.1 Global Ceramic Powder Revenue by Region: 2018 VS 2022 VS 2029
- 3.2.2 Global Ceramic Powder Revenue by Region (2018-2023)
- 3.2.3 Global Ceramic Powder Revenue by Region (2024-2029)
- 3.2.4 Global Ceramic Powder Revenue Market Share by Region (2018-2029)
- 3.3 Global Ceramic Powder Sales Estimates and Forecasts 2018-2029
- 3.4 Global Ceramic Powder Sales by Region
- 3.4.1 Global Ceramic Powder Sales by Region: 2018 VS 2022 VS 2029
- 3.4.2 Global Ceramic Powder Sales by Region (2018-2023)
- 3.4.3 Global Sales Ceramic Powder by Region (2024-2029)
- 3.4.4 Global Ceramic Powder Sales Market Share by Region (2018-2029)
- 3.5 North America
- 3.6 Europe
- 3.7 Asia-Pacific
- 3.8 Latin America
- 3.9 Middle East and Africa
4 Competition by Manufacturers
- 4.1 Global Ceramic Powder Sales by Manufacturers
- 4.1.1 Global Ceramic Powder Sales by Manufacturers (2018-2023)
- 4.1.2 Global Ceramic Powder Sales Market Share by Manufacturers (2018-2023)
- 4.1.3 Global Top 10 and Top 5 Largest Manufacturers of Ceramic Powder in 2022
- 4.2 Global Ceramic Powder Revenue by Manufacturers
- 4.2.1 Global Ceramic Powder Revenue by Manufacturers (2018-2023)
- 4.2.2 Global Ceramic Powder Revenue Market Share by Manufacturers (2018-2023)
- 4.2.3 Global Top 10 and Top 5 Companies by Ceramic Powder Revenue in 2022
- 4.3 Global Ceramic Powder Sales Price by Manufacturers (2018-2023)
- 4.4 Global Key Players of Ceramic Powder, Industry Ranking, 2021 VS 2022
- 4.5 Analysis of Competitive Landscape
- 4.5.1 Manufacturers Market Concentration Ratio (CR5 and HHI)
- 4.5.2 Global Ceramic Powder Market Share by Company Type (Tier 1, Tier 2, and Tier 3)
- 4.6 Global Key Manufacturers of Ceramic Powder Headquarters Distribution
- 4.7 Global Key Manufacturers of Ceramic Powder Product Offered
- 4.8 Establishing Date of Global Key Manufacturers of Ceramic Powder Industry
5 Market Size by Type
- 5.1 Global Ceramic Powder Sales by Type
- 5.1.1 Global Ceramic Powder Historical Sales by Type (2018-2023)
- 5.1.2 Global Ceramic Powder Forecasted Sales by Type (2024-2029)
- 5.1.3 Global Ceramic Powder Sales Market Share by Type (2018-2029)
- 5.2 Global Ceramic Powder Revenue by Type
- 5.2.1 Global Ceramic Powder Historical Revenue by Type (2018-2023)
- 5.2.2 Global Ceramic Powder Forecasted Revenue by Type (2024-2029)
- 5.2.3 Global Ceramic Powder Revenue Market Share by Type (2018-2029)
- 5.3 Global Ceramic Powder Price by Type
- 5.3.1 Global Ceramic Powder Price by Type (2018-2023)
- 5.3.2 Global Ceramic Powder Price Forecast by Type (2024-2029)
6 Market Size by Application
- 6.1 Global Ceramic Powder Sales by Application
- 6.1.1 Global Ceramic Powder Historical Sales by Application (2018-2023)
- 6.1.2 Global Ceramic Powder Forecasted Sales by Application (2024-2029)
- 6.1.3 Global Ceramic Powder Sales Market Share by Application (2018-2029)
- 6.2 Global Ceramic Powder Revenue by Application
- 6.2.1 Global Ceramic Powder Historical Revenue by Application (2018-2023)
- 6.2.2 Global Ceramic Powder Forecasted Revenue by Application (2024-2029)
- 6.2.3 Global Ceramic Powder Revenue Market Share by Application (2018-2029)
- 6.3 Global Ceramic Powder Price by Application
- 6.3.1 Global Ceramic Powder Price by Application (2018-2023)
- 6.3.2 Global Ceramic Powder Price Forecast by Application (2024-2029)
7 North America
- 7.1 North America Ceramic Powder Market by Type
- 7.1.1 North America Ceramic Powder Sales by Type (2018-2023)
- 7.1.2 North America Ceramic Powder Sales by Type (2024-2029)
- 7.2 North America Ceramic Powder Market by Application
- 7.2.1 North America Ceramic Powder Sales by Application (2018-2029)
- 7.2.2 North America Ceramic Powder Sales by Application (2024-2029)
- 7.3 North America Ceramic Powder Market Size by Country
- 7.3.1 North America Ceramic Powder Revenue by Country: 2018 VS 2022 VS 2029
- 7.3.2 North America Ceramic Powder Revenue by Country (2018-2029)
- 7.3.3 North America Ceramic Powder Sales by Country (2018-2029)
- 7.3.4 US
- 7.3.5 Canada
8 Europe
- 8.1 Europe Ceramic Powder Market by Type
- 8.1.1 Europe Ceramic Powder Sales by Type (2018-2023)
- 8.1.2 Europe Ceramic Powder Sales by Type (2024-2029)
- 8.2 Europe Ceramic Powder Market by Application
- 8.2.1 Europe Ceramic Powder Sales by Application (2018-2029)
- 8.2.2 Europe Ceramic Powder Sales by Application (2024-2029)
- 8.3 Europe Ceramic Powder Market Size by Country
- 8.3.1 Europe Ceramic Powder Revenue by Country: 2018 VS 2022 VS 2029
- 8.3.2 Europe Ceramic Powder Revenue by Country (2018-2029)
- 8.3.3 Europe Ceramic Powder Sales by Country (2018-2029)
- 8.3.4 Germany
- 8.3.5 France
- 8.3.6 U.K.
- 8.3.7 Italy
- 8.3.8 Russia
9 Asia-Pacific
- 9.1 Asia-Pacific Ceramic Powder Market by Type
- 9.1.1 Asia-Pacific Ceramic Powder Sales by Type (2018-2023)
- 9.1.2 Asia-Pacific Ceramic Powder Sales by Type (2024-2029)
- 9.2 Asia-Pacific Ceramic Powder Market by Application
- 9.2.1 Asia-Pacific Ceramic Powder Sales by Application (2018-2029)
- 9.2.2 Asia-Pacific Ceramic Powder Sales by Application (2024-2029)
- 9.3 Asia-Pacific Ceramic Powder Market Size by Region
- 9.3.1 Asia-Pacific Ceramic Powder Revenue by Region: 2018 VS 2022 VS 2029
- 9.3.2 Asia-Pacific Ceramic Powder Revenue by Region (2018-2029)
- 9.3.3 Asia-Pacific Ceramic Powder Sales by Region (2018-2029)
- 9.3.4 China
- 9.3.5 Japan
- 9.3.6 South Korea
- 9.3.7 India
- 9.3.8 Australia
- 9.3.9 Southeast Asia
- 9.3.10 China Taiwan
10 Latin America
- 10.1 Latin America Ceramic Powder Market by Type
- 10.1.1 Latin America Ceramic Powder Sales by Type (2018-2023)
- 10.1.2 Latin America Ceramic Powder Sales by Type (2024-2029)
- 10.2 Latin America Ceramic Powder Market by Application
- 10.2.1 Latin America Ceramic Powder Sales by Application (2018-2029)
- 10.2.2 Latin America Ceramic Powder Sales by Application (2024-2029)
- 10.3 Latin America Ceramic Powder Market Size by Country
- 10.3.1 Latin America Ceramic Powder Revenue by Country: 2018 VS 2022 VS 2029
- 10.3.2 Latin America Ceramic Powder Revenue by Country (2018-2029)
- 10.3.3 Latin America Ceramic Powder Sales by Country (2018-2029)
- 10.3.4 Mexico
- 10.3.5 Brazil
11 Middle East and Africa
- 11.1 Middle East & Africa Ceramic Powder Market by Type
- 11.1.1 Middle East & Africa Ceramic Powder Sales by Type (2018-2023)
- 11.1.2 Middle East & Africa Ceramic Powder Sales by Type (2024-2029)
- 11.2 Middle East and Africa Ceramic Powder Market by Application
- 11.2.1 Middle East and Africa Ceramic Powder Sales by Application (2018-2029)
- 11.2.2 Middle East and Africa Ceramic Powder Sales by Application (2024-2029)
- 11.3 Middle East and Africa Ceramic Powder Market Size by Region
- 11.3.1 Middle East and Africa Ceramic Powder Revenue by Region: 2018 VS 2022 VS 2029
- 11.3.2 Middle East and Africa Ceramic Powder Revenue by Region (2018-2029)
- 11.3.3 Middle East and Africa Ceramic Powder Sales by Region (2018-2029)
- 11.3.4 GCC Countries
- 11.3.5 Turkey
- 11.3.6 Africa
12 Corporate Profile
- 12.1 DKKK
- 12.1.1 DKKK Corporation Information
- 12.1.2 DKKK Overview
- 12.1.3 DKKK Ceramic Powder Capacity, Sales, Price, Revenue and Gross Margin (2018-2023)
- 12.1.4 DKKK Ceramic Powder Product Model Numbers, Pictures, Descriptions and Specifications
- 12.2 Saint-Gobain
- 12.2.1 Saint-Gobain Corporation Information
- 12.2.2 Saint-Gobain Overview
- 12.2.3 Saint-Gobain Ceramic Powder Capacity, Sales, Price, Revenue and Gross Margin (2018-2023)
- 12.2.4 Saint-Gobain Ceramic Powder Product Model Numbers, Pictures, Descriptions and Specifications
- 12.3 Tosoh
- 12.3.1 Tosoh Corporation Information
- 12.3.2 Tosoh Overview
- 12.3.3 Tosoh Ceramic Powder Capacity, Sales, Price, Revenue and Gross Margin (2018-2023)
- 12.3.4 Tosoh Ceramic Powder Product Model Numbers, Pictures, Descriptions and Specifications
- 12.3.5 Tosoh Recent Developments
- 12.4 Solvay
- 12.4.1 Solvay Corporation Information
- 12.4.2 Solvay Overview
- 12.4.3 Solvay Ceramic Powder Capacity, Sales, Price, Revenue and Gross Margin (2018-2023)
- 12.4.4 Solvay Ceramic Powder Product Model Numbers, Pictures, Descriptions and Specifications
- 12.5 KCM Corporation
- 12.5.1 KCM Corporation Corporation Information
- 12.5.2 KCM Corporation Overview
- 12.5.3 KCM Corporation Ceramic Powder Capacity, Sales, Price, Revenue and Gross Margin (2018-2023)
- 12.5.4 KCM Corporation Ceramic Powder Product Model Numbers, Pictures, Descriptions and Specifications
- 12.6 Showa Denko
- 12.6.1 Showa Denko Corporation Information
- 12.6.2 Showa Denko Overview
- 12.6.3 Showa Denko Ceramic Powder Capacity, Sales, Price, Revenue and Gross Margin (2018-2023)
- 12.6.4 Showa Denko Ceramic Powder Product Model Numbers, Pictures, Descriptions and Specifications
- 12.7 Orient Zirconic
- 12.7.1 Orient Zirconic Corporation Information
- 12.7.2 Orient Zirconic Overview
- 12.7.3 Orient Zirconic Ceramic Powder Capacity, Sales, Price, Revenue and Gross Margin (2018-2023)
- 12.7.4 Orient Zirconic Ceramic Powder Product Model Numbers, Pictures, Descriptions and Specifications
- 12.8 Sinocera
- 12.8.1 Sinocera Corporation Information
- 12.8.2 Sinocera Overview
- 12.8.3 Sinocera Ceramic Powder Capacity, Sales, Price, Revenue and Gross Margin (2018-2023)
- 12.8.4 Sinocera Ceramic Powder Product Model Numbers, Pictures, Descriptions and Specifications
- 12.9 Nanomakers
- 12.9.1 Nanomakers Corporation Information
- 12.9.2 Nanomakers Overview
- 12.9.3 Nanomakers Ceramic Powder Capacity, Sales, Price, Revenue and Gross Margin (2018-2023)
- 12.9.4 Nanomakers Ceramic Powder Product Model Numbers, Pictures, Descriptions and Specifications
- 12.10 Washington Mills
- 12.10.1 Washington Mills Corporation Information
- 12.10.2 Washington Mills Overview
- 12.10.3 Washington Mills Ceramic Powder Capacity, Sales, Price, Revenue and Gross Margin (2018-2023)
- 12.10.4 Washington Mills Ceramic Powder Product Model Numbers, Pictures, Descriptions and Specifications
- 12.11 Fujimi
- 12.11.1 Fujimi Corporation Information
- 12.11.2 Fujimi Overview
- 12.11.3 Fujimi Ceramic Powder Capacity, Sales, Price, Revenue and Gross Margin (2018-2023)
- 12.11.4 Fujimi Ceramic Powder Product Model Numbers, Pictures, Descriptions and Specifications
- 12.12 Hoganas
- 12.12.1 Hoganas Corporation Information
- 12.12.2 Hoganas Overview
- 12.12.3 Hoganas Ceramic Powder Capacity, Sales, Price, Revenue and Gross Margin (2018-2023)
- 12.12.4 Hoganas Ceramic Powder Product Model Numbers, Pictures, Descriptions and Specifications
- 12.12.5 Hoganas Recent Developments
- 12.13 Fiven
- 12.13.1 Fiven Corporation Information
- 12.13.2 Fiven Overview
- 12.13.3 Fiven Ceramic Powder Capacity, Sales, Price, Revenue and Gross Margin (2018-2023)
- 12.13.4 Fiven Ceramic Powder Product Model Numbers, Pictures, Descriptions and Specifications
- 12.14 Pacific Rundum
- 12.14.1 Pacific Rundum Corporation Information
- 12.14.2 Pacific Rundum Overview
- 12.14.3 Pacific Rundum Ceramic Powder Capacity, Sales, Price, Revenue and Gross Margin (2018-2023)
- 12.14.4 Pacific Rundum Ceramic Powder Product Model Numbers, Pictures, Descriptions and Specifications
- 12.15 Shin-Etsu Chemical
- 12.15.1 Shin-Etsu Chemical Corporation Information
- 12.15.2 Shin-Etsu Chemical Overview
- 12.15.3 Shin-Etsu Chemical Ceramic Powder Capacity, Sales, Price, Revenue and Gross Margin (2018-2023)
- 12.15.4 Shin-Etsu Chemical Ceramic Powder Product Model Numbers, Pictures, Descriptions and Specifications
- 12.15.5 Shin-Etsu Chemical Recent Developments
- 12.16 Jicheng Advanced Ceramics
- 12.16.1 Jicheng Advanced Ceramics Corporation Information
- 12.16.2 Jicheng Advanced Ceramics Overview
- 12.16.3 Jicheng Advanced Ceramics Ceramic Powder Capacity, Sales, Price, Revenue and Gross Margin (2018-2023)
- 12.16.4 Jicheng Advanced Ceramics Ceramic Powder Product Model Numbers, Pictures, Descriptions and Specifications
- 12.17 Tokuyama
- 12.17.1 Tokuyama Corporation Information
- 12.17.2 Tokuyama Overview
- 12.17.3 Tokuyama Ceramic Powder Capacity, Sales, Price, Revenue and Gross Margin (2018-2023)
- 12.17.4 Tokuyama Ceramic Powder Product Model Numbers, Pictures, Descriptions and Specifications
- 12.17.5 Tokuyama Recent Developments
- 12.18 H.C. Starck
- 12.18.1 H.C. Starck Corporation Information
- 12.18.2 H.C. Starck Overview
- 12.18.3 H.C. Starck Ceramic Powder Capacity, Sales, Price, Revenue and Gross Margin (2018-2023)
- 12.18.4 H.C. Starck Ceramic Powder Product Model Numbers, Pictures, Descriptions and Specifications
- 12.19 Toyo Aluminium K.K.
- 12.19.1 Toyo Aluminium K.K. Corporation Information
- 12.19.2 Toyo Aluminium K.K. Overview
- 12.19.3 Toyo Aluminium K.K. Ceramic Powder Capacity, Sales, Price, Revenue and Gross Margin (2018-2023)
- 12.19.4 Toyo Aluminium K.K. Ceramic Powder Product Model Numbers, Pictures, Descriptions and Specifications
- 12.19.5 Toyo Aluminium K.K. Recent Developments
- 12.20 UBE
- 12.20.1 UBE Corporation Information
- 12.20.2 UBE Overview
- 12.20.3 UBE Ceramic Powder Capacity, Sales, Price, Revenue and Gross Margin (2018-2023)
- 12.20.4 UBE Ceramic Powder Product Model Numbers, Pictures, Descriptions and Specifications
- 12.21 AlzChem
- 12.21.1 AlzChem Corporation Information
- 12.21.2 AlzChem Overview
- 12.21.3 AlzChem Ceramic Powder Capacity, Sales, Price, Revenue and Gross Margin (2018-2023)
- 12.21.4 AlzChem Ceramic Powder Product Model Numbers, Pictures, Descriptions and Specifications
- 12.22 Denka
- 12.22.1 Denka Corporation Information
- 12.22.2 Denka Overview
- 12.22.3 Denka Ceramic Powder Capacity, Sales, Price, Revenue and Gross Margin (2018-2023)
- 12.22.4 Denka Ceramic Powder Product Model Numbers, Pictures, Descriptions and Specifications
- 12.23 Hebei Corefra Silicon Nitride Material
- 12.23.1 Hebei Corefra Silicon Nitride Material Corporation Information
- 12.23.2 Hebei Corefra Silicon Nitride Material Overview
- 12.23.3 Hebei Corefra Silicon Nitride Material Ceramic Powder Capacity, Sales, Price, Revenue and Gross Margin (2018-2023)
- 12.23.4 Hebei Corefra Silicon Nitride Material Ceramic Powder Product Model Numbers, Pictures, Descriptions and Specifications
- 12.24 CUP New Materials
- 12.24.1 CUP New Materials Corporation Information
- 12.24.2 CUP New Materials Overview
- 12.24.3 CUP New Materials Ceramic Powder Capacity, Sales, Price, Revenue and Gross Margin (2018-2023)
- 12.24.4 CUP New Materials Ceramic Powder Product Model Numbers, Pictures, Descriptions and Specifications
- 12.25 3M
- 12.25.1 3M Corporation Information
- 12.25.2 3M Overview
- 12.25.3 3M Ceramic Powder Capacity, Sales, Price, Revenue and Gross Margin (2018-2023)
- 12.25.4 3M Ceramic Powder Product Model Numbers, Pictures, Descriptions and Specifications
- 12.26 Sumitomo Chemical
- 12.26.1 Sumitomo Chemical Corporation Information
- 12.26.2 Sumitomo Chemical Overview
- 12.26.3 Sumitomo Chemical Ceramic Powder Capacity, Sales, Price, Revenue and Gross Margin (2018-2023)
- 12.26.4 Sumitomo Chemical Ceramic Powder Product Model Numbers, Pictures, Descriptions and Specifications
- 12.26.5 Sumitomo Chemical Recent Developments
- 12.27 Baikowski
- 12.27.1 Baikowski Corporation Information
- 12.27.2 Baikowski Overview
- 12.27.3 Baikowski Ceramic Powder Capacity, Sales, Price, Revenue and Gross Margin (2018-2023)
- 12.27.4 Baikowski Ceramic Powder Product Model Numbers, Pictures, Descriptions and Specifications
- 12.27.5 Baikowski Recent Developments
- 12.28 XuanCheng JingRui New Material
- 12.28.1 XuanCheng JingRui New Material Corporation Information
- 12.28.2 XuanCheng JingRui New Material Overview
- 12.28.3 XuanCheng JingRui New Material Ceramic Powder Capacity, Sales, Price, Revenue and Gross Margin (2018-2023)
- 12.28.4 XuanCheng JingRui New Material Ceramic Powder Product Model Numbers, Pictures, Descriptions and Specifications
13 Industry Chain and Sales Channels Analysis
- 13.1 Ceramic Powder Industry Chain Analysis
- 13.2 Ceramic Powder Key Raw Materials
- 13.2.1 Key Raw Materials
- 13.2.2 Raw Materials Key Suppliers
- 13.3 Ceramic Powder Production Mode & Process
- 13.4 Ceramic Powder Sales and Marketing
- 13.4.1 Ceramic Powder Sales Channels
- 13.4.2 Ceramic Powder Distributors
- 13.5 Ceramic Powder Customers
14 Ceramic Powder Market Dynamics
- 14.1.1 Ceramic Powder Industry Trends
- 14.1.2 Ceramic Powder Market Drivers
- 14.1.3 Ceramic Powder Market Challenges
15 Key Findings in the Global Ceramic Powder Study
16 Appendix
- 16.1 Research Methodology
- 16.1.1 Methodology/Research Approach
- 16.1.2 Data Source
- 16.2 Author Details
- 16.3 Disclaimer