|
|
市場調査レポート
商品コード
1286652
クロスローラーガイドの世界市場:2023年Global Cross Roller Guides Market Research Report 2023 |
||||||
|
|
|||||||
カスタマイズ可能
適宜更新あり
|
|||||||


| クロスローラーガイドの世界市場:2023年 |
|
出版日: 2023年06月05日
発行: QYResearch
ページ情報: 英文 185 Pages
納期: 2~3営業日
|

- 全表示
- 概要
- 図表
- 目次
世界のクロスローラーガイドの市場規模は、2022年の9億3,000万米ドルから、予測期間中は7.08%のCAGRで推移し、2029年には15億7,300万米ドルの規模に成長すると予測されています。
中国および台湾のクロスローラーガイドの市場規模は2022年に2億480万米ドルを示し、米国および日本のクロスローラーガイドはそれぞれ1億100万米ドル、1億6,600万米ドルを記録しました。
当レポートでは、世界のクロスローラーガイドの市場を調査し、市場および製品の概要、競合情勢、市場規模の推移・予測、各種区分・地域/主要国別の詳細分析、価格動向、市場成長への各種影響因子の分析、産業チェーン、主要企業の分析などをまとめています。
目次
第1章 クロスローラーガイド:市場概要
- 製品の定義
- クロスローラーガイド:タイプ別
- 成長率分析
- クロスローラーガイド:用途別
- 成長率分析
- 工作機械
- 光学機器
- 医療機器
- 半導体装置
- 測定・検査機器
- その他
- 世界市場の成長見通し
- 前提・制約
第2章 製造業者・競合情勢
- 製造数シェアの推移・予測:製造業者別
- 製造額シェアの推移・予測:製造業者別
- 主要企業・業界ランキング
- 市場シェア:企業タイプ別(Tier 1、Tier 2、Tier 3)
- 平均価格:製造業者別
- 主要製造業者の製造拠点および本社
- 競合情勢・動向
第3章 クロスローラーガイドの製造動向:地域別
- 製造額の推計・予測:2018 VS 2022 VS 2029
- 製造額の推移・予測
- 製造数の推移・予測:2018 VS 2022 VS 2029
- 製造数の推移・予測
- 価格分析
- 製造数・製造額・前年比成長率
- 中国
- 日本
- 韓国
- その他
第4章 クロスローラーガイドの消費動向:地域別
- 消費数の推移・予測:2018 VS 2022 VS 2029
- 消費数の推移・予測
- 北米
- 欧州
- アジア太平洋
第5章 タイプ別の分類
- 製造数の推移・予測
- 製造額の推移・予測
- 価格の推移・予測
第6章 用途別の分類
- 製造数の推移・予測
- 製造額の推移・予測
- 価格の推移・予測
第7章 主要企業の概要
- Nippon Thompson
- HIWIN
- THK
- NSK
- Bosch Rexroth
- AirTAC
- Schneeberger
- Nippon Bearing
- Union Tool
- Won ST
- SBC
- MID
- Ewellix
- OZAK Seiko
- Rodriguez GmbH
- Del-Tron Precision
- GMT Global Inc
- PM BV
- VV Mujumdar
- BSQ
- Dongguan Swissberger
第8章 産業チェーン・販売チャネルの分析
- 産業チェーン分析
- 主な原材料
- 販売・マーケティング
- 顧客
第9章 クロスローラーガイドの市場力学
- 産業動向
- 市場促進要因
- 市場抑制要因・課題
第10章 調査結果・総論
第11章 調査手法・データソース
List of Tables
- Table 1. Difference Between Ball Guide and Roller Guide
- Table 2. Global Cross Roller Guides Market Value by Type, (US$ Million) & (2022 VS 2029)
- Table 3. Global Cross Roller Guides Market Value by Application, (US$ Million) & (2022 VS 2029)
- Table 4. Global Cross Roller Guides Production by Manufacturers (2018-2023) & (K Units)
- Table 5. Global Cross Roller Guides Production Market Share by Manufacturers (2018-2023)
- Table 6. Global Cross Roller Guides Production Value by Manufacturers (2018-2023) & (US$ Million)
- Table 7. Global Cross Roller Guides Production Value Share by Manufacturers (2018-2023)
- Table 8. Global Key Players of Cross Roller Guides, Industry Ranking, 2021 VS 2022
- Table 9. Global Company Type (Tier 1, Tier 2, and Tier 3) & (based on the Production Value in Cross Roller Guides as of 2022)
- Table 10. Global Market Cross Roller Guides Average Price by Manufacturers (US$/Unit) & (2018-2023)
- Table 11. Global Key Manufacturers of Cross Roller Guides, Manufacturing Sites & Headquarters
- Table 12. Global Cross Roller Guides Manufacturers Market Concentration Ratio (CR5 and HHI)
- Table 13. Global Cross Roller Guides Production Value Growth Rate by Region: 2018 VS 2022 VS 2029 (US$ Million)
- Table 14. Global Cross Roller Guides Production Value (US$ Million) by Region (2018-2023)
- Table 15. Global Cross Roller Guides Production Value Market Share by Region (2018-2023)
- Table 16. Global Cross Roller Guides Production Value (US$ Million) Forecast by Region (2024-2029)
- Table 17. Global Cross Roller Guides Production Value Market Share Forecast by Region (2024-2029)
- Table 18. Global Cross Roller Guides Production Comparison by Region: 2018 VS 2022 VS 2029 (K Units)
- Table 19. Global Cross Roller Guides Production (K Units) by Region (2018-2023)
- Table 20. Global Cross Roller Guides Production Market Share by Region (2018-2023)
- Table 21. Global Cross Roller Guides Production (K Units) Forecast by Region (2024-2029)
- Table 22. Global Cross Roller Guides Production Market Share Forecast by Region (2024-2029)
- Table 23. Global Cross Roller Guides Market Average Price (US$/Unit) by Region (2018-2023)
- Table 24. Global Cross Roller Guides Market Average Price (US$/Unit) by Region (2024-202*)
- Table 25. Global Cross Roller Guides Consumption Growth Rate by Region: 2018 VS 2022 VS 2029 (K Units)
- Table 26. Global Cross Roller Guides Consumption by Region (2018-2023) & (K Units)
- Table 27. Global Cross Roller Guides Consumption Market Share by Region (2018-2023)
- Table 28. Global Cross Roller Guides Forecasted Consumption by Region (2024-2029) & (K Units)
- Table 29. Global Cross Roller Guides Forecasted Consumption Market Share by Region (2018-2023)
- Table 30. North America Cross Roller Guides Consumption Growth Rate by Country: 2018 VS 2022 VS 2029 (K Units)
- Table 31. North America Cross Roller Guides Consumption by Country (2018-2023) & (K Units)
- Table 32. North America Cross Roller Guides Consumption by Country (2024-2029) & (K Units)
- Table 33. Europe Cross Roller Guides Consumption Growth Rate by Country: 2018 VS 2022 VS 2029 (K Units)
- Table 34. Europe Cross Roller Guides Consumption by Country (2018-2023) & (K Units)
- Table 35. Europe Cross Roller Guides Consumption by Country (2024-2029) & (K Units)
- Table 36. Asia Pacific Cross Roller Guides Consumption Growth Rate by Country: 2018 VS 2022 VS 2029 (K Units)
- Table 37. Asia Pacific Cross Roller Guides Consumption by Region (2018-2023) & (K Units)
- Table 38. Asia Pacific Cross Roller Guides Consumption by Region (2024-2029) & (K Units)
- Table 39. Global Cross Roller Guides Production (K Units) by Type (2018-2023)
- Table 40. Global Cross Roller Guides Production (K Units) by Type (2024-2029)
- Table 41. Global Cross Roller Guides Production Market Share by Type (2018-2023)
- Table 42. Global Cross Roller Guides Production Market Share by Type (2024-2029)
- Table 43. Global Cross Roller Guides Production Value (US$ Million) by Type (2018-2023)
- Table 44. Global Cross Roller Guides Production Value (US$ Million) by Type (2024-2029)
- Table 45. Global Cross Roller Guides Production Value Market Share by Type (2018-2023)
- Table 46. Global Cross Roller Guides Production Value Market Share by Type (2024-2029)
- Table 47. Global Cross Roller Guides Price (US$/Unit) by Type (2018-2023)
- Table 48. Global Cross Roller Guides Price (US$/Unit) by Type (2024-2029)
- Table 49. Global Cross Roller Guides Production (K Units) by Application (2018-2023)
- Table 50. Global Cross Roller Guides Production (K Units) by Application (2024-2029)
- Table 51. Global Cross Roller Guides Production Market Share by Application (2018-2023)
- Table 52. Global Cross Roller Guides Production Market Share by Application (2024-2029)
- Table 53. Global Cross Roller Guides Production Value (US$ Million) by Application (2018-2023)
- Table 54. Global Cross Roller Guides Production Value (US$ Million) by Application (2024-2029)
- Table 55. Global Cross Roller Guides Production Value Market Share by Application (2018-2023)
- Table 56. Global Cross Roller Guides Production Value Market Share by Application (2024-2029)
- Table 57. Global Cross Roller Guides Price (US$/Unit) by Application (2018-2023)
- Table 58. Global Cross Roller Guides Price (US$/Unit) by Application (2024-2029)
- Table 59. Nippon Thompson Cross Roller Guides Company Information
- Table 60. Nippon Thompson Cross Roller Guides Specification and Application
- Table 61. Nippon Thompson Cross Roller Guides Production (K Units), Value (US$ Million), Price (US$/Unit) and Gross Margin (2018-2023)
- Table 62. HIWIN Cross Roller Guides Company Information
- Table 63. HIWIN Cross Roller Guides Specification and Application
- Table 64. HIWIN Cross Roller Guides Production (K Units), Value (US$ Million), Price (US$/Unit) and Gross Margin (2018-2023)
- Table 65. THK Cross Roller Guides Company Information
- Table 66. THK Cross Roller Guides Specification and Application
- Table 67. THK Cross Roller Guides Production (K Units), Value (US$ Million), Price (US$/Unit) and Gross Margin (2018-2023)
- Table 68. THK Recent Developments/Updates
- Table 69. NSK Cross Roller Guides Company Information
- Table 70. NSK Cross Roller Guides Specification and Application
- Table 71. NSK Cross Roller Guides Production (K Units), Value (US$ Million), Price (US$/Unit) and Gross Margin (2018-2023)
- Table 72. NSK Recent Developments/Updates
- Table 73. Bosch Rexroth Cross Roller Guides Company Information
- Table 74. Bosch Rexroth Cross Roller Guides Specification and Application
- Table 75. Bosch Rexroth Cross Roller Guides Production (K Units), Value (US$ Million), Price (US$/Unit) and Gross Margin (2018-2023)
- Table 76. Bosch Rexroth Recent Developments/Updates
- Table 77. AirTAC Cross Roller Guides Company Information
- Table 78. AirTAC Cross Roller Guides Specification and Application
- Table 79. AirTAC Cross Roller Guides Production (K Units), Value (US$ Million), Price (US$/Unit) and Gross Margin (2019-2023)
- Table 80. Schneeberger Cross Roller Guides Company Information
- Table 81. Schneeberger Cross Roller Guides Specification and Application
- Table 82. Schneeberger Cross Roller Guides Production (K Units), Value (US$ Million), Price (US$/Unit) and Gross Margin (2018-2023)
- Table 83. Schneeberger Recent Developments/Updates
- Table 84. Nippon Bearing Cross Roller Guides Company Information
- Table 85. Nippon Bearing Cross Roller Guides Specification and Application
- Table 86. Nippon Bearing Cross Roller Guides Production (K Units), Value (US$ Million), Price (US$/Unit) and Gross Margin (2018-2023)
- Table 87. Union Tool Cross Roller Guides Company Information
- Table 88. Union Tool Cross Roller Guides Specification and Application
- Table 89. Union Tool Cross Roller Guides Production (K Units), Value (US$ Million), Price (US$/Unit) and Gross Margin (2018-2023)
- Table 90. Won ST Cross Roller Guides Company Information
- Table 91. Won ST Cross Roller Guides Specification and Application
- Table 92. Won ST Cross Roller Guides Production (K Units), Value (US$ Million), Price (US$/Unit) and Gross Margin (2018-2023)
- Table 93. SBC Cross Roller Guides Company Information
- Table 94. SBC Cross Roller Guides Specification and Application
- Table 95. SBC Cross Roller Guides Production (K Units), Value (US$ Million), Price (US$/Unit) and Gross Margin (2018-2023)
- Table 96. MID Cross Roller Guides Company Information
- Table 97. MID Cross Roller Guides Specification and Application
- Table 98. MID Cross Roller Guides Production (K Units), Value (US$ Million), Price (US$/Unit) and Gross Margin (2018-2023)
- Table 99. Ewellix Cross Roller Guides Company Information
- Table 100. Ewellix Cross Roller Guides Specification and Application
- Table 101. Ewellix Cross Roller Guides Production (K Units), Value (US$ Million), Price (US$/Unit) and Gross Margin (2018-2023)
- Table 102. OZAK Seiko Cross Roller Guides Company Information
- Table 103. OZAK Seiko Cross Roller Guides Specification and Application
- Table 104. OZAK Seiko Cross Roller Guides Production (K Units), Value (US$ Million), Price (US$/Unit) and Gross Margin (2018-2023)
- Table 105. Rodriguez GmbH Cross Roller Guides Company Information
- Table 106. Rodriguez GmbH Cross Roller Guides Specification and Application
- Table 107. Rodriguez GmbH Cross Roller Guides Production (K Units), Value (US$ Million), Price (US$/Unit) and Gross Margin (2018-2023)
- Table 108. Del-Tron Precision Cross Roller Guides Company Information
- Table 109. Del-Tron Precision Cross Roller Guides Specification and Application
- Table 110. Del-Tron Precision Cross Roller Guides Production (K Units), Value (US$ Million), Price (US$/Unit) and Gross Margin (2018-2023)
- Table 111. GMT Global Inc Cross Roller Guides Company Information
- Table 112. GMT Global Inc Cross Roller Guides Specification and Application
- Table 113. GMT Global Inc Cross Roller Guides Production (K Units), Value (US$ Million), Price (US$/Unit) and Gross Margin (2018-2023)
- Table 114. PM BV Cross Roller Guides Company Information
- Table 115. PM BV Cross Roller Guides Specification and Application
- Table 116. PM BV Cross Roller Guides Production (K Units), Value (US$ Million), Price (US$/Unit) and Gross Margin (2018-2023)
- Table 117. PM BV Recent Developments/Updates
- Table 118. VV Mujumdar Cross Roller Guides Company Information
- Table 119. VV Mujumdar Cross Roller Guides Production (K Units), Value (US$ Million), Price (US$/Unit) and Gross Margin (2018-2023)
- Table 120. BSQ Cross Roller Guides Company Information
- Table 121. BSQ Cross Roller Guides Specification and Application
- Table 122. BSQ Cross Roller Guides Production (K Units), Value (US$ Million), Price (US$/Unit) and Gross Margin (2018-2023)
- Table 123. Dongguan Swissberger Cross Roller Guides Company Information
- Table 124. Dongguan Swissberger Cross Roller Guides Specification and Application
- Table 125. Dongguan Swissberger Cross Roller Guides Production (K Units), Value (US$ Million), Price (US$/Unit) and Gross Margin (2018-2023)
- Table 126. Raw Materials Key Suppliers Lists
- Table 127. Cross Roller Guides Distributors List
- Table 128. Cross Roller Guides Customers List
- Table 129. Research Programs/Design for This Report
- Table 130. Key Data Information from Secondary Sources
- Table 131. Key Data Information from Primary Sources
- Table 132. Authors List of This Report
- Table 133. QYR Business Unit and Senior & Team Lead Analysts
List of Figures
- Figure 1. Product Picture of Cross Roller Guides
- Figure 2. Global Cross Roller Guides Market Value by Type, (US$ Million) & (2018-2029)
- Figure 3. Global Cross Roller Guides Market Share by Type: 2022 VS 2029
- Figure 4. Global Cross Roller Guides Market Value by Application, (US$ Million) & (2018-2029)
- Figure 5. Global Cross Roller Guides Market Share by Application: 2022 VS 2029
- Figure 6. Machine Tool
- Figure 7. Optical Equipment
- Figure 8. Medical Equipment
- Figure 9. Semiconductor Equipment
- Figure 10. Measurement/Inspection Equipment
- Figure 11. LED Bonder
- Figure 12. Global Cross Roller Guides Production Value (US$ Million), 2018 VS 2022 VS 2029
- Figure 13. Global Cross Roller Guides Production Value (US$ Million) & (2018-2029)
- Figure 14. Global Cross Roller Guides Production (K Units) & (2018-2029)
- Figure 15. Global Cross Roller Guides Average Price (US$/Unit) & (2018-2029)
- Figure 16. Cross Roller Guides Report Years Considered
- Figure 17. Cross Roller Guides Production Share by Manufacturers in 2022
- Figure 18. Cross Roller Guides Market Share by Company Type (Tier 1, Tier 2, and Tier 3): 2018 VS 2022
- Figure 19. The Global 5 and 10 Largest Players: Market Share by Cross Roller Guides Revenue in 2022
- Figure 20. Global Cross Roller Guides Production Value Comparison by Region: 2018- 2029 (US$ Million)
- Figure 21. Global Cross Roller Guides Production Value Market Share by Region: 2018- 2029
- Figure 22. Global Cross Roller Guides Production Comparison by Region: 2018-2029 (K Units)
- Figure 23. Global Cross Roller Guides Production Market Share by Region: 2018-2029
- Figure 24. China Cross Roller Guides Production Value (US$ Million) Growth Rate (2018-2029)
- Figure 25. Japan Cross Roller Guides Production Value (US$ Million) Growth Rate (2018-2029)
- Figure 26. South Korea Cross Roller Guides Production Value (US$ Million) Growth Rate (2018-2029)
- Figure 27. Others Cross Roller Guides Production Value (US$ Million) Growth Rate (2018-2029)
- Figure 28. Global Cross Roller Guides Consumption by Region: 2018 VS 2022 VS 2029 (K Units)
- Figure 29. Global Cross Roller Guides Consumption Market Share by Region: 2018 VS 2022 VS 2029
- Figure 30. North America Cross Roller Guides Consumption and Growth Rate (2018-2029) & (K Units)
- Figure 31. North America Cross Roller Guides Consumption Market Share by Country (2018-2029)
- Figure 32. U.S. Cross Roller Guides Consumption and Growth Rate (2018-2029) & (K Units)
- Figure 33. Canada Cross Roller Guides Consumption and Growth Rate (2018-2029) & (K Units)
- Figure 34. Europe Cross Roller Guides Consumption and Growth Rate (2018-2029) & (K Units)
- Figure 35. Europe Cross Roller Guides Consumption Market Share by Country (2018-2029)
- Figure 36. Germany Cross Roller Guides Consumption and Growth Rate (2018-2029) & (K Units)
- Figure 37. France Cross Roller Guides Consumption and Growth Rate (2018-2029) & (K Units)
- Figure 38. U.K. Cross Roller Guides Consumption and Growth Rate (2018-2029) & (K Units)
- Figure 39. Italy Cross Roller Guides Consumption and Growth Rate (2018-2029) & (K Units)
- Figure 40. Asia Pacific Cross Roller Guides Consumption and Growth Rate (2018-2029) & (K Units)
- Figure 41. Asia Pacific Cross Roller Guides Consumption Market Share by Region (2024-2029)
- Figure 42. China Cross Roller Guides Consumption and Growth Rate (2018-2029) & (K Units)
- Figure 43. Japan Cross Roller Guides Consumption and Growth Rate (2018-2029) & (K Units)
- Figure 44. South Korea Cross Roller Guides Consumption and Growth Rate (2018-2029) & (K Units)
- Figure 45. China Taiwan Cross Roller Guides Consumption and Growth Rate (2018-2029) & (K Units)
- Figure 46. Global Production Market Share of Cross Roller Guides by Type (2018-2029)
- Figure 47. Global Production Value Market Share of Cross Roller Guides by Type (2018-2029)
- Figure 48. Global Production Market Share of Cross Roller Guides by Application (2018-2029)
- Figure 49. Global Production Value Market Share of Cross Roller Guides by Application (2018-2029)
- Figure 50. Cross Roller Guides Value Chain
- Figure 51. Distributors Profiles
- Figure 52. Bottom-up and Top-down Approaches for This Report
- Figure 53. Data Triangulation
The Cross Roller Guide is a limited travel type linear guide with precision rollers arranged in an alternating orthogonal arrangement.
The global Cross Roller Guide market size was valued at US$ 930 million in 2022 and is forecast to a readjusted size of USD 1573 million by 2029 with a CAGR of 7.08% during review period.
China and China Taiwan Cross Roller Guide market size was US$ 204.8 million in 2022, while the US and Japan Cross Roller Guide were US$ 101 million and US$ 166 million, severally. The proportion of the US was 10.85% in 2022, while China and Japan are 11.64% and 17.9% respectively, and it is predicted that China proportion will reach 11.25% in 2029.
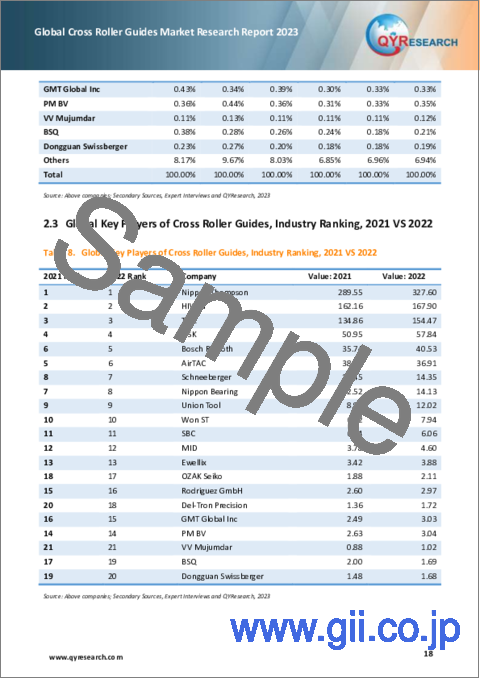
The global key manufacturers of Cross Roller Guide include: Nippon Thompson, HIWIN, THK, NSK, Bosch Rexroth, AirTAC, Schneeberger, Nippon Bearing, Union Tool, Won ST, etc. In 2022, the global top ten players hold a share approximately 89% in terms of revenue.
Globally, China is the country with the largest number of manufacturers of linear slide rails, but the production is not concentrated, the regional distribution is unreasonable, the total output and output value are not high, especially the production level of mid-to-high-end products is not high, and the information management lags behind, resulting in production costs. High and inconsistent quality. Most of the traditional slide rail manufacturers are still in the stage of competing for the incremental market. They are more inclined to produce large-scale and general-purpose products, and they are far behind international famous brands in personalized services. To stand out from the inherent competition, only high-quality, cost-effective guide rail products, high-standard services, and more stable technical support can win market recognition.
Report Scope
This report aims to provide a comprehensive presentation of the global market for Cross Roller Guides, with both quantitative and qualitative analysis, to help readers develop business/growth strategies, assess the market competitive situation, analyze their position in the current marketplace, and make informed business decisions regarding Cross Roller Guides.
The Cross Roller Guides market size, estimations, and forecasts are provided in terms of output/shipments (K Units) and revenue ($ millions), considering 2022 as the base year, with history and forecast data for the period from 2018 to 2029. This report segments the global Cross Roller Guides market comprehensively. Regional market sizes, concerning products by Type, by Application, and by players, are also provided.
For a more in-depth understanding of the market, the report provides profiles of the competitive landscape, key competitors, and their respective market ranks. The report also discusses technological trends and new product developments.
The report will help the Cross Roller Guides manufacturers, new entrants, and industry chain related companies in this market with information on the revenues, production, and average price for the overall market and the sub-segments across the different segments, by company, by Type, by Application, and by regions.
By Company
- Nippon Thompson
- HIWIN
- THK
- NSK
- Bosch Rexroth
- AirTAC
- Schneeberger
- Nippon Bearing
- Union Tool
- Won ST
- SBC
- MID
- Ewellix
- OZAK Seiko
- Rodriguez GmbH
- Del-Tron Precision
- GMT Global Inc
- PM BV
- VV Mujumdar
- BSQ
- Dongguan Swissberger
by Type
- Standard Type Guides
- Wide Type Guides
by Application
- Machine Tool
- Optical Equipment
- Medical Equipment
- Semiconductor Equipment
- Measurement/Inspection Equipment
- Others
Production by Region
- China
- Japan
- South Korea
- Others (US and Europe)
Consumption by Region
- North America
- U.S.
- Canada
- Asia-Pacific
- China
- Japan
- South Korea
- China Taiwan
- Southeast Asia
- Europe
- Germany
- France
- U.K.
- Italy
- Rest of Europe
Core Chapters
- Chapter 1: Introduces the report scope of the report, executive summary of different market segments (by region, by Type, by Application, etc), including the market size of each market segment, future development potential, and so on. It offers a high-level view of the current state of the market and its likely evolution in the short to mid-term, and long term.
- Chapter 2: Detailed analysis of Cross Roller Guides manufacturers competitive landscape, price, production and value market share, latest development plan, merger, and acquisition information, etc.
- Chapter 3: Production/output, value of Cross Roller Guides by region/country. It provides a quantitative analysis of the market size and development potential of each region in the next six years.
- Chapter 4: Consumption of Cross Roller Guides in regional level and country level. It provides a quantitative analysis of the market size and development potential of each region and its main countries and introduces the market development, future development prospects, market space, and production of each country in the world.
- Chapter 5: Provides the analysis of various market segments by Type, covering the market size and development potential of each market segment, to help readers find the blue ocean market in different market segments.
- Chapter 6: Provides the analysis of various market segments by Application, covering the market size and development potential of each market segment, to help readers find the blue ocean market in different downstream markets.
- Chapter 7: Provides profiles of key players, introducing the basic situation of the main companies in the market in detail, including product production/output, value, price, gross margin, product introduction, recent development, etc.
- Chapter 8: Analysis of industrial chain, including the upstream and downstream of the industry.
- Chapter 9: Introduces the market dynamics, latest developments of the market, the driving factors and restrictive factors of the market, the challenges and risks faced by manufacturers in the industry, and the analysis of relevant policies in the industry.
- Chapter 10: The main points and conclusions of the report.
Table of Contents
1 Cross Roller Guides Market Overview
- 1.1 Product Definition
- 1.2 Cross Roller Guides by Type
- 1.2.1 Global Cross Roller Guides Market Value Growth Rate Analysis by Type: 2022 VS 2029
- 1.3 Cross Roller Guides by Application
- 1.3.1 Global Cross Roller Guides Market Value Growth Rate Analysis by Application: 2022 VS 2029
- 1.3.2 Machine Tool
- 1.3.3 Optical Equipment
- 1.3.4 Medical Equipment
- 1.3.5 Semiconductor Equipment
- 1.3.6 Measurement/Inspection Equipment
- 1.3.7 Others
- 1.4 Global Market Growth Prospects
- 1.4.1 Global Cross Roller Guides Production Value Estimates and Forecasts (2018-2029)
- 1.4.2 Global Cross Roller Guides Production Estimates and Forecasts (2018-2029)
- 1.4.3 Global Cross Roller Guides Market Average Price Estimates and Forecasts (2018-2029)
- 1.5 Assumptions and Limitations
2 Market Competition by Manufacturers
- 2.1 Global Cross Roller Guides Production Market Share by Manufacturers (2018-2023)
- 2.2 Global Cross Roller Guides Production Value Market Share by Manufacturers (2018-2023)
- 2.3 Global Key Players of Cross Roller Guides, Industry Ranking, 2021 VS 2022
- 2.4 Global Cross Roller Guides Market Share by Company Type (Tier 1, Tier 2, and Tier 3)
- 2.5 Global Cross Roller Guides Average Price by Manufacturers (2018-2023)
- 2.6 Global Key Manufacturers of Cross Roller Guides, Manufacturing Sites & Headquarters
- 2.7 Global Cross Roller Guides Market Competitive Situation and Trends
- 2.7.1 Global Cross Roller Guides Market Concentration Rate
- 2.7.2 Global 5 and 10 Largest Cross Roller Guides Players Market Share by Revenue
3 Cross Roller Guides Production by Region
- 3.1 Global Cross Roller Guides Production Value Estimates and Forecasts by Region: 2018 VS 2022 VS 2029
- 3.2 Global Cross Roller Guides Production Value by Region (2018-2029)
- 3.2.1 Global Cross Roller Guides Production Value Market Share by Region (2018-2023)
- 3.2.2 Global Forecasted Production Value of Cross Roller Guides by Region (2024-2029)
- 3.3 Global Cross Roller Guides Production Estimates and Forecasts by Region: 2018 VS 2022 VS 2029
- 3.4 Global Cross Roller Guides Production by Region (2018-2029)
- 3.4.1 Global Cross Roller Guides Production Market Share by Region (2018-2023)
- 3.4.2 Global Forecasted Production of Cross Roller Guides by Region (2024-2029)
- 3.5 Global Cross Roller Guides Market Price Analysis by Region (2018-2023)
- 3.6 Global Cross Roller Guides Production and Value, Year-over-Year Growth
- 3.6.1 China Cross Roller Guides Production Value Estimates and Forecasts (2018-2029)
- 3.6.2 Japan Cross Roller Guides Production Value Estimates and Forecasts (2018-2029)
- 3.6.3 South Korea Cross Roller Guides Production Value Estimates and Forecasts (2018-2029)
- 3.6.4 Others Cross Roller Guides Production Value Estimates and Forecasts (2018-2029)
4 Cross Roller Guides Consumption by Region
- 4.1 Global Cross Roller Guides Consumption Estimates and Forecasts by Region: 2018 VS 2022 VS 2029
- 4.2 Global Cross Roller Guides Consumption by Region (2018-2029)
- 4.2.1 Global Cross Roller Guides Consumption by Region (2018-2029)
- 4.2.2 Global Cross Roller Guides Forecasted Consumption by Region (2024-2029)
- 4.3 North America
- 4.3.1 North America Cross Roller Guides Consumption Growth Rate by Country: 2018 VS 2022 VS 2029
- 4.3.2 North America Cross Roller Guides Consumption by Country (2018-2029)
- 4.3.3 U.S.
- 4.3.4 Canada
- 4.4 Europe
- 4.4.1 Europe Cross Roller Guides Consumption Growth Rate by Country: 2018 VS 2022 VS 2029
- 4.4.2 Europe Cross Roller Guides Consumption by Country (2018-2029)
- 4.4.3 Germany
- 4.4.4 France
- 4.4.5 U.K.
- 4.4.6 Italy
- 4.5 Asia Pacific
- 4.5.1 Europe Cross Roller Guides Consumption Growth Rate by Country: 2018 VS 2022 VS 2029
- 4.5.2 Asia Pacific Cross Roller Guides Consumption by Region (2018-2029)
- 4.5.3 China
- 4.5.4 Japan
- 4.5.5 South Korea
- 4.5.6 China Taiwan
5 Segment by Type
- 5.1 Global Cross Roller Guides Production by Type (2018-2029)
- 5.1.1 Global Cross Roller Guides Production by Type (2018-2023)
- 5.1.2 Global Cross Roller Guides Production by Type (2024-2029)
- 5.1.3 Global Cross Roller Guides Production Market Share by Type (2018-2029)
- 5.2 Global Cross Roller Guides Production Value by Type (2018-2029)
- 5.2.1 Global Cross Roller Guides Production Value by Type (2018-2023)
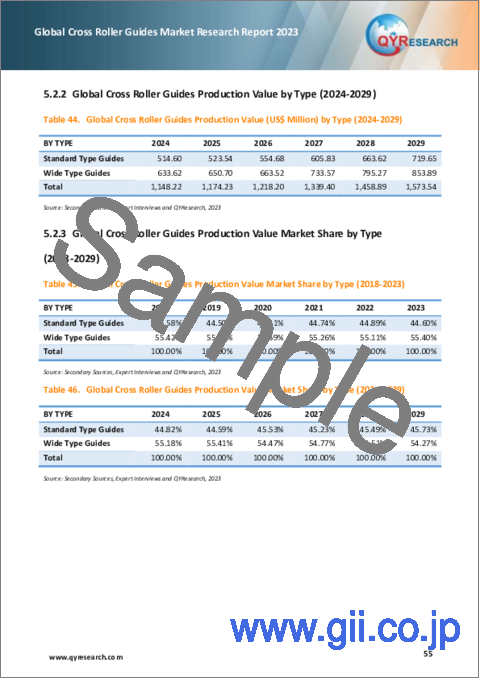
- 5.2.2 Global Cross Roller Guides Production Value by Type (2024-2029)
- 5.2.3 Global Cross Roller Guides Production Value Market Share by Type (2018-2029)
- 5.3 Global Cross Roller Guides Price by Type (2018-2029)
6 Segment by Application
- 6.1 Global Cross Roller Guides Production by Application (2018-2029)
- 6.1.1 Global Cross Roller Guides Production by Application (2018-2023)
- 6.1.2 Global Cross Roller Guides Production by Application (2024-2029)
- 6.1.3 Global Cross Roller Guides Production Market Share by Application (2018-2029)
- 6.2 Global Cross Roller Guides Production Value by Application (2018-2029)
- 6.2.1 Global Cross Roller Guides Production Value by Application (2018-2023)
- 6.2.2 Global Cross Roller Guides Production Value by Application (2024-2029)
- 6.2.3 Global Cross Roller Guides Production Value Market Share by Application (2018-2029)
- 6.3 Global Cross Roller Guides Price by Application (2018-2029)
7 Key Companies Profiled
- 7.1 Nippon Thompson
- 7.1.1 Nippon Thompson Cross Roller Guides Company Information
- 7.1.2 Nippon Thompson Cross Roller Guides Product Portfolio
- 7.1.3 Nippon Thompson Cross Roller Guides Production, Value, Price and Gross Margin (2018-2023)
- 7.1.4 Nippon Thompson Main Business and Markets Served
- 7.2 HIWIN
- 7.2.1 HIWIN Cross Roller Guides Company Information
- 7.2.2 HIWIN Cross Roller Guides Product Portfolio
- 7.2.3 HIWIN Cross Roller Guides Production, Value, Price and Gross Margin (2018-2023)
- 7.2.4 HIWIN Main Business and Markets Served
- 7.3 THK
- 7.3.1 THK Cross Roller Guides Company Information
- 7.3.2 THK Cross Roller Guides Product Portfolio
- 7.3.3 THK Cross Roller Guides Production, Value, Price and Gross Margin (2018-2023)
- 7.3.4 THK Main Business and Markets Served
- 7.3.5 THK Recent Developments/Updates
- 7.4 NSK
- 7.4.1 NSK Cross Roller Guides Company Information
- 7.4.2 NSK Cross Roller Guides Product Portfolio
- 7.4.3 NSK Cross Roller Guides Production, Value, Price and Gross Margin (2018-2023)
- 7.4.4 NSK Main Business and Markets Served
- 7.4.5 NSK Recent Developments/Updates
- 7.5 Bosch Rexroth
- 7.5.1 Bosch Rexroth Cross Roller Guides Company Information
- 7.5.2 Bosch Rexroth Cross Roller Guides Product Portfolio
- 7.5.3 Bosch Rexroth Cross Roller Guides Production, Value, Price and Gross Margin (2018-2023)
- 7.5.4 Bosch Rexroth Main Business and Markets Served
- 7.5.5 Bosch Rexroth Recent Developments/Updates
- 7.6 AirTAC
- 7.6.1 AirTAC Cross Roller Guides Company Information
- 7.6.2 AirTAC Cross Roller Guides Product Portfolio
- 7.6.3 AirTAC Cross Roller Guides Production, Value, Price and Gross Margin (2019-2023)
- 7.6.4 AirTAC Main Business and Markets Served
- 7.7 Schneeberger
- 7.7.1 Schneeberger Cross Roller Guides Company Information
- 7.7.2 Schneeberger Cross Roller Guides Product Portfolio
- 7.7.3 Schneeberger Cross Roller Guides Production, Value, Price and Gross Margin (2018-2023)
- 7.7.4 Schneeberger Main Business and Markets Served
- 7.7.5 Schneeberger Recent Developments/Updates
- 7.8 Nippon Bearing
- 7.8.1 Nippon Bearing Cross Roller Guides Company Information
- 7.8.2 Nippon Bearing Cross Roller Guides Product Portfolio
- 7.8.3 Nippon Bearing Cross Roller Guides Production, Value, Price and Gross Margin (2018-2023)
- 7.8.4 Nippon Bearing Main Business and Markets Served
- 7.9 Union Tool
- 7.9.1 Union Tool Cross Roller Guides Company Information
- 7.9.2 Union Tool Cross Roller Guides Product Portfolio
- 7.9.3 Union Tool Cross Roller Guides Production, Value, Price and Gross Margin (2018-2023)
- 7.9.4 Union Tool Main Business and Markets Served
- 7.10 Won ST
- 7.10.1 Won ST Cross Roller Guides Company Information
- 7.10.2 Won ST Cross Roller Guides Product Portfolio
- 7.10.3 Won ST Cross Roller Guides Production, Value, Price and Gross Margin (2018-2023)
- 7.10.4 Won ST Main Business and Markets Served
- 7.11 SBC
- 7.11.1 SBC Cross Roller Guides Company Information
- 7.11.2 SBC Cross Roller Guides Product Portfolio
- 7.11.3 SBC Cross Roller Guides Production, Value, Price and Gross Margin (2018-2023)
- 7.11.4 SBC Main Business and Markets Served
- 7.12 MID
- 7.12.1 MID Cross Roller Guides Company Information
- 7.12.2 MID Cross Roller Guides Product Portfolio
- 7.12.3 MID Cross Roller Guides Production, Value, Price and Gross Margin (2018-2023)
- 7.12.4 MID Main Business and Markets Served
- 7.13 Ewellix
- 7.13.1 Ewellix Cross Roller Guides Company Information
- 7.13.2 Ewellix Cross Roller Guides Product Portfolio
- 7.13.3 Ewellix Cross Roller Guides Production, Value, Price and Gross Margin (2018-2023)
- 7.13.4 Ewellix Main Business and Markets Served
- 7.14 OZAK Seiko
- 7.14.1 OZAK Seiko Cross Roller Guides Company Information
- 7.14.2 OZAK Seiko Cross Roller Guides Product Portfolio
- 7.14.3 OZAK Seiko Cross Roller Guides Production, Value, Price and Gross Margin (2018-2023)
- 7.14.4 OZAK Seiko Main Business and Markets Served
- 7.15 Rodriguez GmbH
- 7.15.1 Rodriguez GmbH Cross Roller Guides Company Information
- 7.15.2 Rodriguez GmbH Cross Roller Guides Product Portfolio
- 7.15.3 Rodriguez GmbH Cross Roller Guides Production, Value, Price and Gross Margin (2018-2023)
- 7.15.4 Rodriguez GmbH Main Business and Markets Served
- 7.16 Del-Tron Precision
- 7.16.1 Del-Tron Precision Cross Roller Guides Company Information
- 7.16.2 Del-Tron Precision Cross Roller Guides Product Portfolio
- 7.16.3 Del-Tron Precision Cross Roller Guides Production, Value, Price and Gross Margin (2018-2023)
- 7.16.4 Del-Tron Precision Main Business and Markets Served
- 7.17 GMT Global Inc
- 7.17.1 GMT Global Inc Cross Roller Guides Company Information
- 7.17.2 GMT Global Inc Cross Roller Guides Product Portfolio
- 7.17.3 GMT Global Inc Cross Roller Guides Production, Value, Price and Gross Margin (2018-2023)
- 7.17.4 GMT Global Inc Main Business and Markets Served
- 7.18 PM BV
- 7.18.1 PM BV Cross Roller Guides Company Information
- 7.18.2 PM BV Cross Roller Guides Product Portfolio
- 7.18.3 PM BV Cross Roller Guides Production, Value, Price and Gross Margin (2018-2023)
- 7.18.4 PM BV Main Business and Markets Served
- 7.18.5 PM BV Recent Developments/Updates
- 7.19 VV Mujumdar
- 7.19.1 VV Mujumdar Cross Roller Guides Company Information
- 7.19.2 VV Mujumdar Cross Roller Guides Production, Value, Price and Gross Margin (2018-2023)
- 7.19.3 VV Mujumdar Main Business and Markets Served
- 7.20 BSQ
- 7.20.1 BSQ Cross Roller Guides Company Information
- 7.20.2 BSQ Cross Roller Guides Product Portfolio
- 7.20.3 BSQ Cross Roller Guides Production, Value, Price and Gross Margin (2018-2023)
- 7.20.4 BSQ Main Business and Markets Served
- 7.21 Dongguan Swissberger
- 7.21.1 Dongguan Swissberger Cross Roller Guides Company Information
- 7.21.2 Dongguan Swissberger Cross Roller Guides Product Portfolio
- 7.21.3 Dongguan Swissberger Cross Roller Guides Production, Value, Price and Gross Margin (2018-2023)
- 7.21.4 Dongguan Swissberger Main Business and Markets Served
8 Industry Chain and Sales Channels Analysis
- 8.1 Cross Roller Guides Industry Chain Analysis
- 8.2 Cross Roller Guides Key Raw Materials
- 8.2.1 Key Raw Materials
- 8.2.2 Raw Materials Key Suppliers
- 8.3 Cross Roller Guides Sales and Marketing
- 8.3.1 Cross Roller Guides Distributors
- 8.4 Cross Roller Guides Customers
9 Cross Roller Guides Market Dynamics
- 9.1 Cross Roller Guides Industry Trends
- 9.2 Cross Roller Guides Market Drivers
- 9.3 Cross Roller Guides Market Restraints and Challenges
10 Research Findings and Conclusion
11 Methodology and Data Source
- 11.1 Methodology/Research Approach
- 11.1.1 Research Programs/Design
- 11.1.2 Market Size Estimation
- 11.1.3 Market Breakdown and Data Triangulation
- 11.2 Data Source
- 11.2.1 Secondary Sources
- 11.2.2 Primary Sources
- 11.3 Author List
- 11.4 Disclaimer