|
|
市場調査レポート
商品コード
1286627
活性炭の世界市場、実績と予測(2018年~2029年)Global Activated Carbon Market Report, History and Forecast 2018-2029 |
||||||
|
|
|||||||
|
● お客様のご希望に応じて、既存データの加工や未掲載情報(例:国別セグメント)の追加などの対応が可能です。 詳細はお問い合わせください。 |
|||||||


| 活性炭の世界市場、実績と予測(2018年~2029年) |
|
出版日: 2023年06月05日
発行: QYResearch
ページ情報: 英文 180 Pages
納期: 2~3営業日
|
- 全表示
- 概要
- 図表
- 目次
世界の活性炭の市場規模は、2022年の48億2,736万米ドルから2029年までに50億5,850万米ドルに達し、2023年~2029年の予測期間中にCAGRで2.04%の成長が予測されています。
活性炭の北米市場は、2022年に10億5,486万米ドルと評価され、2023年から2029年の予測期間中に1.80%のCAGRで、2029年までに10億8,745万米ドルに達すると予測されます。
活性炭のアジア太平洋市場は、2022年に22億9,740万米ドルと評価され、2023年から2029年の予測期間中に2.95%のCAGRで、2029年までに26億852万米ドルに達すると予測されます。
活性炭のヨーロッパ市場は、2022年に11億1,428万米ドルと評価され、2023年から2029年の予測期間中に-0.11%のCAGRで、2029年までに9億7,440万米ドルまで減少すると予想されます。
当レポートでは、世界の活性炭市場について調査分析し、市場規模と予測、地域とセグメントの分析、企業プロファイルなどを提供しています。
目次
第1章 活性炭市場の概要
- 活性炭製品の概要
- 活性炭市場:タイプ別
- 石炭系活性炭
- 木質系活性炭
- ヤシ系活性炭
- 世界の活性炭の市場規模:タイプ別
- 主要地域の市場規模:タイプ別
第2章 活性炭市場競合:企業別
- 世界の主要企業:活性炭の売上別(2018年~2023年)
- 世界の主要企業:活性炭の収益別(2018年~2023年)
- 世界の主要企業:活性炭の価格別(2018年~2023年)
- 世界の主要メーカーの活性炭の製造拠点の分布、製品タイプ
- 活性炭市場の競合状況と動向
- 活性炭市場集中率(2018年~2023年)
- 活性炭の売上と収益における世界最大のメーカー5社(2022年)
- 世界の主なメーカー:企業タイプ別(Tier 1、Tier 2、Tier 3)(2022年の活性炭の収益に基づく)
- 主要メーカーが提供する活性炭製品
- 合併と買収、拡大
第3章 活性炭の現状と見通し:地域別
- 世界の活性炭の市場規模とCAGR:地域別(2018年・2023年・2029年)
- 世界の活性炭の市場規模の実績:地域別
- 世界の活性炭の市場規模の予測:地域別
第4章 活性炭:用途別
- 活性炭市場:用途別
- 水処理
- 空気清浄
- 水銀管理
- 食品・飲料
- 工業処理
- 医薬品
- 世界の活性炭の市場規模:用途別
- 主要地域の市場規模:用途別
第5章 北米の活性炭:国別
- 北米の活性炭の市場規模の実績:国別
- 北米の活性炭の市場規模の予測:国別
第6章 欧州の活性炭:国別
- 欧州の活性炭の市場規模の実績:国別
- 欧州の活性炭の市場規模の予測:国別
第7章 アジア太平洋の活性炭:地域別
- アジア太平洋の活性炭の市場規模の実績:地域別
- アジア太平洋の活性炭の市場規模の予測:地域別
第8章 南米の活性炭:国別
- 南米の活性炭の市場規模の実績:国別
- 南米の活性炭の市場規模の予測:国別
第9章 中東・アフリカの活性炭:国別
- 中東・アフリカの活性炭の市場規模の実績:国別
- 中東・アフリカの活性炭の市場規模の予測:国別
第10章 企業プロファイル
- Ingevity Corporation
- Kuraray
- Osaka Gas Chemicals
- Haycarb
- Norit
- Fujian Yuanli Active Carbon
- MuLinSen Activated Carbon
- Boyce Carbon
- Futamura Chemical
- Core Carbons
- Philippine-Japan Active Carbon Corp
- DESOTEC Activated Carbon
- Fujian Xinsen Carbon
- Ningxia Huahui Activated Carbon
- Shanxi Xinhua Chemical
- China Energy Investment Corporation
- Silcarbon Aktivkohle GmbH
- CarboTech AC GmbH
- Donau Carbon
- Active Char Products
- Datong Coal Jinding Activated Carbon
- Fujian Zhixing
第11章 上流、機会、課題、リスク、影響要因の分析
- 活性炭の主な原材料
- 主な原材料
- 主な原材料の価格
- 原材料の主要サプライヤー
- 製造コスト構造
- 原材料
- 人件費
- 製造費
- 活性炭の産業チェーン分析
- 活性炭の市場力学の動向
- 活性炭産業の動向
- 活性炭市場の促進要因
- 活性炭市場の課題
- 活性炭市場の抑制要因
第12章 マーケティング戦略の分析、販売業者
- 販売チャネル
- 活性炭の販売業者
- 活性炭の下流顧客
第13章 調査結果と結論
第14章 付録
List of Tables
- Table 1. Global Activated Carbon Sales by Type: 2018 VS 2023 VS 2029 (US$ Million)
- Table 2. Global Activated Carbon Sales by Type (2018-2023) & (K MT)
- Table 3. Global Activated Carbon Sales Market Share in Volume by Type (2018-2023)
- Table 4. Global Activated Carbon Sales by Type (2018-2023) & (US$ Million)
- Table 5. Global Activated Carbon Sales Market Share in Value by Type (2018-2023)
- Table 6. Global Activated Carbon Price by Type (2018-2023) & (USD/MT)
- Table 7. Global Activated Carbon Sales by Type (2024-2029) & (K MT)
- Table 8. Global Activated Carbon Sales Market Share in Volume by Type (2024-2029)
- Table 9. Global Activated Carbon Sales by Type (2024-2029) & (US$ Million)
- Table 10. Global Activated Carbon Sales Market Share in Value by Type (2024-2029)
- Table 11. Global Activated Carbon Price by Type (2024-2029) & (USD/MT)
- Table 12. North America Activated Carbon Sales by Type (2018-2023) & (K MT)
- Table 13. North America Activated Carbon Sales by Type (2018-2023) & (US$ Million)
- Table 14. Europe Activated Carbon Sales (K MT) by Type (2018-2023)
- Table 15. Europe Activated Carbon Sales by Type (2018-2023) & (US$ Million)
- Table 16. Asia-Pacific Activated Carbon Sales (K MT) by Type (2018-2023)
- Table 17. Asia-Pacific Activated Carbon Sales by Type (2018-2023) & (US$ Million)
- Table 18. South America Activated Carbon Sales (K MT) by Type (2018-2023)
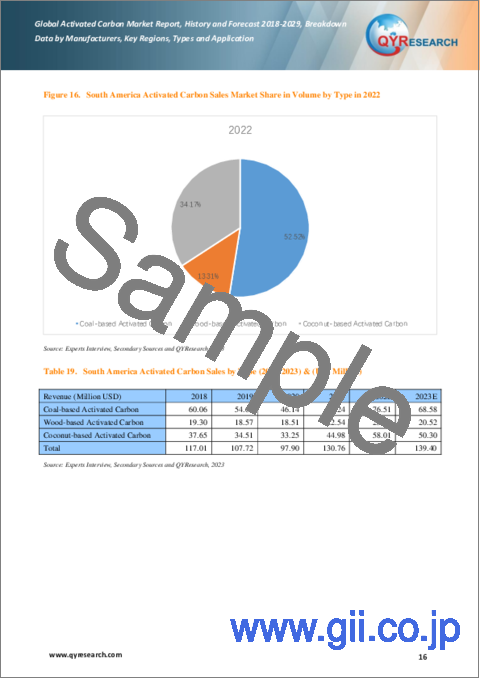
- Table 19. South America Activated Carbon Sales by Type (2018-2023) & (US$ Million)
- Table 20. Middle East and Africa Activated Carbon Sales (K MT) by Type (2018-2023)
- Table 21. Middle East and Africa Activated Carbon Sales by Type (2018-2023) & (US$ Million)
- Table 22. Global Activated Carbon Sales by Company (2018-2023) & (K MT)
- Table 23. Global Activated Carbon Sales Share by Company (2018-2023)
- Table 24. Global Activated Carbon Revenue by Company (2018-2023) & (US$ Million)
- Table 25. Global Activated Carbon Revenue Share by Company (2018-2023)
- Table 26. Global Market Activated Carbon Price by Company (2018-2023) & (USD/MT)
- Table 27. Global Activated Carbon Top Manufacturers Manufacturing Base Distribution and Sales Area
- Table 28. Global Top Manufacturers Market Share by Company Type (Tier 1, Tier 2, and Tier 3) & (based on the Revenue in Activated Carbon as of 2022)
- Table 29. Key Manufacturers Activated Carbon Product Type
- Table 30. Mergers & Acquisitions, Expansion Plans
- Table 31. Global Activated Carbon Market Size Comparison by Region (US$ Million): 2018 VS 2023 VS 2029
- Table 32. Global Activated Carbon Sales by Region (2018-2023) & (K MT)
- Table 33. Global Activated Carbon Sales Market Share in Volume by Region (2018-2023)
- Table 34. Global Activated Carbon Sales by Region (2018-2023) & (US$ Million)
- Table 35. Global Activated Carbon Sales Market Share in Value by Region (2018-2023)
- Table 36. Global Activated Carbon Sales (K MT), Value (US$ Million), Price (USD/MT) and Gross Margin (2018-2023)
- Table 37. Global Activated Carbon Sales by Region (2024-2029) & (K MT)
- Table 38. Global Activated Carbon Sales Market Share in Volume by Region (2024-2029)
- Table 39. Global Activated Carbon Sales by Region (2024-2029) & (US$ Million)
- Table 40. Global Activated Carbon Sales Market Share in Value by Region (2024-2029)
- Table 41. Global Activated Carbon Sales (K MT), Value (US$ Million), Price (USD/MT) and Gross Margin (2024-2029)
- Table 42. Global Activated Carbon Sales by Application: 2018 VS 2023 VS 2029 (US$ Million)
- Table 43. Global Activated Carbon Sales by Application (2018-2023) & (K MT)
- Table 44. Global Activated Carbon Sales Market Share in Volume by Application (2018-2023)
- Table 45. Global Activated Carbon Sales by Application (2018-2023) & (US$ Million)
- Table 46. Global Activated Carbon Sales Market Share in Value by Application (2018-2023)
- Table 47. Global Activated Carbon Price by Application (2018-2023) & (USD/MT)
- Table 48. Global Activated Carbon Sales by Application (2024-2029) & (K MT)
- Table 49. Global Activated Carbon Sales Market Share in Volume by Application (2024-2029)
- Table 50. Global Activated Carbon Sales by Application (2024-2029) & (US$ Million)
- Table 51. Global Activated Carbon Sales Market Share in Value by Application (2024-2029)
- Table 52. Global Activated Carbon Price by Application (2024-2029) & (USD/MT)
- Table 53. North America Activated Carbon Sales by Application (2018-2023) & (K MT)
- Table 54. North America Activated Carbon Sales by Application (2018-2023) & (US$ Million)
- Table 55. Europe Activated Carbon Sales (K MT) by Application (2018-2023)
- Table 56. Europe Activated Carbon Sales by Application (2018-2023) & (US$ Million)
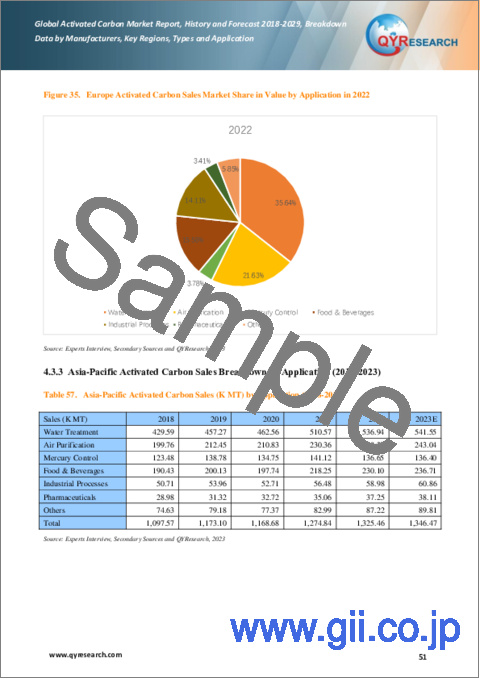
- Table 57. Asia-Pacific Activated Carbon Sales (K MT) by Application (2018-2023)
- Table 58. Asia-Pacific Activated Carbon Sales by Application (2018-2023) & (US$ Million)
- Table 59. South America Activated Carbon Sales (K MT) by Application (2018-2023)
- Table 60. South America Activated Carbon Sales by Application (2018-2023) & (US$ Million)
- Table 61. Middle East and Africa Activated Carbon Sales (K MT) by Application (2018-2023)
- Table 62. Middle East and Africa Activated Carbon Sales by Application (2018-2023) & (US$ Million)
- Table 63. North America Activated Carbon Market Size Growth Rate (CAGR) by Country (US$ Million): 2018 VS 2023 VS 2029
- Table 64. North America Activated Carbon Sales by Country (2018-2023) & (K MT)
- Table 65. North America Activated Carbon Sales Market Share in Volume by Country (2018-2023)
- Table 66. North America Activated Carbon Sales by Country (2018-2023) & (US$ Million)
- Table 67. North America Activated Carbon Sales Market Share in Value by Country (2018-2023)
- Table 68. North America Activated Carbon Sales by Country (2024-2029) & (K MT)
- Table 69. North America Activated Carbon Sales Market Share in Volume by Country (2024-2029)
- Table 70. North America Activated Carbon Sales by Country (2024-2029) & (US$ Million)
- Table 71. North America Activated Carbon Sales Market Share in Value by Country (2024-2029)
- Table 72. Europe Activated Carbon Market Size Growth Rate (CAGR) by Country (US$ Million): 2018 VS 2023 VS 2029
- Table 73. Europe Activated Carbon Sales by Country (2018-2023) & (K MT)
- Table 74. Europe Activated Carbon Sales Market Share in Volume by Country (2018-2023)
- Table 75. Europe Activated Carbon Sales by Country (2018-2023) & (US$ Million)
- Table 76. Europe Activated Carbon Sales Market Share in Value by Country (2018-2023)
- Table 77. Europe Activated Carbon Sales by Country (2024-2029) & (K MT)
- Table 78. Europe Activated Carbon Sales Market Share in Volume by Country (2024-2029)
- Table 79. Europe Activated Carbon Sales by Country (2024-2029) & (US$ Million)
- Table 80. Europe Activated Carbon Sales Market Share in Value by Country (2024-2029)
- Table 81. Asia-Pacific Activated Carbon Market Size Growth Rate (CAGR) by Region (US$ Million): 2018 VS 2023 VS 2029
- Table 82. Asia-Pacific Activated Carbon Sales by Region (2018-2023) & (K MT)
- Table 83. Asia-Pacific Activated Carbon Sales Market Share in Volume by Region (2018-2023)
- Table 84. Asia-Pacific Activated Carbon Sales by Region (2018-2023) & (US$ Million)
- Table 85. Asia-Pacific Activated Carbon Sales Market Share in Value by Region (2018-2023)
- Table 86. Asia-Pacific Activated Carbon Sales by Region (2024-2029) & (K MT)
- Table 87. Asia-Pacific Activated Carbon Sales Market Share in Volume by Region (2024-2029)
- Table 88. Asia-Pacific Activated Carbon Sales by Region (2024-2029) & (US$ Million)
- Table 89. Asia-Pacific Activated Carbon Sales Market Share in Value by Region (2024-2029)
- Table 90. South America Activated Carbon Market Size Growth Rate (CAGR) by Country (US$ Million): 2018 VS 2023 VS 2029
- Table 91. South America Activated Carbon Sales by Country (2018-2023) & (K MT)
- Table 92. South America Activated Carbon Sales Market Share in Volume by Country (2018-2023)
- Table 93. South America Activated Carbon Sales by Country (2018-2023) & (US$ Million)
- Table 94. South America Activated Carbon Sales Market Share in Value by Country (2018-2023)
- Table 95. South America Activated Carbon Sales by Country (2024-2029) & (K MT)
- Table 96. South America Activated Carbon Sales Market Share in Volume by Country (2024-2029)
- Table 97. South America Activated Carbon Sales by Country (2024-2029) & (US$ Million)
- Table 98. South America Activated Carbon Sales Market Share in Value by Country (2024-2029)
- Table 99. Middle East and Africa Activated Carbon Market Size Growth Rate (CAGR) by Country (US$ Million): 2018 VS 2023 VS 2029
- Table 100. Middle East and Africa Activated Carbon Sales by Country (2018-2023) & (K MT)
- Table 101. Middle East and Africa Activated Carbon Sales Market Share in Volume by Country (2018-2023)
- Table 102. Middle East and Africa Activated Carbon Sales by Country (2018-2023) & (US$ Million)
- Table 103. Middle East and Africa Activated Carbon Sales Market Share in Value by Country (2018-2023)
- Table 104. Middle East and Africa Activated Carbon Sales by Country (2024-2029) & (K MT)
- Table 105. Middle East and Africa Activated Carbon Sales Market Share by Country (2024-2029)
- Table 106. Middle East and Africa Activated Carbon Sales by Country (2024-2029) & (US$ Million)
- Table 107. Middle East and Africa Activated Carbon Sales Market Share in Value by Country (2024-2029)
- Table 108. Ingevity Corporation Company Information
- Table 109. Ingevity Corporation Introduction and Business Overview
- Table 110. Ingevity Corporation Activated Carbon Sales (K MT), Revenue (US$ Million), Price (USD/MT) and Gross Margin (2018-2023)
- Table 111. Ingevity Corporation Activated Carbon Product
- Table 112. Kuraray Company Information
- Table 113. Kuraray Introduction and Business Overview
- Table 114. Kuraray Activated Carbon Sales (K MT), Revenue (US$ Million), Price (USD/MT) and Gross Margin (2018-2023)
- Table 115. Kuraray Activated Carbon Product
- Table 116. Osaka Gas Chemicals Company Information
- Table 117. Osaka Gas Chemicals Introduction and Business Overview
- Table 118. Osaka Gas Chemicals Activated Carbon Sales (K MT), Revenue (US$ Million), Price (USD/MT) and Gross Margin (2018-2023)
- Table 119. Osaka Gas Chemicals Activated Carbon Product
- Table 120. Haycarb Company Information
- Table 121. Haycarb Introduction and Business Overview
- Table 122. Haycarb Activated Carbon Sales (K MT), Revenue (US$ Million), Price (USD/MT) and Gross Margin (2018-2023)
- Table 123. Haycarb Activated Carbon Product
- Table 124. Norit Company Information
- Table 125. Norit Introduction and Business Overview
- Table 126. Norit Activated Carbon Sales (K MT), Revenue (US$ Million), Price (USD/MT) and Gross Margin (2018-2023)
- Table 127. Norit Activated Carbon Product
- Table 128. Fujian Yuanli Active Carbon Company Information
- Table 129. Fujian Yuanli Active Carbon Introduction and Business Overview
- Table 130. Fujian Yuanli Active Carbon Activated Carbon Sales (K MT), Revenue (US$ Million), Price (USD/MT) and Gross Margin (2018-2023)
- Table 131. Fujian Yuanli Active Carbon Activated Carbon Product
- Table 132. MuLinSen Activated Carbon Company Information
- Table 133. MuLinSen Activated Carbon Introduction and Business Overview
- Table 134. MuLinSen Activated Carbon Activated Carbon Sales (K MT), Revenue (US$ Million), Price (USD/MT) and Gross Margin (2018-2023)
- Table 135. MuLinSen Activated Carbon Activated Carbon Product
- Table 136. Boyce Carbon Company Information
- Table 137. Boyce Carbon Introduction and Business Overview
- Table 138. Boyce Carbon Activated Carbon Sales (K MT), Revenue (US$ Million), Price (USD/MT) and Gross Margin (2018-2023)
- Table 139. Boyce Carbon Activated Carbon Product
- Table 140. Futamura Chemical Company Information
- Table 141. Futamura Chemical Introduction and Business Overview
- Table 142. Futamura Chemical Activated Carbon Sales (K MT), Revenue (US$ Million), Price (USD/MT) and Gross Margin (2018-2023)
- Table 143. Futamura Chemical Activated Carbon Product
- Table 144. Core Carbons Company Information
- Table 145. Core Carbons Introduction and Business Overview
- Table 146. Core Carbons Activated Carbon Sales (K MT), Revenue (US$ Million), Price (USD/MT) and Gross Margin (2018-2023)
- Table 147. Core Carbons Activated Carbon Product
- Table 148. Philippine-Japan Active Carbon Corp Company Information
- Table 149. Philippine-Japan Active Carbon Corp Introduction and Business Overview
- Table 150. Philippine-Japan Active Carbon Corp Activated Carbon Sales (K MT), Revenue (US$ Million), Price (USD/MT) and Gross Margin (2018-2023)
- Table 151. Philippine-Japan Active Carbon Corp Activated Carbon Product
- Table 152. DESOTEC Activated Carbon Company Information
- Table 153. DESOTEC Activated Carbon Introduction and Business Overview
- Table 154. DESOTEC Activated Carbon Activated Carbon Sales (K MT), Revenue (US$ Million), Price (USD/MT) and Gross Margin (2018-2023)
- Table 155. DESOTEC Activated Carbon Activated Carbon Product
- Table 156. Fujian Xinsen Carbon Company Information
- Table 157. Fujian Xinsen Carbon Introduction and Business Overview
- Table 158. Fujian Xinsen Carbon Activated Carbon Sales (K MT), Revenue (US$ Million), Price (USD/MT) and Gross Margin (2018-2023)
- Table 159. Fujian Xinsen Carbon Activated Carbon Product
- Table 160. Ningxia Huahui Activated Carbon Company Information
- Table 161. Ningxia Huahui Activated Carbon Introduction and Business Overview
- Table 162. Ningxia Huahui Activated Carbon Activated Carbon Sales (K MT), Revenue (US$ Million), Price (USD/MT) and Gross Margin (2018-2023)
- Table 163. Ningxia Huahui Activated Carbon Activated Carbon Product
- Table 164. Shanxi Xinhua Chemical Company Information
- Table 165. Shanxi Xinhua Chemical Introduction and Business Overview
- Table 166. Shanxi Xinhua Chemical Activated Carbon Sales (K MT), Revenue (US$ Million), Price (USD/MT) and Gross Margin (2018-2023)
- Table 167. Shanxi Xinhua Chemical Activated Carbon Product
- Table 168. China Energy Investment Corporation Company Information
- Table 169. China Energy Investment Corporation Introduction and Business Overview
- Table 170. China Energy Investment Corporation Activated Carbon Sales (K MT), Revenue (US$ Million), Price (USD/MT) and Gross Margin (2018-2023)
- Table 171. China Energy Investment Corporation Activated Carbon Product
- Table 172. Silcarbon Aktivkohle GmbH Company Information
- Table 173. Silcarbon Aktivkohle GmbH Introduction and Business Overview
- Table 174. Silcarbon Aktivkohle GmbH Activated Carbon Sales (K MT), Revenue (US$ Million), Price (USD/MT) and Gross Margin (2018-2023)
- Table 175. Silcarbon Aktivkohle GmbH Activated Carbon Product
- Table 176. CarboTech AC GmbH Company Information
- Table 177. CarboTech AC GmbH Introduction and Business Overview
- Table 178. CarboTech AC GmbH Activated Carbon Sales (K MT), Revenue (US$ Million), Price (USD/MT) and Gross Margin (2018-2023)
- Table 179. CarboTech AC GmbH Activated Carbon Product
- Table 180. Donau Carbon Company Information
- Table 181. Donau Carbon Introduction and Business Overview
- Table 182. Donau Carbon Activated Carbon Sales (K MT), Revenue (US$ Million), Price (USD/MT) and Gross Margin (2018-2023)
- Table 183. Donau Carbon Activated Carbon Product
- Table 184. Active Char Products Company Information
- Table 185. Active Char Products Introduction and Business Overview
- Table 186. Active Char Products Activated Carbon Sales (K MT), Revenue (US$ Million), Price (USD/MT) and Gross Margin (2018-2023)
- Table 187. Active Char Products Activated Carbon Product
- Table 188. Datong Coal Jinding Activated Carbon Company Information
- Table 189. Datong Coal Jinding Activated Carbon Introduction and Business Overview
- Table 190. Datong Coal Jinding Activated Carbon Activated Carbon Sales (K MT), Revenue (US$ Million), Price (USD/MT) and Gross Margin (2018-2023)
- Table 191. Datong Coal Jinding Activated Carbon Activated Carbon Product
- Table 192. Fujian Zhixing Company Information
- Table 193. Fujian Zhixing Introduction and Business Overview
- Table 194. Fujian Zhixing Activated Carbon Sales (K MT), Revenue (US$ Million), Price (USD/MT) and Gross Margin (2018-2023)
- Table 195. Fujian Zhixing Activated Carbon Product
- Table 196. Key Raw Materials Lists
- Table 197. Raw Materials Key Suppliers Lists
- Table 198. Activated Carbon Market Trends
- Table 199. Activated Carbon Market Drivers
- Table 200. Activated Carbon Market Challenges
- Table 201. Activated Carbon Distributors List
- Table 202. Activated Carbon Downstream Customers
- Table 203. Research Programs/Design for This Report
- Table 204. Key Data Information from Secondary Sources
- Table 205. Key Data Information from Primary Sources
- Table 206. QYR Business Unit and Senior & Team Lead Analysts
List of Figures
- Figure 1. Activated Carbon Product Picture
- Figure 2. Global Activated Carbon Market Size, 2018 VS 2023 VS 2029 (US$ Million)
- Figure 3. Global Activated Carbon Market Size Status and Outlook (2018-2029) & (US$ Million)
- Figure 4. Global Activated Carbon Sales Status and Outlook (2018-2029) & (K MT)
- Figure 5. Coal-based Activated Carbon Product Picture
- Figure 6. Wood-based Activated Carbon Product Picture
- Figure 7. Coconut-based Activated Carbon Product Picture
- Figure 8. Global Activated Carbon Sales by Type (2018-2029) & (US$ Million)
- Figure 9. Global Activated Carbon Market Share by Type in 2022 & 2029
- Figure 10. North America Activated Carbon Sales Market Share in Volume by Type in 2022
- Figure 11. North America Activated Carbon Sales Market Share in Value by Type in 2022
- Figure 12. Europe Activated Carbon Sales Market Share in Volume by Type in 2022
- Figure 13. Europe Activated Carbon Sales Market Share in Value by Type in 2022
- Figure 14. Asia-Pacific Activated Carbon Sales Market Share in Volume by Type in 2022
- Figure 15. Asia-Pacific Activated Carbon Sales Market Share in Value by Type in 2022
- Figure 16. South America Activated Carbon Sales Market Share in Volume by Type in 2022
- Figure 17. South America Activated Carbon Sales Market Share in Value by Type in 2022
- Figure 18. Middle East and Africa Activated Carbon Sales Market Share in Volume by Type in 2022
- Figure 19. Middle East and Africa Activated Carbon Sales Market Share in Value by Type in 2022
- Figure 20. Global Activated Carbon Sales Share by Company in 2022
- Figure 21. Global Activated Carbon Revenue Share by Company in 2022
- Figure 22. The 5 Largest Manufacturers in the World: Market Share by Activated Carbon Revenue in 2022
- Figure 23. Activated Carbon Market Share by Company Type (Tier 1, Tier 2, and Tier 3): 2018 VS 2022
- Figure 24. Water Treatment
- Figure 25. Air Purification
- Figure 26. Mercury Control
- Figure 27. Food & Beverages
- Figure 28. Industrial Processes
- Figure 29. Pharmaceuticals
- Figure 30. Global Activated Carbon Sales by Application (2018-2029) & (US$ Million)
- Figure 31. Global Activated Carbon Market Share by Application in 2022 & 2029
- Figure 32. North America Activated Carbon Sales Market Share in Volume by Application in 2022
- Figure 33. North America Activated Carbon Sales Market Share in Value by Application in 2022
- Figure 34. Europe Activated Carbon Sales Market Share in Volume by Application in 2022
- Figure 35. Europe Activated Carbon Sales Market Share in Value by Application in 2022
- Figure 36. Asia-Pacific Activated Carbon Sales Market Share in Volume by Application in 2022
- Figure 37. Asia-Pacific Activated Carbon Sales Market Share in Value by Application in 2022
- Figure 38. South America Activated Carbon Sales Market Share in Volume by Application in 2022
- Figure 39. South America Activated Carbon Sales Market Share in Value by Application in 2022
- Figure 40. Middle East and Africa Activated Carbon Sales Market Share in Volume by Application in 2022
- Figure 41. Middle East and Africa Activated Carbon Sales Market Share in Value by Application in 2022
- Figure 42. Coal History Price (USD/MT)
- Figure 43. Activated Carbon Manufacturing Cost Structure
- Figure 44. Activated Carbon Industrial Chain Analysis
- Figure 45. GDP Forecast to 2040
- Figure 46. World Carbon Dioxide Emissions from 1965 to 2021, by region (in million metric tons of carbon dioxide)*
- Figure 47. Channels of Distribution
- Figure 48. Distributors Profiles
- Figure 49. Bottom-up and Top-down Approaches for This Report
- Figure 50. Data Triangulation
- Figure 51. Key Executives Interviewed
Due to the COVID-19 pandemic and Russia-Ukraine War Influence, the global market for Activated Carbon was estimated at US$ 4,827.36 million in the year 2022, is projected to reach a revised size of US$ 5,058.50 million by 2029, growing at a CAGR of 2.04% during the forecast period 2023-2029.
North American market for Activated Carbon was valued at $ 1,054.86 million in 2022 and will reach $ 1,087.45 million by 2029, at a CAGR of 1.80% during the forecast period of 2023 through 2029.
Asia-Pacific market for Activated Carbon was valued at $ 2,297.40 million in 2022 and will reach $ 2,608.52 million by 2029, at a CAGR of 2.95% during the forecast period of 2023 through 2029.
Europe market for Activated Carbon was valued at $ 1,114.28 million in 2022 and will reach $ 974.40 million by 2029, at a CAGR of -0.11% during the forecast period of 2023 through 2029.
Report Scope
This report aims to provide a comprehensive presentation of the global market for Activated Carbon, with both quantitative and qualitative analysis, to help readers develop business/growth strategies, assess the market competitive situation, analyze their position in the current marketplace, and make informed business decisions regarding Activated Carbon.
The Activated Carbon market size, estimations, and forecasts are provided in terms of sales volume (K MT) and revenue ($ millions), considering 2022 as the base year, with history and forecast data for the period from 2018 to 2029. This report segments the global Activated Carbon market comprehensively. Regional market sizes, concerning products by Type, by Application, and by players, are also provided. The influence of COVID-19 and the Russia-Ukraine War were considered while estimating market sizes.
For a more in-depth understanding of the market, the report provides profiles of the competitive landscape, key competitors, and their respective market ranks. The report also discusses technological trends and new product developments.
This report will help the readers to understand the competition within the industries and strategies for the competitive environment to enhance the potential profit. The report also focuses on the competitive landscape of the global Activated Carbon market, and introduces in detail the market share, industry ranking, competitor ecosystem, market performance, new product development, operation situation, expansion, and acquisition. etc. of the main players, which helps the readers to identify the main competitors and deeply understand the competition pattern of the market.
Market Segmentation
This report covers the Activated Carbon segments by manufacturers, by Type, by Application, by region and country, and provides market size (value, volume and average price) and CAGR for the history and forecast period (2018-2022, 2023-2029), considering 2022 as the base year. It elucidates potential revenue opportunities across different segments and explains attractive investment proposition matrices for this market.
By Company
- Ingevity Corporation
- Kuraray
- Osaka Gas Chemicals
- Haycarb
- Norit
- Fujian Yuanli Active Carbon
- MuLinSen Activated Carbon
- Boyce Carbon
- Futamura Chemical
- Core Carbons
- Philippine-Japan Active Carbon Corp
- DESOTEC Activated Carbon
- Fujian Xinsen Carbon
- Ningxia Huahui Activated Carbon
- Shanxi Xinhua Chemical
- China Energy Investment Corporation
- Silcarbon Aktivkohle GmbH
- CarboTech AC GmbH
- Donau Carbon
- Active Char Products
- Datong Coal Jinding Activated Carbon
- Fujian Zhixing
Segment by Type
- Coal-based Activated Carbon
- Wood-based Activated Carbon
- Coconut-based Activated Carbon
Segment by Application
- Water Treatment
- Air Purification
- Mercury Control
- Food & Beverages
- Industrial Processes
- Pharmaceuticals
- Others
By Region
- North America
- United States
- Canada
- Mexico
- Asia-Pacific
- China
- Japan
- South Korea
- India
- Australia
- Southeast Asia
- Europe
- Germany
- France
- U.K.
- Italy
- Spain
- South America
- Brazil
- Argentina
- Middle East & Africa
- GCC Countries
- Egypt
- Turkey
- South Africa
Core Chapters
- Chapter One: Introduces the study scope of this report, executive summary of market segments by Type, market size segments for North America, Europe, Asia Pacific, South America, Middle East & Africa.
- Chapter Two: Detailed analysis of Activated Carbon manufacturers competitive landscape, price, sales, revenue, market share and ranking, latest development plan, merger, and acquisition information, etc.
- Chapter Three: Sales, revenue of Activated Carbon in regional level. It provides a quantitative analysis of the market size and development potential of each region and introduces the future development prospects, and market space in the world.
- Chapter Four: Introduces market segments by Application, market size segment for North America, Europe, Asia Pacific, South America, Middle East & Africa.
- Chapter Five, Six, Seven, Eight and Nine: North America, Europe, Asia Pacific, South America, Middle East & Africa, sales and revenue by country.
- Chapter Ten: Provides profiles of key players, introducing the basic situation of the main companies in the market in detail, including product sales, revenue, price, gross margin, product introduction, recent development, etc.
- Chapter Eleven: Analysis of industrial chain, key raw materials, manufacturing cost, and market dynamics. Introduces the market dynamics, latest developments of the market, the driving factors and restrictive factors of the market, the challenges and risks faced by manufacturers in the industry, and the analysis of relevant policies in the industry.
- Chapter Twelve: Analysis of sales channel, distributors and customers.
- Chapter Thirteen: Research Findings and Conclusion.
Table of Contents
1 Activated Carbon Market Overview
- 1.1 Activated Carbon Product Overview
- 1.2 Activated Carbon Market by Type
- 1.2.1 Coal-based Activated Carbon
- 1.2.2 Wood-based Activated Carbon
- 1.2.3 Coconut-based Activated Carbon
- 1.3 Global Activated Carbon Market Size by Type
- 1.3.1 Global Activated Carbon Market Size Overview by Type (2018-2029)
- 1.3.2 Global Activated Carbon Historic Market Size Review by Type (2018-2023)
- 1.3.3 Global Activated Carbon Forecasted Market Size by Type (2024-2029)
- 1.4 Key Regions Market Size by Type
- 1.4.1 North America Activated Carbon Sales Breakdown by Type (2018-2023)
- 1.4.2 Europe Activated Carbon Sales Breakdown by Type (2018-2023)
- 1.4.3 Asia-Pacific Activated Carbon Sales Breakdown by Type (2018-2023)
- 1.4.4 South America Activated Carbon Sales Breakdown by Type (2018-2023)
- 1.4.5 Middle East and Africa Activated Carbon Sales Breakdown by Type (2018-2023)
2 Activated Carbon Market Competition by Company
- 2.1 Global Top Players by Activated Carbon Sales (2018-2023)
- 2.2 Global Top Players by Activated Carbon Revenue (2018-2023)
- 2.3 Global Top Players by Activated Carbon Price (2018-2023)
- 2.4 Global Top Manufacturers Activated Carbon Manufacturing Base Distribution, Product Type
- 2.5 Activated Carbon Market Competitive Situation and Trends
- 2.5.1 Activated Carbon Market Concentration Rate (2018-2023)
- 2.5.2 Global 5 Largest Manufacturers by Activated Carbon Sales and Revenue in 2022
- 2.6 Global Top Manufacturers by Company Type (Tier 1, Tier 2, and Tier 3) & (based on the Revenue in Activated Carbon as of 2022)
- 2.7 Key Manufacturers Activated Carbon Product Offered
- 2.8 Mergers & Acquisitions, Expansion
3 Activated Carbon Status and Outlook by Region
- 3.1 Global Activated Carbon Market Size and CAGR by Region: 2018 VS 2023 VS 2029
- 3.2 Global Activated Carbon Historic Market Size by Region
- 3.2.1 Global Activated Carbon Sales in Volume by Region (2018-2023)
- 3.2.2 Global Activated Carbon Sales in Value by Region (2018-2023)
- 3.2.3 Global Activated Carbon Sales (Volume & Value), Price and Gross Margin (2018-2023)
- 3.3 Global Activated Carbon Forecasted Market Size by Region
- 3.3.1 Global Activated Carbon Sales in Volume by Region (2024-2029)
- 3.3.2 Global Activated Carbon Sales in Value by Region (2024-2029)
- 3.3.3 Global Activated Carbon Sales (Volume & Value), Price and Gross Margin (2024-2029)
4 Activated Carbon by Application
- 4.1 Activated Carbon Market by Application
- 4.1.1 Water Treatment
- 4.1.2 Air Purification
- 4.1.3 Mercury Control
- 4.1.4 Food & Beverages
- 4.1.5 Industrial Processes
- 4.1.6 Pharmaceuticals
- 4.2 Global Activated Carbon Market Size by Application
- 4.2.1 Global Activated Carbon Market Size Overview by Application (2018-2029)
- 4.2.2 Global Activated Carbon Historic Market Size Review by Application (2018-2023)
- 4.2.3 Global Activated Carbon Forecasted Market Size by Application (2024-2029)
- 4.3 Key Regions Market Size by Application
- 4.3.1 North America Activated Carbon Sales Breakdown by Application (2018-2023)
- 4.3.2 Europe Activated Carbon Sales Breakdown by Application (2018-2023)
- 4.3.3 Asia-Pacific Activated Carbon Sales Breakdown by Application (2018-2023)
- 4.3.4 South America Activated Carbon Sales Breakdown by Application (2018-2023)
- 4.3.5 Middle East and Africa Activated Carbon Sales Breakdown by Application (2018-2023)
5 North America Activated Carbon by Country
- 5.1 North America Activated Carbon Historic Market Size by Country
- 5.1.1 North America Activated Carbon Market Size Growth Rate (CAGR) by Country: 2018 VS 2023 VS 2029
- 5.1.2 North America Activated Carbon Sales in Volume by Country (2018-2023)
- 5.1.3 North America Activated Carbon Sales in Value by Country (2018-2023)
- 5.2 North America Activated Carbon Forecasted Market Size by Country
- 5.2.1 North America Activated Carbon Sales in Volume by Country (2024-2029)
- 5.2.2 North America Activated Carbon Sales in Value by Country (2024-2029)
6 Europe Activated Carbon by Country
- 6.1 Europe Activated Carbon Historic Market Size by Country
- 6.1.1 Europe Activated Carbon Market Size Growth Rate (CAGR) by Country: 2018 VS 2023 VS 2029
- 6.1.2 Europe Activated Carbon Sales in Volume by Country (2018-2023)
- 6.1.3 Europe Activated Carbon Sales in Value by Country (2018-2023)
- 6.2 Europe Activated Carbon Forecasted Market Size by Country
- 6.2.1 Europe Activated Carbon Sales in Volume by Country (2024-2029)
- 6.2.2 Europe Activated Carbon Sales in Value by Country (2024-2029)
7 Asia-Pacific Activated Carbon by Region
- 7.1 Asia-Pacific Activated Carbon Historic Market Size by Region
- 7.1.1 Asia-Pacific Activated Carbon Market Size Growth Rate (CAGR) by Region: 2018 VS 2023 VS 2029
- 7.1.2 Asia-Pacific Activated Carbon Sales in Volume by Region (2018-2023)
- 7.1.3 Asia-Pacific Activated Carbon Sales in Value by Region (2018-2023)
- 7.2 Asia-Pacific Activated Carbon Forecasted Market Size by Region
- 7.2.1 Asia-Pacific Activated Carbon Sales in Volume by Region (2024-2029)
- 7.2.2 Asia-Pacific Activated Carbon Sales in Value by Region (2024-2029)
8 South America Activated Carbon by Country
- 8.1 South America Activated Carbon Historic Market Size by Country
- 8.1.1 South America Activated Carbon Market Size Growth Rate (CAGR) by Country: 2018 VS 2023 VS 2029
- 8.1.2 South America Activated Carbon Sales in Volume by Country (2018-2023)
- 8.1.3 South America Activated Carbon Sales in Value by Country (2018-2023)
- 8.2 South America Activated Carbon Forecasted Market Size by Country
- 8.2.1 South America Activated Carbon Sales in Volume by Country (2024-2029)
- 8.2.2 South America Activated Carbon Sales in Value by Country (2024-2029)
9 Middle East and Africa Activated Carbon by Country
- 9.1 Middle East and Africa Activated Carbon Historic Market Size by Country
- 9.1.1 Middle East and Africa Activated Carbon Market Size Growth Rate (CAGR) by Country: 2018 VS 2023 VS 2029
- 9.1.2 Middle East and Africa Activated Carbon Sales in Volume by Country (2018-2023)
- 9.1.3 Middle East and Africa Activated Carbon Sales in Value by Country (2018-2023)
- 9.2 Middle East and Africa Activated Carbon Forecasted Market Size by Country
- 9.2.1 Middle East and Africa Activated Carbon Sales in Volume by Country (2024-2029)
- 9.2.2 Middle East and Africa Activated Carbon Sales in Value by Country (2024-2029)
10 Company Profiles
- 10.1 Ingevity Corporation
- 10.1.1 Ingevity Corporation Company Information
- 10.1.2 Ingevity Corporation Introduction and Business Overview
- 10.1.3 Ingevity Corporation Activated Carbon Sales, Revenue and Gross Margin (2018-2023)
- 10.1.4 Ingevity Corporation Activated Carbon Products Offered
- 10.2 Kuraray
- 10.2.1 Kuraray Company Information
- 10.2.2 Kuraray Introduction and Business Overview
- 10.2.3 Kuraray Activated Carbon Sales, Revenue and Gross Margin (2018-2023)
- 10.2.4 Kuraray Activated Carbon Products Offered
- 10.3 Osaka Gas Chemicals
- 10.3.1 Osaka Gas Chemicals Company Information
- 10.3.2 Osaka Gas Chemicals Introduction and Business Overview
- 10.3.3 Osaka Gas Chemicals Activated Carbon Sales, Revenue and Gross Margin (2018-2023)
- 10.3.4 Osaka Gas Chemicals Activated Carbon Products Offered
- 10.4 Haycarb
- 10.4.1 Haycarb Company Information
- 10.4.2 Haycarb Introduction and Business Overview
- 10.4.3 Haycarb Activated Carbon Sales, Revenue and Gross Margin (2018-2023)
- 10.4.4 Haycarb Activated Carbon Products Offered
- 10.5 Norit
- 10.5.1 Norit Company Information
- 10.5.2 Norit Introduction and Business Overview
- 10.5.3 Norit Activated Carbon Sales, Revenue and Gross Margin (2018-2023)
- 10.5.4 Norit Activated Carbon Products Offered
- 10.6 Fujian Yuanli Active Carbon
- 10.6.1 Fujian Yuanli Active Carbon Company Information
- 10.6.2 Fujian Yuanli Active Carbon Introduction and Business Overview
- 10.6.3 Fujian Yuanli Active Carbon Activated Carbon Sales, Revenue and Gross Margin (2018-2023)
- 10.6.4 Fujian Yuanli Active Carbon Activated Carbon Products Offered
- 10.7 MuLinSen Activated Carbon
- 10.7.1 MuLinSen Activated Carbon Company Information
- 10.7.2 MuLinSen Activated Carbon Introduction and Business Overview
- 10.7.3 MuLinSen Activated Carbon Activated Carbon Sales, Revenue and Gross Margin (2018-2023)
- 10.7.4 MuLinSen Activated Carbon Activated Carbon Products Offered
- 10.8 Boyce Carbon
- 10.8.1 Boyce Carbon Company Information
- 10.8.2 Boyce Carbon Introduction and Business Overview
- 10.8.3 Boyce Carbon Activated Carbon Sales, Revenue and Gross Margin (2018-2023)
- 10.8.4 Boyce Carbon Activated Carbon Products Offered
- 10.9 Futamura Chemical
- 10.9.1 Futamura Chemical Company Information
- 10.9.2 Futamura Chemical Introduction and Business Overview
- 10.9.3 Futamura Chemical Activated Carbon Sales, Revenue and Gross Margin (2018-2023)
- 10.9.4 Futamura Chemical Activated Carbon Products Offered
- 10.10 Core Carbons
- 10.10.1 Core Carbons Company Information
- 10.10.2 Core Carbons Introduction and Business Overview
- 10.10.3 Core Carbons Activated Carbon Sales, Revenue and Gross Margin (2018-2023)
- 10.10.4 Core Carbons Activated Carbon Products Offered
- 10.11 Philippine-Japan Active Carbon Corp
- 10.11.1 Philippine-Japan Active Carbon Corp Company Information
- 10.11.2 Philippine-Japan Active Carbon Corp Introduction and Business Overview
- 10.11.3 Philippine-Japan Active Carbon Corp Activated Carbon Sales, Revenue and Gross Margin (2018-2023)
- 10.11.4 Philippine-Japan Active Carbon Corp Activated Carbon Products Offered
- 10.12 DESOTEC Activated Carbon
- 10.12.1 DESOTEC Activated Carbon Company Information
- 10.12.2 DESOTEC Activated Carbon Introduction and Business Overview
- 10.12.3 DESOTEC Activated Carbon Activated Carbon Sales, Revenue and Gross Margin (2018-2023)
- 10.12.4 DESOTEC Activated Carbon Activated Carbon Products Offered
- 10.13 Fujian Xinsen Carbon
- 10.13.1 Fujian Xinsen Carbon Company Information
- 10.13.2 Fujian Xinsen Carbon Introduction and Business Overview
- 10.13.3 Fujian Xinsen Carbon Activated Carbon Sales, Revenue and Gross Margin (2018-2023)
- 10.13.4 Fujian Xinsen Carbon Activated Carbon Products Offered
- 10.14 Ningxia Huahui Activated Carbon
- 10.14.1 Ningxia Huahui Activated Carbon Company Information
- 10.14.2 Ningxia Huahui Activated Carbon Introduction and Business Overview
- 10.14.3 Ningxia Huahui Activated Carbon Activated Carbon Sales, Revenue and Gross Margin (2018-2023)
- 10.14.4 Ningxia Huahui Activated Carbon Activated Carbon Products Offered
- 10.15 Shanxi Xinhua Chemical
- 10.15.1 Shanxi Xinhua Chemical Company Information
- 10.15.2 Shanxi Xinhua Chemical Introduction and Business Overview
- 10.15.3 Shanxi Xinhua Chemical Activated Carbon Sales, Revenue and Gross Margin (2018-2023)
- 10.15.4 Shanxi Xinhua Chemical Activated Carbon Products Offered
- 10.16 China Energy Investment Corporation
- 10.16.1 China Energy Investment Corporation Company Information
- 10.16.2 China Energy Investment Corporation Introduction and Business Overview
- 10.16.3 China Energy Investment Corporation Activated Carbon Sales, Revenue and Gross Margin (2018-2023)
- 10.16.4 China Energy Investment Corporation Activated Carbon Products Offered
- 10.17 Silcarbon Aktivkohle GmbH
- 10.17.1 Silcarbon Aktivkohle GmbH Company Information
- 10.17.2 Silcarbon Aktivkohle GmbH Introduction and Business Overview
- 10.17.3 Silcarbon Aktivkohle GmbH Activated Carbon Sales, Revenue and Gross Margin (2018-2023)
- 10.17.4 Silcarbon Aktivkohle GmbH Activated Carbon Products Offered
- 10.18 CarboTech AC GmbH
- 10.18.1 CarboTech AC GmbH Company Information
- 10.18.2 CarboTech AC GmbH Introduction and Business Overview
- 10.18.3 CarboTech AC GmbH Activated Carbon Sales, Revenue and Gross Margin (2018-2023)
- 10.18.4 CarboTech AC GmbH Activated Carbon Products Offered
- 10.19 Donau Carbon
- 10.19.1 Donau Carbon Company Information
- 10.19.2 Donau Carbon Introduction and Business Overview
- 10.19.3 Donau Carbon Activated Carbon Sales, Revenue and Gross Margin (2018-2023)
- 10.19.4 Donau Carbon Activated Carbon Products Offered
- 10.20 Active Char Products
- 10.20.1 Active Char Products Company Information
- 10.20.2 Active Char Products Introduction and Business Overview
- 10.20.3 Active Char Products Activated Carbon Sales, Revenue and Gross Margin (2018-2023)
- 10.20.4 Active Char Products Activated Carbon Products Offered
- 10.21 Datong Coal Jinding Activated Carbon
- 10.21.1 Datong Coal Jinding Activated Carbon Company Information
- 10.21.2 Datong Coal Jinding Activated Carbon Introduction and Business Overview
- 10.21.3 Datong Coal Jinding Activated Carbon Activated Carbon Sales, Revenue and Gross Margin (2018-2023)
- 10.21.4 Datong Coal Jinding Activated Carbon Activated Carbon Products Offered
- 10.22 Fujian Zhixing
- 10.22.1 Fujian Zhixing Company Information
- 10.22.2 Fujian Zhixing Introduction and Business Overview
- 10.22.3 Fujian Zhixing Activated Carbon Sales, Revenue and Gross Margin (2018-2023)
- 10.22.4 Fujian Zhixing Activated Carbon Products Offered
11 Upstream, Opportunities, Challenges, Risks and Influences Factors Analysis
- 11.1 Activated Carbon Key Raw Materials
- 11.1.1 Key Raw Materials
- 11.1.2 Key Raw Materials Price
- 11.1.3 Raw Materials Key Suppliers
- 11.2 Manufacturing Cost Structure
- 11.2.1 Raw Materials
- 11.2.2 Labor Cost
- 11.2.3 Manufacturing Expenses
- 11.3 Activated Carbon Industrial Chain Analysis
- 11.4 Activated Carbon Market Dynamics
- 11.4.1 Activated Carbon Industry Trends
- 11.4.2 Activated Carbon Market Drivers
- 11.4.3 Activated Carbon Market Challenges
- 11.4.4 Activated Carbon Market Restraints
12 Marketing Strategy Analysis, Distributors
- 12.1 Sales Channel
- 12.2 Activated Carbon Distributors
- 12.3 Activated Carbon Downstream Customers
13 Research Findings and Conclusion
14 Appendix
- 14.1 Research Methodology
- 14.1.1 Methodology/Research Approach
- 14.1.2 Data Source
- 14.2 Author Details
- 14.3 Disclaimer