|
|
市場調査レポート
商品コード
1273255
トラクションモーターコアの世界市場の分析 (2023年)Global Traction Motor Core Market Research Report 2023 |
||||||
|
|
|||||||
カスタマイズ可能
適宜更新あり
|
|||||||


| トラクションモーターコアの世界市場の分析 (2023年) |
|
出版日: 2023年05月16日
発行: QYResearch
ページ情報: 英文 114 Pages
納期: 2~3営業日
|

- 全表示
- 概要
- 図表
- 目次
世界のトラクションモーターコアの市場規模は、2022年に25億9,140万米ドル、2029年には84億4,790万米ドルに達すると予測され、予測期間中 (2023年~2029年) に17.12%のCAGRで成長する見通しです。
2022年に、日本のトラクションモーターコアの市場規模は11億6,340万米ドル、中国と韓国の市場規模はそれぞれ4億6,970万米ドルと2億7,820万米ドルに達する見通しです。中国の割合は2022年に18.13%に達し、2029年までに31.15%の市場シェアを占めると予想されています。
製品種類別に見ると、永久磁石モーターコアはアジア太平洋と北米のEVメーカーで主に使用されており、2022年に世界のトラクションモーターコア市場の79.8%を占め、2023年から2029年までに改訂17.94%のCAGRで成長し、2029年までに71億5,220万米ドルに達すると予測されます。AC誘導モーターコアは、EU市場や全輪駆動型EVモデルで簡単に見つけることができ、2022年の世界市場シェアは約20%となっています。
世界のトラクションモーターコアの主要メーカーとして、Mitsui High-tec、EUROTRANCIATURA、POSCO、Suzhou Fine-stamping、Tempel Steel、Hidria、JFE Shoji、Wuxi Longsheng Technology、Tongda Power Technology、Toyota Boshoku Corporation、Kienle Spiess、Shiri Electromechanical Technology、Yutaka Giken and Kuroda Precisionなどが挙げられます。2022年には、世界の上位5社で約69.70%の市場シェア (収益ベース) を占めています。
目次
第1章 トラクションモーターコア:市場概要
- 製品の定義
- トラクションモーターコア:種類別
- 世界のトラクションモーターコアの市場額の成長率の分析:種類別 (2022年・2029年)
- 永久磁石モーターコア
- AC誘導モーターコア
- トラクションモーターコア:用途別
- 世界のトラクションモーターコアの市場額の成長率の分析:用途別 (2022年・2029年)
- HEV
- EV
- 世界市場の成長見通し
- 世界のトラクションモーターコアの収益、推定・予測 (2018年~2029年)
- 世界のトラクションモーターコアの生産、推定・予測 (2018年~2029年)
- 世界のトラクションモーターコアの平均市場価格、推定・予測 (2018年~2029年)
- 前提・制約条件
第2章 市場競合:メーカー別
- 世界のトラクションモーターコアの生産の市場シェア:メーカー別 (2019年~2022年)
- 世界のトラクションモーターコアの収益の市場シェア:メーカー別 (2019年~2022年)
- 世界のトラクションモーターコアの主要企業:業界ランキング (2021年・2022年)
- 世界のトラクションモーターコアの市場シェア:企業の種類別(ティア1、ティア2、ティア3)
- 世界のトラクションモーターコアの平均価格:メーカー別 (2019年~2022年)
- 世界のトラクションモーターコアの主要メーカー:製造拠点・本社
- 世界の主要メーカーの設立時期
- 世界のトラクションモーターコア市場:競争状況と動向
- 企業合併・買収 (M&A)、拡大
第3章 トラクションモーターコアの生産:地域別
- 世界のトラクションモーターコアの収益、推定・予測:地域別 (2018年・2022年・2029年)
- 世界のトラクションモーターコアの収益:地域別 (2018年~2029年)
- 世界のトラクションモーターコアの生産、推定・予測:地域別 (2018年・2022年・2029年)
- 世界のトラクションモーターコアの生産:地域別 (2018年~2029年)
- 世界のトラクションモーターコアの市場価格の分析:地域別 (2018年~2023年)
- 世界のトラクションモーターコアの生産・生産額・対前年成長率
- 北米のトラクションモーターコアの収益、推定・予測 (2018年~2029年)
- 欧州のトラクションモーターコアの収益、推定・予測 (2018年~2029年)
- 日本のトラクションモーターコアの収益、推定・予測 (2018年~2029年)
- 中国のトラクションモーターコアの収益、推定・予測 (2018年~2029年)
- 韓国のトラクションモーターコアの収益、推定・予測 (2018年~2029年)
第4章 トラクションモーターコアの消費:地域別
- 世界のトラクションモーターコアの消費、推定・予測:地域別 (2018年・2022年・2029年)
- 世界のトラクションモーターコアの消費:地域別 (2018年~2029年)
- 北米
- 米国
- カナダ
- 欧州
- ドイツ
- フランス
- 英国
- イタリア
- スペイン
- アジア太平洋
- 中国
- 日本
- 韓国
第5章 セグメント:種類別
- 世界のトラクションモーターコアの生産:種類別 (2018年~2029年)
- 世界のトラクションモーターコアの収益:種類別 (2018年~2029年)
- 世界のトラクションモーターコアの価格:種類別 (2018年~2029年)
第6章 セグメント:用途別
- 世界のトラクションモーターコアの生産:用途別 (2018年~2029年)
- 世界のトラクションモーターコアの収益:用途別 (2018年~2029年)
第7章 主要企業のプロファイル
- Mitsui High-tec
- POSCO
- EUROTRANCIATURA
- Tempel Steel
- Suzhou Fine-stamping
- Hidria
- JFE Shoji
- Wuxi Longsheng Technology
- Tongda Power Technology
- Toyota Boshoku Corporation
- Kienle Spiess
- Shiri Electromechanical Technology
- Yutaka Giken
- Kuroda Precision
第8章 産業チェーンと販売チャネルの分析
- トラクションモーターコアの産業チェーンの分析
- トラクションモーターコアの主要原材料
- トラクションモーターコアの製造モードとプロセス
- トラクションモーターコアの販売とマーケティング
- トラクションモーターコアの顧客
第9章 市場力学
- トラクションモーターコア市場の動向
- トラクションモーターコアの機会と促進要因
- トラクションモーターコア市場の課題
第10章 調査結果と結論
第11章 調査手法とデータソース
List of Tables
- Table 1. Global Traction Motor Core Market Value by Type, (US$ Million) & (2022 VS 2029)
- Table 2. Global Traction Motor Core Market Value by Application, (US$ Million) & (2022 VS 2029)
- Table 3. Global Traction Motor Core Production by Manufacturers (2019-2022) & (K Unit)
- Table 4. Global Traction Motor Core Production Market Share by Manufacturers (2019-2022)
- Table 5. Global Traction Motor Core Revenue by Manufacturers (2019-2022) & (US$ Million)
- Table 6. Global Traction Motor Core Revenue Share by Manufacturers (2019-2022)
- Table 7. Global Key Players of Traction Motor Core, Industry Ranking, 2021 VS 2022
- Table 8. Global Company Type (Tier 1, Tier 2, and Tier 3) & (based on the Revenue in Traction Motor Core as of 2022)
- Table 9. Global Market Traction Motor Core Average Price by Manufacturers (US$/Unit) & (2019-2022)
- Table 10. Global Key Manufacturers of Traction Motor Core, Manufacturing Sites & Headquarters
- Table 11. Established Date of Global Key Manufacturers
- Table 12. Global Traction Motor Core Manufacturers Market Concentration Ratio (CR5)
- Table 13. Mergers & Acquisitions, Expansion Plans
- Table 14. Global Traction Motor Core Revenue Growth Rate by Region: 2018 VS 2022 VS 2029 (US$ Million)
- Table 15. Global Traction Motor Core Revenue (US$ Million) by Region (2018-2023)
- Table 16. Global Traction Motor Core Revenue Market Share by Region (2018-2023)
- Table 17. Global Traction Motor Core Revenue (US$ Million) Forecast by Region (2024-2029)
- Table 18. Global Traction Motor Core Revenue Market Share Forecast by Region (2024-2029)
- Table 19. Global Traction Motor Core Production Comparison by Region: 2018 VS 2022 VS 2029 (K Unit)
- Table 20. Global Traction Motor Core Production (K Unit) by Region (2018-2023)
- Table 21. Global Traction Motor Core Production Market Share by Region (2018-2023)
- Table 22. Global Traction Motor Core Production (K Unit) Forecast by Region (2024-2029)
- Table 23. Global Traction Motor Core Production Market Share Forecast by Region (2024-2029)
- Table 24. Global Traction Motor Core Market Average Price (US$/Unit) by Region (2018-2023)
- Table 25. Global Traction Motor Core Market Average Price (US$/Unit) by Region (2024-202*)
- Table 26. Global Traction Motor Core Consumption Growth Rate by Region: 2018 VS 2022 VS 2029 (K Unit)
- Table 27. Global Traction Motor Core Consumption by Region (2018-2023) & (K Unit)
- Table 28. Global Traction Motor Core Consumption Market Share by Region (2018-2023)
- Table 29. Global Traction Motor Core Forecasted Consumption by Region (2024-2029) & (K Unit)
- Table 30. Global Traction Motor Core Forecasted Consumption Market Share by Region (2018-2023)
- Table 31. North America Traction Motor Core Consumption Growth Rate by Country: 2018 VS 2022 VS 2029 (K Unit)
- Table 32. North America Traction Motor Core Consumption by Country (2018-2023) & (K Unit)
- Table 33. North America Traction Motor Core Consumption by Country (2024-2029) & (K Unit)
- Table 34. Europe Traction Motor Core Consumption Growth Rate by Country: 2018 VS 2022 VS 2029 (K Unit)
- Table 35. Europe Traction Motor Core Consumption by Country (2018-2023) & (K Unit)
- Table 36. Europe Traction Motor Core Consumption by Country (2024-2029) & (K Unit)
- Table 37. Asia Pacific Traction Motor Core Consumption Growth Rate by Country: 2018 VS 2022 VS 2029 (K Unit)
- Table 38. Asia Pacific Traction Motor Core Consumption by Region (2018-2023) & (K Unit)
- Table 39. Asia Pacific Traction Motor Core Consumption by Region (2024-2029) & (K Unit)
- Table 40. Global Traction Motor Core Production (K Unit) by Type (2018-2023)
- Table 41. Global Traction Motor Core Production (K Unit) by Type (2024-2029)
- Table 42. Global Traction Motor Core Production Market Share by Type (2018-2023)
- Table 43. Global Traction Motor Core Production Market Share by Type (2024-2029)
- Table 44. Global Traction Motor Core Revenue (US$ Million) by Type (2018-2023)
- Table 45. Global Traction Motor Core Revenue (US$ Million) by Type (2024-2029)
- Table 46. Global Traction Motor Core Revenue Market Share by Type (2018-2023)
- Table 47. Global Traction Motor Core Revenue Market Share by Type (2024-2029)
- Table 48. Global Traction Motor Core Price (US$/Unit) by Type (2018-2023)
- Table 49. Global Traction Motor Core Price (US$/Unit) by Type (2024-2029)
- Table 50. Global Traction Motor Core Production (K Unit) by Application (2018-2023)
- Table 51. Global Traction Motor Core Production (K Unit) by Application (2024-2029)
- Table 52. Global Traction Motor Core Production Market Share by Application (2018-2023)
- Table 53. Global Traction Motor Core Production Market Share by Application (2024-2029)
- Table 54. Global Traction Motor Core Revenue (US$ Million) by Application (2018-2023)
- Table 55. Global Traction Motor Core Revenue (US$ Million) by Application (2024-2029)
- Table 56. Global Traction Motor Core Revenue Market Share by Application (2018-2023)
- Table 57. Global Traction Motor Core Revenue Market Share by Application (2024-2029)
- Table 58. Mitsui High-tec Company Information
- Table 59. Mitsui High-tec Traction Motor Core Product Portfolio
- Table 60. Mitsui High-tec Traction Motor Core Production (K Unit), Value (US$ Million), Price (US$/Unit) and Gross Margin (2019-2022)
- Table 61. Mitsui High-tec Description and Business Overview
- Table 62. POSCO Company Information
- Table 63. POSCO Traction Motor Core Product Portfolio
- Table 64. POSCO Traction Motor Core Production (K Unit), Value (US$ Million), Price (US$/Unit) and Gross Margin (2019-2022)
- Table 65. POSCO Description and Business Overview
- Table 66. EUROTRANCIATURA Company Information
- Table 67. EUROTRANCIATURA Traction Motor Core Production (K Unit), Value (US$ Million), Price (US$/Unit) and Gross Margin (2019-2022)
- Table 68. EUROTRANCIATURA Description and Business Overview
- Table 69. Tempel Steel Company Information
- Table 70. Tempel Steel Traction Motor Core Production (K Unit), Value (US$ Million), Price (US$/Unit) and Gross Margin (2019-2022)
- Table 71. Tempel Steel Description and Business Overview
- Table 72. Suzhou Fine-stamping Company Information
- Table 73. Suzhou Fine-stamping Traction Motor Core Production (K Unit), Value (US$ Million), Price (US$/Unit) and Gross Margin (2019-2022)
- Table 74. Suzhou Fine-stamping Description and Business Overview
- Table 75. Hidria Company Information
- Table 76. Hidria Traction Motor Core Production (K Unit), Value (US$ Million), Price (US$/Unit) and Gross Margin (2019-2022)
- Table 77. Hidria Description and Business Overview
- Table 78. JFE Shoji Company Information
- Table 79. JFE Shoji Traction Motor Core Production (K Unit), Value (US$ Million), Price (US$/Unit) and Gross Margin (2019-2022)
- Table 80. JFE Shoji Description and Business Overview
- Table 81. Wuxi Longsheng Technology Company Information
- Table 82. Wuxi Longsheng Technology Traction Motor Core Production (K Unit), Value (US$ Million), Price (US$/Unit) and Gross Margin (2019-2022)
- Table 83. Wuxi Longsheng Technology Description and Business Overview
- Table 84. Tongda Power Technology Company Information
- Table 85. Tongda Power Technology Traction Motor Core Production (K Unit), Value (US$ Million), Price (US$/Unit) and Gross Margin (2019-2022)
- Table 86. Tongda Power Technology Description and Business Overview
- Table 87. Toyota Boshoku Corporation Company Information
- Table 88. Toyota Boshoku Corporation Traction Motor Core Product Portfolio
- Table 89. Toyota Boshoku Corporation Traction Motor Core Production (K Unit), Value (US$ Million), Price (US$/Unit) and Gross Margin (2019-2022)
- Table 90. Toyota Boshoku Corporation Description and Business Overview
- Table 91. Kienle Spiess Company Information
- Table 92. Kienle Spiess Traction Motor Core Production (K Unit), Value (US$ Million), Price (US$/Unit) and Gross Margin (2019-2022)
- Table 93. Kienle Spiess Description and Business Overview
- Table 94. Shiri Electromechanical Technology Company Information
- Table 95. Shiri Electromechanical Technology Traction Motor Core Production (K Unit), Value (US$ Million), Price (US$/Unit) and Gross Margin (2019-2022)
- Table 96. Shiri Electromechanical Technology Description and Business Overview
- Table 97. Yutaka Giken Company Information
- Table 98. Yutaka Giken Traction Motor Core Product Portfolio
- Table 99. Yutaka Giken Traction Motor Core Production (K Unit), Value (US$ Million), Price (US$/Unit) and Gross Margin (2019-2022)
- Table 100. Yutaka Giken Description and Business Overview
- Table 101. Kuroda Precision Company Information
- Table 102. Kuroda Precision Traction Motor Core Product Portfolio
- Table 103. Kuroda Precision Traction Motor Core Production (K Unit), Value (US$ Million), Price (US$/Unit) and Gross Margin (2019-2022)
- Table 104. Kuroda Precision Description and Business Overview
- Table 105. Raw Materials Key Suppliers Lists
- Table 106. Traction Motor Core Customers List
- Table 107. Automotive Traction Motor Core Market Key Trends
- Table 108. Automotive Traction Motor Core Key Opportunities and Drivers
- Table 109. Automotive Traction Motor Core Market Challenges
- Table 110. Research Programs/Design for This Report
- Table 111. Key Data Information from Secondary Sources
- Table 112. Key Data Information from Primary Sources
- Table 113. Authors List of This Report
- Table 114. QYR Business Unit and Senior & Team Lead Analysts
List of Figures
- Figure 1. Product Picture of Traction Motor Core
- Figure 2. Global Traction Motor Core Market Value by Type, (US$ Million) & (2022 VS 2029)
- Figure 3. Global Traction Motor Core Market Share by Type: 2022 VS 2029
- Figure 4. Global Traction Motor Core Market Value by Application, (US$ Million) & (2022 VS 2029)
- Figure 5. Global Traction Motor Core Market Share by Application: 2022 VS 2029
- Figure 6. HEV
- Figure 7. EV
- Figure 8. Global Traction Motor Core Revenue (US$ Million), 2018 VS 2022 VS 2029
- Figure 9. Global Traction Motor Core Revenue (US$ Million) & (2018-2029)
- Figure 10. Global Traction Motor Core Production (K Unit) & (2018-2029)
- Figure 11. Global Traction Motor Core Average Price (US$/Unit) & (2018-2029)
- Figure 12. Traction Motor Core Report Years Considered
- Figure 13. Traction Motor Core Production Share by Manufacturers in 2022
- Figure 14. Traction Motor Core Revenue Share by Manufacturers in 2022
- Figure 15. Global Traction Motor Core Revenue Comparison by Region: 2018 VS 2022 VS 2029 (US$ Million)
- Figure 16. Global Traction Motor Core Revenue Market Share by Region: 2018 VS 2022 VS 2029
- Figure 17. Global Traction Motor Core Production Comparison by Region: 2018 VS 2022 VS 2029 (K Unit)
- Figure 18. Global Traction Motor Core Production Market Share by Region: 2018 VS 2022 VS 2029
- Figure 19. North America Traction Motor Core Revenue (US$ Million) Growth Rate (2018-2029)
- Figure 20. Europe Traction Motor Core Revenue (US$ Million) Growth Rate (2018-2029)
- Figure 21. Japan Traction Motor Core Revenue (US$ Million) Growth Rate (2018-2029)
- Figure 22. China Traction Motor Core Revenue (US$ Million) Growth Rate (2018-2029)
- Figure 23. South Korea Traction Motor Core Revenue (US$ Million) Growth Rate (2018-2029)
- Figure 24. Global Traction Motor Core Consumption by Region: 2018 VS 2022 VS 2029 (K Unit)
- Figure 25. Global Traction Motor Core Consumption Market Share by Region: 2018 VS 2022 VS 2029
- Figure 26. North America Traction Motor Core Consumption and Growth Rate (2018-2029) & (K Unit)
- Figure 27. North America Traction Motor Core Consumption Market Share by Country (2018-2029)
- Figure 28. U.S. Traction Motor Core Consumption and Growth Rate (2018-2029) & (K Unit)
- Figure 29. Canada Traction Motor Core Consumption and Growth Rate (2018-2029) & (K Unit)
- Figure 30. Europe Traction Motor Core Consumption and Growth Rate (2018-2029) & (K Unit)
- Figure 31. Europe Traction Motor Core Consumption Market Share by Country (2018-2029)
- Figure 32. Germany Traction Motor Core Consumption and Growth Rate (2018-2029) & (K Unit)
- Figure 33. France Traction Motor Core Consumption and Growth Rate (2018-2029) & (K Unit)
- Figure 34. U.K. Traction Motor Core Consumption and Growth Rate (2018-2029) & (K Unit)
- Figure 35. Italy Traction Motor Core Consumption and Growth Rate (2018-2029) & (K Unit)
- Figure 36. Spain Traction Motor Core Consumption and Growth Rate (2018-2029) & (K Unit)
- Figure 37. Asia Pacific Traction Motor Core Consumption and Growth Rate (2018-2029) & (K Unit)
- Figure 38. Asia Pacific Traction Motor Core Consumption Market Share by Region (2024-2029)
- Figure 39. China Traction Motor Core Consumption and Growth Rate (2018-2029) & (K Unit)
- Figure 40. Japan Traction Motor Core Consumption and Growth Rate (2018-2029) & (K Unit)
- Figure 41. South Korea Traction Motor Core Consumption and Growth Rate (2018-2029) & (K Unit)
- Figure 42. Global Production Market Share of Traction Motor Core by Type (2018-2029)
- Figure 43. Global Revenue Market Share of Traction Motor Core by Type (2018-2029)
- Figure 44. Global Production Market Share of Traction Motor Core by Application (2018-2029)
- Figure 45. Global Revenue Market Share of Traction Motor Core by Application (2018-2029)
- Figure 46. EUROTRANCIATURA Traction Motor Core Product Portfolio
- Figure 47. Tempel Steel Traction Motor Core Product Portfolio
- Figure 48. Suzhou Fine-stamping Traction Motor Core Product Portfolio
- Figure 49. Hidria Traction Motor Core Product Portfolio
- Figure 50. JFE Shoji Traction Motor Core Product Portfolio
- Figure 51. Wuxi Longsheng Technology Traction Motor Core Product Portfolio
- Figure 52. Tongda Power Technology Traction Motor Core Product Portfolio
- Figure 53. Kienle Spiess Traction Motor Core Product Portfolio
- Figure 54. Shiri Electromechanical Technology Traction Motor Core Product Portfolio
- Figure 55. Traction Motor Core Value Chain
- Figure 56. Traction Motor Core Production Process
- Figure 57. Channels of Distribution
- Figure 58. Distributors Profiles
- Figure 59. Bottom-up and Top-down Approaches for This Report
- Figure 60. Data Triangulation
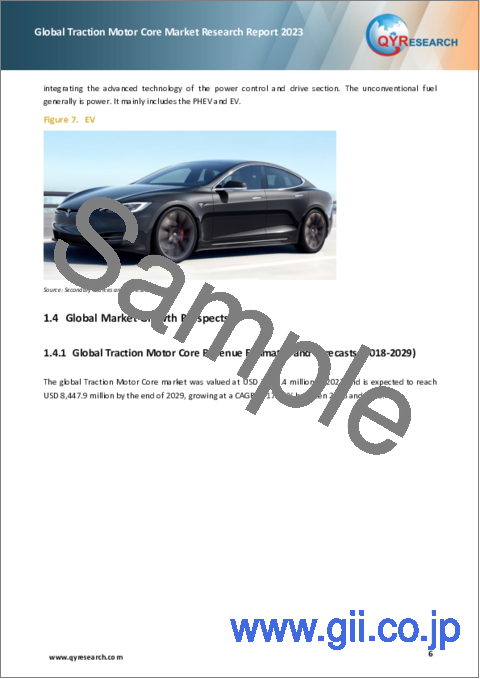
According to our research, the global traction motor core market was valued at US$ 2,591.4 million in 2022 and is anticipated to reach US$ 8,447.9 million by 2029, witnessing a CAGR of 17.12% during the forecast period 2023-2029.
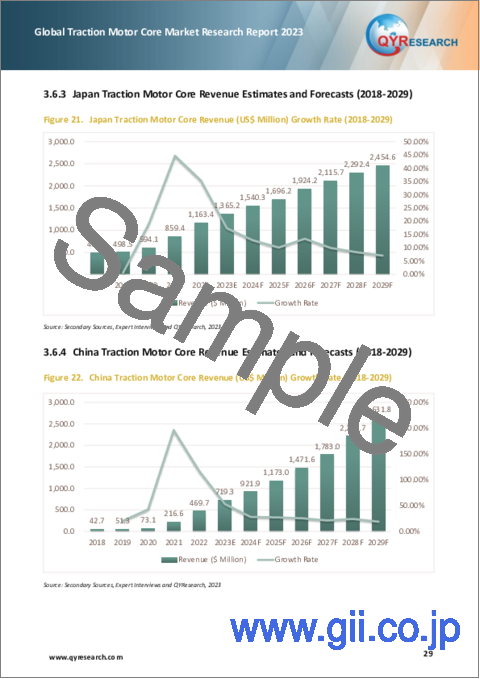
Japan traction motor core market size was US$ 1,163.4 million in 2022, while the China and South Korea traction motor core were US$ 469.7 million and US$ 278.2 million, the proportion of the China was 18.13% in 2022, expect to occupy 31.15% market share by 2029.
Based on the product type, permanent magnet motor cores are mostly used in Asia pacific and North America EV makers, which accounting for 79.8% of the traction motor core global market in 2022, is projected to value US$ 7,152.2 million by 2029, growing at a revised 17.94% CAGR from 2023 to 2029. AC Induction Motor Cores are easily being found in EU Market and all-drive electric vehicle models, hold about 20% global market share in 2022.
The global key manufacturers of traction motor core include: Mitsui High-tec, EUROTRANCIATURA, POSCO, Suzhou Fine-stamping, Tempel Steel, Hidria, JFE Shoji, Wuxi Longsheng Technology, Tongda Power Technology, Toyota Boshoku Corporation, Kienle Spiess, Shiri Electromechanical Technology, Yutaka Giken and Kuroda Precision, etc. In 2022, the global top five players hold a share approximately 69.70% in terms of revenue.
Report Scope
This report aims to provide a comprehensive presentation of the global market for Traction Motor Core, with both quantitative and qualitative analysis, to help readers develop business/growth strategies, assess the market competitive situation, analyze their position in the current marketplace, and make informed business decisions regarding Traction Motor Core.
The Traction Motor Core market size, estimations, and forecasts are provided in terms of output/shipments (K Unit) and revenue ($ millions), considering 2022 as the base year, with history and forecast data for the period from 2018 to 2029. This report segments the global Traction Motor Core market comprehensively. Regional market sizes, concerning products by Type, by Application, and by players, are also provided.
For a more in-depth understanding of the market, the report provides profiles of the competitive landscape, key competitors, and their respective market ranks. The report also discusses technological trends and new product developments.
The report will help the Traction Motor Core manufacturers, new entrants, and industry chain related companies in this market with information on the revenues, production, and average price for the overall market and the sub-segments across the different segments, by company, by Type, by Application, and by regions.
By Company
- Mitsui High-tec
- EUROTRANCIATURA
- POSCO
- Suzhou Fine-stamping
- Tempel Steel
- Hidria
- JFE Shoji
- Wuxi Longsheng Technology
- Tongda Power Technology
- Toyota Boshoku Corporation
- Kienle Spiess
- Shiri Electromechanical Technology
- Yutaka Giken
- Kuroda Precision
by Type
- Permanent Magnet Motor Cores
- AC Induction Motor Cores
by Application
- HEV
- EV
Production by Region
- North America
- Europe
- Japan
- China
- South Korea
Consumption by Region
- North America
- U.S.
- Canada
- Asia-Pacific
- China
- Japan
- South Korea
- Europe
- Germany
- France
- U.K.
- Italy
- Spain
- Rest of Europe
Core Chapters
- Chapter 1: Introduces the report scope of the report, executive summary of different market segments (by region, by Type, by Application, etc), including the market size of each market segment, future development potential, and so on. It offers a high-level view of the current state of the market and its likely evolution in the short to mid-term, and long term.
- Chapter 2: Detailed analysis of Traction Motor Core manufacturers competitive landscape, price, production and value market share, latest development plan, merger, and acquisition information, etc.
- Chapter 3: Production/output, value of Traction Motor Core by region/country. It provides a quantitative analysis of the market size and development potential of each region in the next six years.
- Chapter 4: Consumption of Traction Motor Core in regional level and country level. It provides a quantitative analysis of the market size and development potential of each region and its main countries and introduces the market development, future development prospects, market space, and production of each country in the world.
- Chapter 5: Provides the analysis of various market segments by Type, covering the market size and development potential of each market segment, to help readers find the blue ocean market in different market segments.
- Chapter 6: Provides the analysis of various market segments by Application, covering the market size and development potential of each market segment, to help readers find the blue ocean market in different downstream markets.
- Chapter 7: Provides profiles of key players, introducing the basic situation of the main companies in the market in detail, including product production/output, value, price, gross margin, product introduction, recent development, etc.
- Chapter 8: Analysis of industrial chain, including the upstream and downstream of the industry.
- Chapter 9: Introduces the market dynamics, latest developments of the market, the driving factors and restrictive factors of the market, the challenges and risks faced by manufacturers in the industry, and the analysis of relevant policies in the industry.
- Chapter 10: The main points and conclusions of the report.
Table of Contents
1 Traction Motor Core Market Overview
- 1.1 Product Definition
- 1.2 Traction Motor Core by Type
- 1.2.1 Global Traction Motor Core Market Value Growth Rate Analysis by Type: 2022 VS 2029
- 1.2.2 Permanent Magnet Motor Cores
- 1.2.3 AC Induction Motor Cores
- 1.3 Traction Motor Core by Application
- 1.3.1 Global Traction Motor Core Market Value Growth Rate Analysis by Application: 2022 VS 2029
- 1.3.2 HEV
- 1.3.3 EV
- 1.4 Global Market Growth Prospects
- 1.4.1 Global Traction Motor Core Revenue Estimates and Forecasts (2018-2029)
- 1.4.2 Global Traction Motor Core Production Estimates and Forecasts (2018-2029)
- 1.4.3 Global Traction Motor Core Market Average Price Estimates and Forecasts (2018-2029)
- 1.5 Assumptions and Limitations
2 Market Competition by Manufacturers
- 2.1 Global Traction Motor Core Production Market Share by Manufacturers (2019-2022)
- 2.2 Global Traction Motor Core Revenue Market Share by Manufacturers (2019-2022)
- 2.3 Global Key Players of Traction Motor Core, Industry Ranking, 2021 VS 2022
- 2.4 Global Traction Motor Core Market Share by Company Type (Tier 1, Tier 2, and Tier 3)
- 2.5 Global Traction Motor Core Average Price by Manufacturers (2019-2022)
- 2.6 Global Key Manufacturers of Traction Motor Core, Manufacturing Sites & Headquarters
- 2.7 Established Date of Global Key Manufacturers
- 2.8 Global Traction Motor Core Market Competitive Situation and Trends
- 2.9 Mergers & Acquisitions, Expansion
3 Traction Motor Core Production by Region
- 3.1 Global Traction Motor Core Revenue Estimates and Forecasts by Region: 2018 VS 2022 VS 2029
- 3.2 Global Traction Motor Core Revenue by Region (2018-2029)
- 3.2.1 Global Traction Motor Core Revenue Market Share by Region (2018-2023)
- 3.2.2 Global Forecasted Revenue of Traction Motor Core by Region (2024-2029)
- 3.3 Global Traction Motor Core Production Estimates and Forecasts by Region: 2018 VS 2022 VS 2029
- 3.4 Global Traction Motor Core Production by Region (2018-2029)
- 3.4.1 Global Traction Motor Core Production Market Share by Region (2018-2023)
- 3.4.2 Global Forecasted Production of Traction Motor Core by Region (2024-2029)
- 3.5 Global Traction Motor Core Market Price Analysis by Region (2018-2023)
- 3.6 Global Traction Motor Core Production and Value, Year-over-Year Growth
- 3.6.1 North America Traction Motor Core Revenue Estimates and Forecasts (2018-2029)
- 3.6.2 Europe Traction Motor Core Revenue Estimates and Forecasts (2018-2029)
- 3.6.3 Japan Traction Motor Core Revenue Estimates and Forecasts (2018-2029)
- 3.6.4 China Traction Motor Core Revenue Estimates and Forecasts (2018-2029)
- 3.6.5 South Korea Traction Motor Core Revenue Estimates and Forecasts (2018-2029)
4 Traction Motor Core Consumption by Region
- 4.1 Global Traction Motor Core Consumption Estimates and Forecasts by Region: 2018 VS 2022 VS 2029
- 4.2 Global Traction Motor Core Consumption by Region (2018-2029)
- 4.2.1 Global Traction Motor Core Consumption by Region (2018-2029)
- 4.2.2 Global Traction Motor Core Forecasted Consumption by Region (2024-2029)
- 4.3 North America
- 4.3.1 North America Traction Motor Core Consumption Growth Rate by Country: 2018 VS 2022 VS 2029
- 4.3.2 North America Traction Motor Core Consumption by Country (2018-2029)
- 4.3.3 U.S.
- 4.3.4 Canada
- 4.4 Europe
- 4.4.1 Europe Traction Motor Core Consumption Growth Rate by Country: 2018 VS 2022 VS 2029
- 4.4.2 Europe Traction Motor Core Consumption by Country (2018-2029)
- 4.4.3 Germany
- 4.4.4 France
- 4.4.5 U.K.
- 4.4.6 Italy
- 4.4.7 Spain
- 4.5 Asia Pacific
- 4.5.1 Europe Traction Motor Core Consumption Growth Rate by Country: 2018 VS 2022 VS 2029
- 4.5.2 Asia Pacific Traction Motor Core Consumption by Region (2018-2029)
- 4.5.3 China
- 4.5.4 Japan
- 4.5.5 South Korea
5 Segment by Type
- 5.1 Global Traction Motor Core Production by Type (2018-2029)
- 5.1.1 Global Traction Motor Core Production by Type (2018-2023)
- 5.1.2 Global Traction Motor Core Production by Type (2024-2029)
- 5.1.3 Global Traction Motor Core Production Market Share by Type (2018-2029)
- 5.2 Global Traction Motor Core Revenue by Type (2018-2029)
- 5.2.1 Global Traction Motor Core Revenue by Type (2018-2023)
- 5.2.2 Global Traction Motor Core Revenue by Type (2024-2029)
- 5.2.3 Global Traction Motor Core Revenue Market Share by Type (2018-2029)
- 5.3 Global Traction Motor Core Price by Type (2018-2029)
6 Segment by Application
- 6.1 Global Traction Motor Core Production by Application (2018-2029)
- 6.1.1 Global Traction Motor Core Production by Application (2018-2023)
- 6.1.2 Global Traction Motor Core Production by Application (2024-2029)
- 6.1.3 Global Traction Motor Core Production Market Share by Application (2018-2029)
- 6.2 Global Traction Motor Core Revenue by Application (2018-2029)
- 6.2.1 Global Traction Motor Core Revenue by Application (2018-2023)
- 6.2.2 Global Traction Motor Core Revenue by Application (2024-2029)
- 6.2.3 Global Traction Motor Core Revenue Market Share by Application (2018-2029)
7 Key Companies Profiled
- 7.1 Mitsui High-tec
- 7.1.1 Mitsui High-tec Company Information
- 7.1.2 Mitsui High-tec Traction Motor Core Product Portfolio
- 7.1.3 Mitsui High-tec Traction Motor Core Production, Value, Price and Gross Margin (2019-2022)
- 7.1.4 Mitsui High-tec Description and Business Overview
- 7.2 POSCO
- 7.2.1 POSCO Company Information
- 7.2.2 POSCO Traction Motor Core Product Portfolio
- 7.2.3 POSCO Traction Motor Core Production, Value, Price and Gross Margin (2019-2022)
- 7.2.4 POSCO Description and Business Overview
- 7.3 EUROTRANCIATURA
- 7.3.1 EUROTRANCIATURA Company Information
- 7.3.2 EUROTRANCIATURA Traction Motor Core Product Portfolio
- 7.3.3 EUROTRANCIATURA Traction Motor Core Production, Value, Price and Gross Margin (2019-2022)
- 7.3.4 EUROTRANCIATURA Description and Business Overview
- 7.4 Tempel Steel
- 7.4.1 Tempel Steel Company Information
- 7.4.2 Tempel Steel Traction Motor Core Product Portfolio
- 7.4.3 Tempel Steel Traction Motor Core Production, Value, Price and Gross Margin (2019-2022)
- 7.4.4 Tempel Steel Description and Business Overview
- 7.5 Suzhou Fine-stamping
- 7.5.1 Suzhou Fine-stamping Company Information
- 7.5.2 Suzhou Fine-stamping Traction Motor Core Product Portfolio
- 7.5.3 Suzhou Fine-stamping Traction Motor Core Production, Value, Price and Gross Margin (2019-2022)
- 7.5.4 Suzhou Fine-stamping Description and Business Overview
- 7.6 Hidria
- 7.6.1 Hidria Company Information
- 7.6.2 Hidria Traction Motor Core Product Portfolio
- 7.6.3 Hidria Traction Motor Core Production, Value, Price and Gross Margin (2019-2022)
- 7.6.4 Hidria Description and Business Overview
- 7.7 JFE Shoji
- 7.7.1 JFE Shoji Company Information
- 7.7.2 JFE Shoji Traction Motor Core Product Portfolio
- 7.7.3 JFE Shoji Traction Motor Core Production, Value, Price and Gross Margin (2019-2022)
- 7.7.4 JFE Shoji Description and Business Overview
- 7.8 Wuxi Longsheng Technology
- 7.8.1 Wuxi Longsheng Technology Company Information
- 7.8.2 Wuxi Longsheng Technology Traction Motor Core Product Portfolio
- 7.8.3 Wuxi Longsheng Technology Traction Motor Core Production, Value, Price and Gross Margin (2019-2022)
- 7.8.4 Wuxi Longsheng Technology Description and Business Overview
- 7.9 Tongda Power Technology
- 7.9.1 Tongda Power Technology Company Information
- 7.9.2 Tongda Power Technology Traction Motor Core Product Portfolio
- 7.9.3 Tongda Power Technology Traction Motor Core Production, Value, Price and Gross Margin (2019-2022)
- 7.9.4 Tongda Power Technology Description and Business Overview
- 7.10 Toyota Boshoku Corporation
- 7.10.1 Toyota Boshoku Corporation Company Information
- 7.10.2 Toyota Boshoku Corporation Traction Motor Core Product Portfolio
- 7.10.3 Toyota Boshoku Corporation Traction Motor Core Production, Value, Price and Gross Margin (2019-2022)
- 7.10.4 Toyota Boshoku Corporation Description and Business Overview
- 7.11 Kienle Spiess
- 7.11.1 Kienle Spiess Company Information
- 7.11.2 Kienle Spiess Traction Motor Core Product Portfolio
- 7.11.3 Kienle Spiess Traction Motor Core Production, Value, Price and Gross Margin (2019-2022)
- 7.11.4 Kienle Spiess Description and Business Overview
- 7.12 Shiri Electromechanical Technology
- 7.12.1 Shiri Electromechanical Technology Company Information
- 7.12.2 Shiri Electromechanical Technology Traction Motor Core Product Portfolio
- 7.12.3 Shiri Electromechanical Technology Traction Motor Core Production, Value, Price and Gross Margin (2019-2022)
- 7.12.4 Shiri Electromechanical Technology Description and Business Overview
- 7.13 Yutaka Giken
- 7.13.1 Yutaka Giken Company Information
- 7.13.2 Yutaka Giken Traction Motor Core Product Portfolio
- 7.13.3 Yutaka Giken Traction Motor Core Production, Value, Price and Gross Margin (2019-2022)
- 7.13.4 Yutaka Giken Description and Business Overview
- 7.14 Kuroda Precision
- 7.14.1 Kuroda Precision Company Information
- 7.14.2 Kuroda Precision Traction Motor Core Product Portfolio
- 7.14.3 Kuroda Precision Traction Motor Core Production, Value, Price and Gross Margin (2019-2022)
- 7.14.4 Kuroda Precision Description and Business Overview
8 Industry Chain and Sales Channels Analysis
- 8.1 Traction Motor Core Industry Chain Analysis
- 8.2 Traction Motor Core Key Raw Materials
- 8.2.1 Key Raw Materials
- 8.2.2 Raw Materials Key Suppliers
- 8.3 Traction Motor Core Production Mode & Process
- 8.4 Traction Motor Core Sales and Marketing
- 8.4.1 Marketing Channel
- 8.4.2 Traction Motor Core Distributors
- 8.5 Traction Motor Core Customers
9 Market Dynamics
- 9.1 Automotive Traction Motor Core Market Trends
- 9.2 Automotive Traction Motor Core Opportunities and Drivers
- 9.3 Automotive Traction Motor Core Market Challenges
10 Research Findings and Conclusion
11 Methodology and Data Source
- 11.1 Methodology/Research Approach
- 11.1.1 Research Programs/Design
- 11.1.2 Market Size Estimation
- 11.1.3 Market Breakdown and Data Triangulation
- 11.2 Data Source
- 11.2.1 Secondary Sources
- 11.2.2 Primary Sources
- 11.3 Author List
- 11.4 Disclaimer