|
|
市場調査レポート
商品コード
1241270
パラセタモールの世界市場の分析 (2023年)Global Paracetamol Market Research Report 2023 |
||||||
|
|
|||||||
|
● お客様のご希望に応じて、既存データの加工や未掲載情報(例:国別セグメント)の追加などの対応が可能です。 詳細はお問い合わせください。 |
|||||||


| パラセタモールの世界市場の分析 (2023年) |
|
出版日: 2023年03月22日
発行: QYResearch
ページ情報: 英文 116 Pages
納期: 2~3営業日
|
- 全表示
- 概要
- 図表
- 目次
世界のパラセタモールの市場規模は、2022年に13億2,575万米ドルに達した後、2023年から2029年にかけて2.53%のCAGRで成長し、2029年末には13億7,142万米ドルに達すると予測されています。
COVID-19の影響により、パラセタモールは世界中で巨大な需要が生じており、ここ数年で10%以上の成長を遂げていると推定されます。
当レポートでは、世界のパラセタモールの市場について分析し、種類別・用途別・地域別 (国別) の市場動向の見通し (2018年~2029年)、主要企業のプロファイルなどについて調査しております。
目次
第1章 パラセタモール:市場概要
- 製品の定義
- パラセタモール市場:種類別
- 市場規模の比較:種類別 (金額ベース、2023年~2029年)
- パラセタモール市場:用途別
- 世界のパラセタモールの市場規模:推定・予測
- 世界のパラセタモールの収益 (2018年~2029年)
- 世界のパラセタモールの販売 (2018年~2029年)
- 世界のパラセタモールの平均価格 (2018年~2029年)
- 前提・制約条件
第2章 パラセタモール:メーカー別の市場競争
- 世界のパラセタモールの販売・市場シェア:メーカー別 (2019年~2022年)
- 世界のパラセタモールの収益・市場シェア:メーカー別 (2019年~2022年)
- 世界のパラセタモールの平均価格:メーカー別 (2019年~2022年)
- 世界のパラセタモールの主要企業:業界ランキング (2021年・2022年)
- パラセタモールの主要メーカー:本社・提供エリア
- パラセタモールの主要メーカー:市場参入時期
- 世界のパラセタモール市場:競争状況と動向
- 企業合併・買収 (M&A)、拡大
第3章 世界のパラセタモール市場:地域別のシナリオ
- 世界のパラセタモールの市場規模:地域別 (2018年・2022年・2029年)
- 世界のパラセタモールの販売:地域別 (2018年~2029年)
- 販売:地域別 (2018年~2023年)
- 販売:地域別 (2024年~2029年)
- 世界のパラセタモールの収益:地域別 (2018年~2029年)
- 収益:地域別 (2018年~2023年)
- 収益:地域別 (2024年~2029年)
- 北米のパラセタモール市場:国別の詳細データ
- 米国
- カナダ
- 欧州のパラセタモール市場:国別の詳細データ
- ドイツ
- フランス
- 英国
- イタリア
- ロシア
- アジア太平洋のパラセタモール市場:地域別の詳細データ
- 中国
- 日本
- 韓国
- インド
- 東南アジア
- オーストラリア
- ラテンアメリカのパラセタモール市場:国別の詳細データ
- メキシコ
- ブラジル
- アルゼンチン
- 中東・アフリカのパラセタモール市場:国別の詳細データ
- トルコ
- エジプト
- ナイジェリア
第4章 種類別のセグメント
- パラセタモールの販売:種類別 (2018年~2029年)
- パラセタモールの収益:種類別 (2018年~2029年)
- パラセタモールの価格:種類別 (2018年~2029年)
第5章 用途別のセグメント
- パラセタモールの販売:用途別 (2018年~2029年)
- パラセタモールの収益:用途別 (2018年~2029年)
- パラセタモールの価格:用途別 (2018年~2029年)
第7章 主要企業のプロファイル
- Mallinckrodt
- 企業情報
- 企業・事業概要
- 販売・収益・粗利益 (2019年~2022年)
- 製品ポートフォリオ
- Anqiu Lu'an
- Hebei Jiheng
- Farmson
- Granules India
- Sri Krishna Pharma
- Zhejiang Kangle
- Anhui BBCA Likang
- Seqens
- Atabay
- Anhui Fubore
第7章 産業チェーンと販売チャネルの分析
- パラセタモールの産業チェーンの分析
- パラセタモールの製造工程と主要原材料
- パラセタモールの販売とマーケティング
- パラセタモールの顧客
第8章 パラセタモールの市場力学
- パラセタモール市場の促進要因
- 新型コロナウイルス感染症 (COVID-19) の影響分析
第10章 調査結果と結論
第11章 調査手法とデータソース
List of Tables
- Table 1. Global Paracetamol Market Value Comparison by Type (2023-2029) & (US$ Million)
- Table 2. Global Paracetamol Market Value by Application (2023-2029) & (US$ Million)
- Table 3. Global Paracetamol Market Competitive Situation by Manufacturers in 2022
- Table 4. Global Paracetamol Sales (MT) of Key Manufacturers (2019-2022)
- Table 5. Global Paracetamol Sales Market Share by Manufacturers (2019-2022)
- Table 6. Global Paracetamol Revenue (US$ Million) by Manufacturers (2019-2022)
- Table 7. Global Paracetamol Revenue Share by Manufacturers (2019-2022)
- Table 8. Global Market Paracetamol Average Price (US$/MT) of Key Manufacturers (2019-2022)
- Table 9. Global Key Players of Paracetamol, Industry Ranking, 2021 VS 2022
- Table 10. Global Key Manufacturers of Paracetamol, Headquarters and Area Served
- Table 11. Global Key Manufacturers of Paracetamol, Date of Enter into This Industry
- Table 12. Global Manufacturers Market Concentration Ratio (CR5)
- Table 13. Global Paracetamol by Company Type (Tier 1, Tier 2, and Tier 3) & (based on the Revenue in Paracetamol as of 2022)
- Table 14. Manufacturers Mergers & Acquisitions, Expansion Plans
- Table 15. Global Paracetamol Market Size by Region (US$ Million): 2018 VS 2022 VS 2029
- Table 16. Global Paracetamol Sales by Region (2018-2023) & (MT)
- Table 17. Global Paracetamol Sales Market Share by Region (2018-2023)
- Table 18. Global Paracetamol Sales by Region (2024-2029) & (MT)
- Table 19. Global Paracetamol Sales Market Share by Region (2024-2029)
- Table 20. Global Paracetamol Revenue by Region (2018-2023) & (US$ Million)
- Table 21. Global Paracetamol Revenue Market Share by Region (2018-2023)
- Table 22. Global Paracetamol Revenue by Region (2024-2029) & (US$ Million)
- Table 23. Global Paracetamol Revenue Market Share by Region (2024-2029)
- Table 24. North America Paracetamol Revenue by Country: 2018 VS 2022 VS 2029 (US$ Million)
- Table 25. North America Paracetamol Sales by Country (2018-2023) & (MT)
- Table 26. North America Paracetamol Sales by Country (2024-2029) & (MT)
- Table 27. North America Paracetamol Revenue by Country (2018-2023) & (US$ Million)
- Table 28. North America Paracetamol Revenue by Country (2024-2029) & (US$ Million)
- Table 29. Europe Paracetamol Revenue by Country: 2018 VS 2022 VS 2029 (US$ Million)
- Table 30. Europe Paracetamol Sales by Country (2018-2023) & (MT)
- Table 31. Europe Paracetamol Sales by Country (2024-2029) & (MT)
- Table 32. Europe Paracetamol Revenue by Country (2018-2023) & (US$ Million)
- Table 33. Europe Paracetamol Revenue by Country (2024-2029) & (US$ Million)
- Table 34. Asia Pacific Paracetamol Revenue by Region: 2018 VS 2022 VS 2029 (US$ Million)
- Table 35. Asia Pacific Paracetamol Sales by Region (2018-2023) & (MT)
- Table 36. Asia Pacific Paracetamol Sales by Region (2024-2029) & (MT)
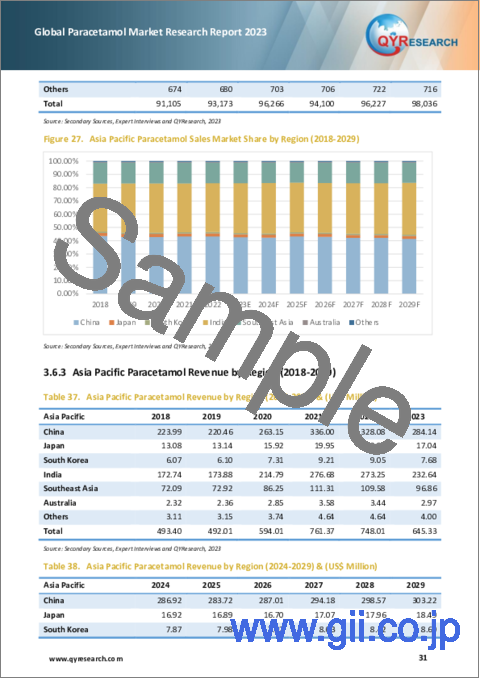
- Table 37. Asia Pacific Paracetamol Revenue by Region (2018-2023) & (US$ Million)
- Table 38. Asia Pacific Paracetamol Revenue by Region (2024-2029) & (US$ Million)
- Table 39. Latin America Paracetamol Revenue by Country: 2018 VS 2022 VS 2029 (US$ Million)
- Table 40. Latin America Paracetamol Sales by Country (2018-2023) & (MT)
- Table 41. Latin America Paracetamol Sales by Country (2024-2029) & (MT)
- Table 42. Latin America Paracetamol Revenue by Country (2018-2023) & (US$ Million)
- Table 43. Latin America Paracetamol Revenue Market Share by Country (2018-2023)
- Table 44. Middle East and Africa Paracetamol Revenue by Country: 2018 VS 2022 VS 2029 (US$ Million)
- Table 45. Middle East and Africa Paracetamol Sales by Country (2018-2023) & (MT)
- Table 46. Middle East and Africa Paracetamol Sales by Country (2024-2029) & (MT)
- Table 47. Middle East and Africa Paracetamol Revenue by Country (2018-2023) & (US$ Million)
- Table 48. Middle East and Africa Paracetamol Revenue by Country (2024-2029) & (US$ Million)
- Table 49. Global Paracetamol Sales (MT) by Type (2018-2023)
- Table 50. Global Paracetamol Sales (MT) by Type (2024-2029)
- Table 51. Global Paracetamol Sales Market Share by Type (2018-2023)
- Table 52. Global Paracetamol Sales Market Share by Type (2024-2029)
- Table 53. Global Paracetamol Revenue (US$ Million) by Type (2018-2023)
- Table 54. Global Paracetamol Revenue (US$ Million) by Type (2024-2029)
- Table 55. Global Paracetamol Revenue Market Share by Type (2018-2023)
- Table 56. Global Paracetamol Revenue Market Share by Type (2024-2029)
- Table 57. Global Paracetamol Price (US$/MT) by Type (2018-2023)
- Table 58. Global Paracetamol Price (US$/MT) by Type (2024-2029)
- Table 59. Global Paracetamol Sales (MT) by Application (2018-2023)
- Table 60. Global Paracetamol Sales (MT) by Application (2024-2029)
- Table 61. Global Paracetamol Sales Market Share by Application (2018-2023)
- Table 62. Global Paracetamol Sales Market Share by Application (2024-2029)
- Table 63. Global Paracetamol Revenue (US$ Million) by Application (2018-2023)
- Table 64. Global Paracetamol Revenue (US$ Million) by Application (2024-2029)
- Table 65. Global Paracetamol Revenue Market Share by Application (2018-2023)
- Table 66. Global Paracetamol Revenue Market Share by Application (2024-2029)
- Table 67. Mallinckrodt Company Information
- Table 68. Mallinckrodt Description and Business Overview
- Table 69. Mallinckrodt Paracetamol Sales (MT), Revenue (US$ Million), Price (US$/Ton) and Gross Margin (2019-2022)
- Table 70. Mallinckrodt Paracetamol Capacity (MT) and Key Raw Material (Para-aminophenol) Source
- Table 71. Mallinckrodt Paracetamol Product
- Table 72. Anqiu Lu'an Company Information
- Table 73. Anqiu Lu'an Description and Business Overview
- Table 74. Anqiu Lu'an Paracetamol Sales (MT), Revenue (US$ Million), Price (US$/Ton) and Gross Margin (2019-2022)
- Table 75. Anqiu Lu'an Paracetamol Capacity (MT) and Key Raw Material (Para-aminophenol) Source
- Table 76. Anqiu Lu'an Paracetamol Product
- Table 77. Hebei Jiheng Company Information
- Table 78. Hebei Jiheng Description and Business Overview
- Table 79. Hebei Jiheng Paracetamol Sales (MT), Revenue (US$ Million), Price (US$/Ton) and Gross Margin (2019-2022)
- Table 80. Hebei Jiheng Paracetamol Capacity (MT) and Key Raw Material (Para-aminophenol) Source
- Table 81. Hebei Jiheng Paracetamol Product
- Table 82. Farmson Company Information
- Table 83. Farmson Description and Business Overview
- Table 84. Farmson Paracetamol Sales (MT), Revenue (US$ Million), Price (US$/Ton) and Gross Margin (2019-2022)
- Table 85. Farmson Paracetamol Capacity (MT) and Key Raw Material (Para-aminophenol) Source
- Table 86. Farmson Paracetamol Product
- Table 87. Granules India Company Information
- Table 88. Granules India Description and Business Overview
- Table 89. Granules India Paracetamol Sales (MT), Revenue (US$ Million), Price (US$/Ton) and Gross Margin (2019-2022)
- Table 90. Granules India Paracetamol Capacity (MT) and Key Raw Material (Para-aminophenol) Source
- Table 91. Granules India Paracetamol Product
- Table 92. Sri Krishna Pharma Company Information
- Table 93. Sri Krishna Pharma Description and Business Overview
- Table 94. Sri Krishna Pharma Paracetamol Sales (MT), Revenue (US$ Million), Price (US$/Ton) and Gross Margin (2019-2022)
- Table 95. Sri Krishna Pharma Paracetamol Capacity (MT) and Key Raw Material (Para-aminophenol) Source
- Table 96. Sri Krishna Pharma Paracetamol Product
- Table 97. Zhejiang Kangle Company Information
- Table 98. Zhejiang Kangle Description and Business Overview
- Table 99. Zhejiang Kangle Paracetamol Sales (MT), Revenue (US$ Million), Price (US$/Ton) and Gross Margin (2019-2022)
- Table 100. Zhejiang Kangle Paracetamol Capacity (MT) and Key Raw Material (Para-aminophenol) Source
- Table 101. Zhejiang Kangle Paracetamol Product
- Table 102. Anhui BBCA Likang Company Information
- Table 103. Anhui BBCA Likang Description and Business Overview
- Table 104. Anhui BBCA Likang Paracetamol Sales (MT), Revenue (US$ Million), Price (US$/Ton) and Gross Margin (2019-2022)
- Table 105. Anhui BBCA Likang Paracetamol Capacity (MT) and Key Raw Material (Para-aminophenol) Source
- Table 106. Anhui BBCA Likang Paracetamol Product
- Table 107. Seqens Company Information
- Table 108. Seqens Description and Business Overview
- Table 109. Seqens Paracetamol Sales (MT), Revenue (US$ Million), Price (US$/Ton) and Gross Margin (2019-2022)
- Table 110. Seqens Paracetamol Capacity (MT) and Key Raw Material (Para-aminophenol) Source
- Table 111. Seqens Paracetamol Product
- Table 112. Atabay Company Information
- Table 113. Atabay Description and Business Overview
- Table 114. Atabay Paracetamol Sales (MT), Revenue (US$ Million), Price (US$/Ton) and Gross Margin (2019-2022)
- Table 115. Atabay Paracetamol Capacity (MT) and Key Raw Material (Para-aminophenol) Source
- Table 116. Atabay Paracetamol Product
- Table 117. Anhui Fubore Company Information
- Table 118. Anhui Fubore Description and Business Overview
- Table 119. Anhui Fubore Paracetamol Sales (MT), Revenue (US$ Million), Price (US$/Ton) and Gross Margin (2019-2022)
- Table 120. Anhui Fubore Paracetamol Capacity (MT) and Key Raw Material (Para-aminophenol) Source
- Table 121. Anhui Fubore Paracetamol Product
- Table 122. Key Raw Materials Lists
- Table 123. Raw Materials(Para-Aminophenol) Key Suppliers Lists
- Table 124. Paracetamol Distributors List
- Table 125. Paracetamol Customers List
- Table 126. Research Programs/Design for This Report
- Table 127. Key Data Information from Secondary Sources
- Table 128. Key Data Information from Primary Sources
- Table 129. Authors List of This Report
- Table 130. QYR Business Unit and Senior & Team Lead Analysts
List of Figures
- Figure 1. Product Picture of Paracetamol
- Figure 2. Global Paracetamol Market Value Comparison by Type (2023-2029) & (US$ Million)
- Figure 3. Global Paracetamol Market Share by Type: 2022 & 2029
- Figure 4. Global Paracetamol Market Value by Application (2023-2029) & (US$ Million)
- Figure 5. Global Paracetamol Market Share by Application: 2022 & 2029
- Figure 6. Global Paracetamol Revenue, (US$ Million), 2018 VS 2022 VS 2029
- Figure 7. Global Paracetamol Market Size (2018-2029) & (US$ Million)
- Figure 8. Global Paracetamol Sales (2018-2029) & (MT)
- Figure 9. Global Paracetamol Average Price (US$/Ton) & (2018-2029)
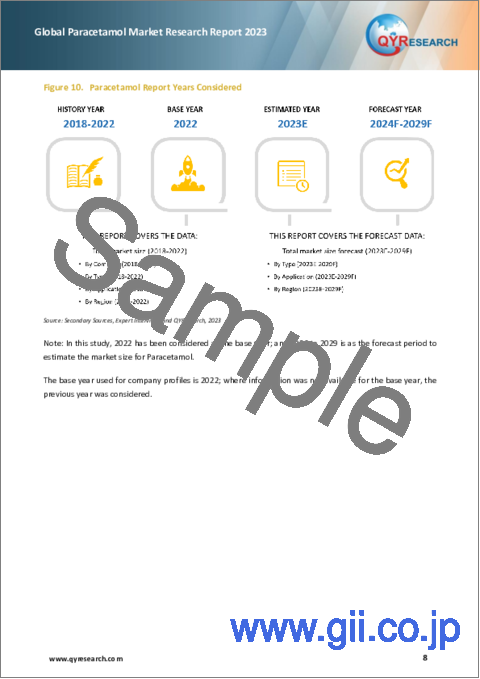
- Figure 10. Paracetamol Report Years Considered
- Figure 11. Paracetamol Sales Share by Manufacturers in 2022
- Figure 12. Global Paracetamol Revenue Share by Manufacturers in 2022
- Figure 13. Global 5 Largest Paracetamol Players: Market Share by Revenue in Paracetamol in 2022
- Figure 14. Global 10 Largest Paracetamol Players: Market Share by Revenue in Paracetamol in 2022
- Figure 15. Global Paracetamol Market Size by Region (US$ Million): 2018-2029
- Figure 16. North America Paracetamol Sales Market Share by Country (2018-2029)
- Figure 17. North America Paracetamol Revenue Market Share by Country (2018-2029)
- Figure 18. United States Paracetamol Revenue Growth Rate (2018-2029) & (US$ Million)
- Figure 19. Canada Paracetamol Revenue Growth Rate (2018-2029) & (US$ Million)
- Figure 20. Europe Paracetamol Sales Market Share by Country (2018-2029)
- Figure 21. Europe Paracetamol Revenue Market Share by Country (2018-2029)
- Figure 22. Germany Paracetamol Revenue Growth Rate (2018-2029) & (US$ Million)
- Figure 23. France Paracetamol Revenue Growth Rate (2018-2029) & (US$ Million)
- Figure 24. U.K. Paracetamol Revenue Growth Rate (2018-2029) & (US$ Million)
- Figure 25. Italy Paracetamol Revenue Growth Rate (2018-2029) & (US$ Million)
- Figure 26. Russia Paracetamol Revenue Growth Rate (2018-2029) & (US$ Million)
- Figure 27. Asia Pacific Paracetamol Sales Market Share by Region (2018-2029)
- Figure 28. Asia Pacific Paracetamol Revenue Market Share by Region (2018-2029)
- Figure 29. China Paracetamol Revenue Growth Rate (2018-2029) & (US$ Million)
- Figure 30. Japan Paracetamol Revenue Growth Rate (2018-2029) & (US$ Million)
- Figure 31. South Korea Paracetamol Revenue Growth Rate (2018-2029) & (US$ Million)
- Figure 32. India Paracetamol Revenue Growth Rate (2018-2029) & (US$ Million)
- Figure 33. Southeast Asia Paracetamol Revenue Growth Rate (2018-2029) & (US$ Million)
- Figure 34. Australia Paracetamol Revenue Growth Rate (2018-2029) & (US$ Million)
- Figure 35. Latin America Paracetamol Sales Market Share by Country (2018-2029)
- Figure 36. Mexico Paracetamol Revenue Growth Rate (2018-2029) & (US$ Million)
- Figure 37. Brazil Paracetamol Revenue Growth Rate (2018-2029) & (US$ Million)
- Figure 38. Argentina Paracetamol Revenue Growth Rate (2018-2029) & (US$ Million)
- Figure 39. Middle East and Africa Paracetamol Sales Market Share by Country (2018-2029)
- Figure 40. Middle East and Africa Paracetamol Revenue Market Share by Country (2018-2029)
- Figure 41. Turkey Paracetamol Revenue Growth Rate (2018-2029) & (US$ Million)
- Figure 42. Egypt Paracetamol Revenue Growth Rate (2018-2029) & (US$ Million)
- Figure 43. Nigeria Paracetamol Revenue Growth Rate (2018-2029) & (US$ Million)
- Figure 44. Global Sales Market Share of Paracetamol by Type (2018-2029)
- Figure 45. Global Revenue Market Share of Paracetamol by Type (2018-2029)
- Figure 46. Global Paracetamol Price (US$/MT) by Type (2018-2029)
- Figure 47. Global Sales Market Share of Paracetamol by Application (2018-2029)
- Figure 48. Global Revenue Market Share of Paracetamol by Application (2018-2029)
- Figure 49. Paracetamol Value Chain
- Figure 50. Paracetamol Production Process
- Figure 51. Channels of Distribution
- Figure 52. Distributors Profiles
- Figure 53. Bottom-up and Top-down Approaches for This Report
- Figure 54. Data Triangulation
- Figure 55. Key Executives Interviewed
The global paracetamol market is valued at USD 1,325.75 million in 2022 and is expected to reach USD 1,371.42 million by the end of 2029, growing at a CAGR of 2.53% between 2023 and 2029. the actual sales is about 168363 tons in 2022. Due the COVID-19 impact, paracetamol is highly demand all around the world, and estimate growing more than 10% compare to past few years.
The paracetamol market is relative concentrated market; key players include Mallinckrodt, Anqiu Lu'an, Granules India, Farmson, Hebei Jiheng, Zhejiang Kangle, Sri Krishna Pharma, Anhui BBCA Likang, Seqens, Atabay and Anhui Fubore; the revenue of top ten manufacturers accounts about 88.22% of the total revenue in 2022.
The consequences of the Covid issue on global medicine supply chains have rekindled discussions about international trade and a potential shortage of medications and generics, including Paracetamol in Europe. Inflation that cannot be controlled will continue to be a major worry for pharmaceutical businesses globally in 2023. While the severity of the effects of underlying inflation is anticipated to decrease gradually over the course of the year, there are indications that inflation pressure will be more persistent than originally anticipated. This could lead to pharmaceutical companies that make Paracetamol having to contend for longer than current baseline projections with semi-permanently increased input prices and other interconnected issues.
Report Scope
This report aims to provide a comprehensive presentation of the global market for Paracetamol, with both quantitative and qualitative analysis, to help readers develop business/growth strategies, assess the market competitive situation, analyze their position in the current marketplace, and make informed business decisions regarding Paracetamol.
The Paracetamol market size, estimations, and forecasts are provided in terms of sales volume (MT) and revenue ($ millions), considering 2021 as the base year, with history and forecast data for the period from 2017 to 2028. This report segments the global Paracetamol market comprehensively. Regional market sizes, concerning products by Type, by Application, and by players, are also provided.
For a more in-depth understanding of the market, the report provides profiles of the competitive landscape, key competitors, and their respective market ranks. The report also discusses technological trends and new product developments.
The report will help the Paracetamol manufacturers, new entrants, and industry chain related companies in this market with information on the revenues, sales volume, and average price for the overall market and the sub-segments across the different segments, by company, by Type, by Application, and by regions.
By Company
- Mallinckrodt
- Anqiu Lu'an
- Granules India
- Farmson
- Hebei Jiheng
- Zhejiang Kangle
- Sri Krishna Pharma
- Anhui BBCA Likang
- Seqens
- Atabay
- Anhui Fubore
Segment by Type
- Powder Type
- Granule Type
Segment by Application
- Tablet Drug
- Granule Drug
- Suspension Drug
- Others
Consumption by Region
- North America
- U.S.
- Canada
- Asia-Pacific
- China
- Japan
- South Korea
- Southeast Asia
- India
- Australia
- Europe
- Germany
- France
- U.K.
- Italy
- Russia
- Rest of Europe
- South America
- Mexico
- Brazil
- Rest of South America
Core Chapters
- Chapter 1: Introduces the report scope of the report, executive summary of different market segments (by region, product type, application, etc), including the market size of each market segment, future development potential, and so on. It offers a high-level view of the current state of the market and its likely evolution in the short to mid-term, and long term.
- Chapter 2: Detailed analysis of Paracetamol manufacturers competitive landscape, price, sales and revenue market share, latest development plan, merger, and acquisition information, etc.
- Chapter 3: Sales, revenue of Paracetamol in regional level and country level. It provides a quantitative analysis of the market size and development potential of each region and its main countries and introduces the market development, future development prospects, market space, and market size of each country in the world.
- Chapter 4: Provides the analysis of various market segments by Type, covering the market size and development potential of each market segment, to help readers find the blue ocean market in different market segments.
- Chapter 5: Provides the analysis of various market segments by Application, covering the market size and development potential of each market segment, to help readers find the blue ocean market in different downstream markets.
- Chapter 6: Provides profiles of key players, introducing the basic situation of the main companies in the market in detail, including product sales, revenue, price, gross margin, product introduction, recent development, etc.
- Chapter 7: Analysis of industrial chain, including the upstream and downstream of the industry.
- Chapter 8: Introduces the market dynamics, latest developments of the market, the driving factors and restrictive factors of the market, the challenges and risks faced by manufacturers in the industry, and the analysis of relevant policies in the industry.
- Chapter 9: The main points and conclusions of the report.
Table of Contents
1 Paracetamol Market Overview
- 1.1 Product Definition
- 1.2 Paracetamol by Type
- 1.2.1 Global Paracetamol Market Value Comparison by Type (2023-2029)
- 1.3 Paracetamol by Application
- 1.4 Global Paracetamol Market Size Estimates and Forecasts
- 1.4.1 Global Paracetamol Revenue 2018-2029
- 1.4.2 Global Paracetamol Sales 2018-2029
- 1.4.3 Global Paracetamol Market Average Price (2018-2029)
- 1.5 Assumptions and Limitations
2 Paracetamol Market Competition by Manufacturers
- 2.1 Global Paracetamol Sales Market Share by Manufacturers (2019-2022)
- 2.2 Global Paracetamol Revenue Market Share by Manufacturers (2019-2022)
- 2.3 Global Paracetamol Average Price by Manufacturers (2019-2022)
- 2.4 Global Key Players of Paracetamol, Industry Ranking, 2021 VS 2022
- 2.5 Global Key Manufacturers of Paracetamol, Headquarters and Area Served
- 2.6 Global Key Manufacturers of Paracetamol, Date of Enter into This Industry
- 2.7 Global Paracetamol Market Competitive Situation and Trends
- 2.7.1 Global Paracetamol Market Concentration Rate
- 2.7.2 The Global 5 and 10 Largest Paracetamol Players Market Share by Revenue
- 2.7.3 Global Paracetamol Market Share by Company Type (Tier 1, Tier 2, and Tier 3)
- 2.8 Manufacturers Mergers & Acquisitions, Expansion Plans
3 Global Paracetamol Market Scenario by Region
- 3.1 Global Paracetamol Market Size by Region: 2018 Versus 2022 Versus 2029
- 3.2 Global Paracetamol Sales by Region: 2018-2029
- 3.2.1 Global Paracetamol Sales by Region: 2018-2023
- 3.2.2 Global Paracetamol Sales by Region: 2024-2029
- 3.3 Global Paracetamol Revenue by Region: 2018-2029
- 3.3.1 Global Paracetamol Revenue by Region: 2018-2023
- 3.3.2 Global Paracetamol Revenue by Region: 2024-2029
- 3.4 North America Paracetamol Market Facts & Figures by Country
- 3.4.1 North America Paracetamol Market Size by Country: 2018 VS 2022 VS 2029
- 3.4.2 North America Paracetamol Sales by Country (2018-2029)
- 3.4.3 North America Paracetamol Revenue by Country (2018-2029)
- 3.4.4 United States
- 3.4.5 Canada
- 3.5 Europe Paracetamol Market Facts & Figures by Country
- 3.5.1 Europe Paracetamol Market Size by Country: 2018 VS 2022 VS 2029
- 3.5.2 Europe Paracetamol Sales by Country (2018-2029)
- 3.5.3 Europe Paracetamol Revenue by Country (2018-2029)
- 3.5.4 Germany
- 3.5.5 France
- 3.5.6 U.K.
- 3.5.7 Italy
- 3.5.8 Russia
- 3.6 Asia Pacific Paracetamol Market Facts & Figures by Region
- 3.6.1 Asia Pacific Paracetamol Market Size by Region: 2018 VS 2022 VS 2029
- 3.6.2 Asia Pacific Paracetamol Sales by Region (2018-2029)
- 3.6.3 Asia Pacific Paracetamol Revenue by Region (2018-2029)
- 3.6.4 China
- 3.6.5 Japan
- 3.6.6 South Korea
- 3.6.7 India
- 3.6.8 Southeast Asia
- 3.6.9 Australia
- 3.7 Latin America Paracetamol Market Facts & Figures by Country
- 3.7.1 Latin America Paracetamol Market Size by Country: 2018 VS 2022 VS 2029
- 3.7.2 Latin America Paracetamol Sales by Country (2018-2029)
- 3.7.3 Latin America Paracetamol Revenue by Country
- 3.7.4 Mexico
- 3.7.5 Brazil
- 3.7.6 Argentina
- 3.8 Middle East and Africa Paracetamol Market Facts & Figures by Country
- 3.8.1 Middle East and Africa Paracetamol Market Size by Country: 2018 VS 2022 VS 2029
- 3.8.2 Middle East and Africa Paracetamol Sales by Country (2018-2029)
- 3.8.3 Middle East and Africa Paracetamol Revenue by Country
- 3.8.4 Turkey
- 3.8.5 Egypt
- 3.8.6 Nigeria
4 Segment by Type
- 4.1 Global Paracetamol Sales by Type (2018-2029)
- 4.1.1 Global Paracetamol Sales by Type (2018-2023)
- 4.1.2 Global Paracetamol Sales by Type (2024-2029)
- 4.1.3 Global Paracetamol Sales Market Share by Type (2018-2029)
- 4.2 Global Paracetamol Revenue by Type (2018-2029)
- 4.2.1 Global Paracetamol Revenue by Type (2018-2023)
- 4.2.2 Global Paracetamol Revenue by Type (2024-2029)
- 4.2.3 Global Paracetamol Revenue Market Share by Type (2018-2029)
- 4.3 Global Paracetamol Price by Type (2018-2029)
5 Segment by Application
- 5.1 Global Paracetamol Sales by Application (2018-2029)
- 5.1.1 Global Paracetamol Sales by Application (2018-2023)
- 5.1.2 Global Paracetamol Sales by Application (2024-2029)
- 5.1.3 Global Paracetamol Sales Market Share by Application (2018-2029)
- 5.2 Global Paracetamol Revenue by Application (2018-2029)
- 5.2.1 Global Paracetamol Revenue by Application (2018-2023)
- 5.2.2 Global Paracetamol Revenue by Application (2024-2029)
- 5.2.3 Global Paracetamol Revenue Market Share by Application (2018-2029)
6 Key Companies Profiled
- 6.1 Mallinckrodt
- 6.1.1 Mallinckrodt Company Information
- 6.1.2 Mallinckrodt Description and Business Overview
- 6.1.3 Mallinckrodt Paracetamol Sales, Revenue and Gross Margin (2019-2022)
- 6.1.4 Mallinckrodt Paracetamol Product Portfolio
- 6.2 Anqiu Lu'an
- 6.2.1 Anqiu Lu'an Company Information
- 6.2.2 Anqiu Lu'an Description and Business Overview
- 6.2.3 Anqiu Lu'an Paracetamol Sales, Revenue and Gross Margin (2019-2022)
- 6.2.4 Anqiu Lu'an Paracetamol Product Portfolio
- 6.3 Hebei Jiheng
- 6.3.1 Hebei Jiheng Company Information
- 6.3.2 Hebei Jiheng Description and Business Overview
- 6.3.3 Hebei Jiheng Paracetamol Sales, Revenue and Gross Margin (2019-2022)
- 6.3.4 Hebei Jiheng Paracetamol Product Portfolio
- 6.4 Farmson
- 6.4.1 Farmson Company Information
- 6.4.2 Farmson Description and Business Overview
- 6.4.3 Farmson Paracetamol Sales, Revenue and Gross Margin (2019-2022)
- 6.4.4 Farmson Paracetamol Product Portfolio
- 6.5 Granules India
- 6.5.1 Granules India Company Information
- 6.5.2 Granules India Description and Business Overview
- 6.5.3 Granules India Paracetamol Sales, Revenue and Gross Margin (2019-2022)
- 6.5.4 Granules India Paracetamol Product Portfolio
- 6.6 Sri Krishna Pharma
- 6.6.1 Sri Krishna Pharma Company Information
- 6.6.2 Sri Krishna Pharma Description and Business Overview
- 6.6.3 Sri Krishna Pharma Paracetamol Sales, Revenue and Gross Margin (2019-2022)
- 6.6.4 Sri Krishna Pharma Paracetamol Product Portfolio
- 6.7 Zhejiang Kangle
- 6.7.1 Zhejiang Kangle Company Information
- 6.7.2 Zhejiang Kangle Description and Business Overview
- 6.7.3 Zhejiang Kangle Paracetamol Sales, Revenue and Gross Margin (2019-2022)
- 6.7.4 Zhejiang Kangle Paracetamol Product Portfolio
- 6.8 Anhui BBCA Likang
- 6.8.1 Anhui BBCA Likang Company Information
- 6.8.2 Anhui BBCA Likang Description and Business Overview
- 6.8.3 Anhui BBCA Likang Paracetamol Sales, Revenue and Gross Margin (2019-2022)
- 6.8.4 Anhui BBCA Likang Paracetamol Product Portfolio
- 6.9 Seqens
- 6.9.1 Seqens Company Information
- 6.9.2 Seqens Description and Business Overview
- 6.9.3 Seqens Paracetamol Sales, Revenue and Gross Margin (2019-2022)
- 6.9.4 Seqens Paracetamol Product Portfolio
- 6.10 Atabay
- 6.10.1 Atabay Company Information
- 6.10.2 Atabay Description and Business Overview
- 6.10.3 Atabay Paracetamol Sales, Revenue and Gross Margin (2019-2022)
- 6.10.4 Atabay Paracetamol Product Portfolio
- 6.11 Anhui Fubore
- 6.11.1 Anhui Fubore Company Information
- 6.11.2 Anhui Fubore Description and Business Overview
- 6.11.3 Anhui Fubore Paracetamol Sales, Revenue and Gross Margin (2019-2022)
- 6.11.4 Anhui Fubore Paracetamol Product Portfolio
7 Industry Chain and Sales Channels Analysis
- 7.1 Paracetamol Industry Chain Analysis
- 7.2 Paracetamol Production Process and Key Raw Materials
- 7.2.1 Paracetamol Production Mode & Process
- 7.2.2 Key Raw Materials
- 7.2.3 Raw Materials (Para-Aminophenol) Key Suppliers
- 7.3 Paracetamol Sales and Marketing
- 7.3.1 Acetaminophen Sales Channels
- 7.3.2 Paracetamol Distributors
- 7.4 Paracetamol Customers
8 Paracetamol Market Dynamics
- 8.1 Paracetamol Market Drivers
- 8.2 Covid-19 Impact Analysis
9 Research Findings and Conclusion
10 Methodology and Data Source
- 10.1 Methodology/Research Approach
- 10.1.1 Research Programs/Design
- 10.1.2 Market Size Estimation
- 10.1.3 Market Breakdown and Data Triangulation
- 10.2 Data Source
- 10.2.1 Secondary Sources
- 10.2.2 Primary Sources
- 10.3 Author List
- 10.4 Disclaimer