|
|
市場調査レポート
商品コード
1234344
vRAN (仮想無線アクセスネットワーク) の世界市場:分析・実績・予測 (2023年~2029年)Global Virtualized Radio Access Network (vRAN) Market Report, History and Forecast 2023-2029 |
||||||
|
|
|||||||
|
● お客様のご希望に応じて、既存データの加工や未掲載情報(例:国別セグメント)の追加などの対応が可能です。 詳細はお問い合わせください。 |
|||||||


| vRAN (仮想無線アクセスネットワーク) の世界市場:分析・実績・予測 (2023年~2029年) |
|
出版日: 2023年03月10日
発行: QYResearch
ページ情報: 英文 123 Pages
納期: 2~3営業日
|
- 全表示
- 概要
- 図表
- 目次
世界のvRAN (仮想無線アクセスネットワーク) の市場規模は、COVID-19パンデミックとロシア・ウクライナ戦争の影響により、2022年に19億2,197万米ドル、2029年には69億5,460万米ドルの改定規模に達すると予測され、予測期間中 (2023年~2029年) に20.16%のCAGRで成長する見通しです。
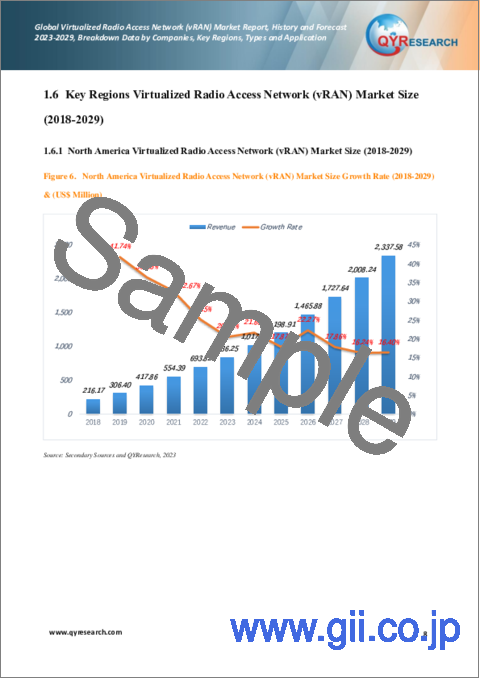
北米のvRANの市場規模は、2022年に6億9,382万米ドルに達し、予測期間中 (2023年~2029年) に20.16%のCAGRで成長し、2029年までに23億3,758万米ドルに達すると予測されています。
アジア太平洋のvRANの市場規模は、2022年に5億2,687万米ドルに達し、予測期間中 (2023年~2029年) に23.72%のCAGRで成長し、2029年までに23億3,472万米ドルに達すると予測されています。
欧州のvRANの市場規模は、2022年に6億4,478万米ドルに達し、予測期間中 (2023年~2029年) に18.00%のCAGRで成長し、2029年までに20億2,236万米ドルに達すると予測されています。
当レポートでは、世界のvRAN (仮想RAN (無線アクセスネットワーク)) の市場について分析し、種類別・用途別・地域別 (国別) の市場動向の見通し (2018年~2029年)、主要企業のプロファイルなどについて調査しております。
目次
第1章 vRAN (仮想無線アクセスネットワーク):市場概要
- vRAN:市場概要
- 市場規模の概要:地域別 (2018年・2022年・2029年)
- 市場規模:地域別 (2018年~2029年)
- 過去の市場規模:地域別 (2018年~2023年)
- 市場規模の予測:地域別 (2024年~2029年)
- 主要地域の市場規模 (2018年~2029年)
- 北米のvRANの市場規模 (2018年~2029年)
- 欧州のvRANの市場規模 (2018年~2029年)
- アジア太平洋のvRANの市場規模 (2018年~2029年)
- ラテンアメリカのvRANの市場規模 (2018年~2029年)
- 中東・アフリカのvRANの市場規模 (2018年~2029年)
第2章 vRAN市場の概要:種類別
- 市場規模の概要:種類別 (2018年・2022年・2029年)
- 過去の市場規模:種類別 (2018年~2023年)
- 市場規模の予測:種類別 (2024年~2029年)
- ソフトウェア
- プラットホーム
- サーバー
第3章 vRAN市場の概要:用途別
- 市場規模の概要:用途別 (2018年・2022年・2029年)
- 過去の市場規模:用途別 (2018年~2023年)
- 市場規模の予測:用途別 (2024年~2029年)
- 屋内用
- 屋外用
第4章 vRAN:企業別の競合分析
- 市場規模:企業別 (2018年~2023年)
- 世界の主要メーカー:企業の種類別 (ティア1、ティア2、ティア3) (収益別、2022年)
- 世界の主要vRANメーカーの本社・提供エリア
- 世界の主要vRANメーカーの製品
- 世界の主要vRANメーカーの設立時期
- 競合情勢
第5章 企業 (主要企業) のプロファイルと主要データ
- Samsung
- Nokia
- NEC
- Wind River
- Altiostar (Rakuten)
- Amdocs
- ASOCS
- Dell EMC
- Airspan
- Parallel Wireless
第6章 北米
- vRANの市場規模:国別 (2018年~2029年)
- 米国
- カナダ
第7章 欧州
- vRANの市場規模:国別 (2018年~2029年)
- ドイツ
- フランス
- 英国
- イタリア
- ロシア
第8章 アジア太平洋
- vRANの市場規模:地域別 (2018年~2029年)
- 中国
- 日本
- 韓国
- 東南アジア
- インド
- オーストラリア
第9章 ラテンアメリカ
- vRANの市場規模:国別 (2018年~2029年)
- メキシコ
- ブラジル
第10章 中東・アフリカ
- vRANの市場規模:国別
- 中東
- アフリカ
第11章 vRANの市場力学
- vRAN業界の動向
- vRAN市場の促進要因
- vRAN市場の課題
- vRAN市場の抑制要因
第12章 調査結果/結論
第13章 調査手法とデータソース
List of Tables
- Table 1. Global Market Virtualized Radio Access Network (vRAN) Market Size (US$ Million) Comparison by Region: 2018 VS 2022 VS 2029
- Table 2. Global Virtualized Radio Access Network (vRAN) Market Size by Region (2018-2023) & (US$ Million)
- Table 3. Global Virtualized Radio Access Network (vRAN) Market Size Share by Region (2018-2023)
- Table 4. Global Virtualized Radio Access Network (vRAN) Forecasted Market Size by Region (2024-2029) & (US$ Million)
- Table 5. Global Virtualized Radio Access Network (vRAN) Forecasted Market Size Share by Region (2024-2029)
- Table 6. Global Virtualized Radio Access Network (vRAN) Market Size (US$ Million) by Type: 2018 VS 2022 VS 2029
- Table 7. Global Virtualized Radio Access Network (vRAN) Market Size by Type (2018-2023) & (US$ Million)
- Table 8. Global Virtualized Radio Access Network (vRAN) Revenue Market Share by Type (2018-2023)
- Table 9. Global Virtualized Radio Access Network (vRAN) Forecasted Market Size by Type (2024-2029) & (US$ Million)
- Table 10. Global Virtualized Radio Access Network (vRAN) Revenue Market Share by Type (2024-2029)
- Table 11. Global Virtualized Radio Access Network (vRAN) Market Size by Application: (US$ Million) 2018 VS 2022 VS 2029
- Table 12. Global Virtualized Radio Access Network (vRAN) Market Size by Application (2018-2023) & (US$ Million)
- Table 13. Global Virtualized Radio Access Network (vRAN) Revenue Market Share by Application (2018-2023)
- Table 14. Global Virtualized Radio Access Network (vRAN) Forecasted Market Size by Application (2024-2029) & (US$ Million)
- Table 15. Global Virtualized Radio Access Network (vRAN) Revenue Market Share by Application (2024-2029)
- Table 16. Global Virtualized Radio Access Network (vRAN) Revenue by Players (2018-2023) & (US$ Million)
- Table 17. Global Virtualized Radio Access Network (vRAN) Revenue Market Share by Players (2018-2023)
- Table 18. Global Top Players Market Share by Company Type (Tier 1, Tier 2, and Tier 3) & (based on the Revenue in Virtualized Radio Access Network (vRAN) as of 2022)
- Table 19. Global Key Players of Virtualized Radio Access Network (vRAN), Headquarters and Area Served
- Table 20. Global Key Players of Virtualized Radio Access Network (vRAN), Product
- Table 21. Global Key Players of Virtualized Radio Access Network (vRAN) Established Date
- Table 22. Global Virtualized Radio Access Network (vRAN) Players Market Concentration Ratio (CR5)
- Table 23. Samsung Basic Information, Manufacturing Base, Sales Area and Its Competitors
- Table 24. Samsung Virtualized Radio Access Network (vRAN) Revenue (Million USD) and Gross Margin (%) (2018-2023)
- Table 25. Nokia Basic Information, Manufacturing Base, Sales Area and Its Competitors
- Table 26. Nokia Virtualized Radio Access Network (vRAN) Revenue (Million USD) and Gross Margin (%) (2018-2023)
- Table 27. NEC Basic Information, Manufacturing Base, Sales Area and Its Competitors
- Table 28. NEC Virtualized Radio Access Network (vRAN) Revenue (Million USD) and Gross Margin (%) (2018-2023)
- Table 29. Wind River Basic Information, Manufacturing Base, Sales Area and Its Competitors
- Table 30. Wind River Virtualized Radio Access Network (vRAN) Revenue (Million USD) and Gross Margin (%) (2018-2023)
- Table 31. Altiostar (Rakuten) Basic Information, Manufacturing Base, Sales Area and Its Competitors
- Table 32. Altiostar (Rakuten) Virtualized Radio Access Network (vRAN) Revenue (Million USD) and Gross Margin (%) (2018-2023)
- Table 33. Amdocs Basic Information, Manufacturing Base, Sales Area and Its Competitors
- Table 34. Amdocs Virtualized Radio Access Network (vRAN) Revenue (Million USD) and Gross Margin (%) (2018-2023)
- Table 35. ASOCS Basic Information, Manufacturing Base, Sales Area and Its Competitors
- Table 36. ASOCS Virtualized Radio Access Network (vRAN) Revenue (Million USD) and Gross Margin (%) (2018-2023)
- Table 37. Dell EMC Basic Information, Manufacturing Base, Sales Area and Its Competitors
- Table 38. Dell EMC Virtualized Radio Access Network (vRAN) Revenue (Million USD) and Gross Margin (%) (2018-2023)
- Table 39. Airspan Basic Information, Manufacturing Base, Sales Area and Its Competitors
- Table 40. Airspan Virtualized Radio Access Network (vRAN) Revenue (Million USD) and Gross Margin (%) (2018-2023)
- Table 41. Parallel Wireless Basic Information, Manufacturing Base, Sales Area and Its Competitors
- Table 42. Parallel Wireless Virtualized Radio Access Network (vRAN) Revenue (Million USD) and Gross Margin (%) (2018-2023)
- Table 43. North America Virtualized Radio Access Network (vRAN) Market Size Growth Rate (CAGR) by Country (US$ Million): 2018 VS 2022 VS 2029
- Table 44. North America Virtualized Radio Access Network (vRAN) Market Size by Country (2018-2023) & (US$ Million)
- Table 45. North America Virtualized Radio Access Network (vRAN) Market Size by Country (2024-2029) & (US$ Million)
- Table 46. North America Virtualized Radio Access Network (vRAN) Market Share by Country (2018-2023)
- Table 47. North America Virtualized Radio Access Network (vRAN) Market Share by Country (2024-2029)
- Table 48. Europe Virtualized Radio Access Network (vRAN) Market Size Growth Rate (CAGR) by Country (US$ Million): 2018 VS 2022 VS 2029
- Table 49. Europe Virtualized Radio Access Network (vRAN) Market Size by Country (2018-2023) & (US$ Million)
- Table 50. Europe Virtualized Radio Access Network (vRAN) Market Size by Country (2024-2029) & (US$ Million)
- Table 51. Europe Virtualized Radio Access Network (vRAN) Market Share by Country (2018-2023)
- Table 52. Europe Virtualized Radio Access Network (vRAN) Market Share by Country (2024-2029)
- Table 53. Asia-Pacific Virtualized Radio Access Network (vRAN) Market Size Growth Rate (CAGR) by Region (US$ Million): 2018 VS 2022 VS 2029
- Table 54. Asia-Pacific Virtualized Radio Access Network (vRAN) Market Size by Region (2018-2023) & (US$ Million)
- Table 55. Asia-Pacific Virtualized Radio Access Network (vRAN) Market Size by Region (2024-2029) & (US$ Million)
- Table 56. Asia-Pacific Virtualized Radio Access Network (vRAN) Market Share by Region (2018-2023)
- Table 57. Asia-Pacific Virtualized Radio Access Network (vRAN) Market Share by Region (2024-2029)
- Table 58. Latin America Virtualized Radio Access Network (vRAN) Market Size Growth Rate (CAGR) by Country (US$ Million): 2018 VS 2022 VS 2029
- Table 59. Latin America Virtualized Radio Access Network (vRAN) Market Size by Country (2018-2023) & (US$ Million)
- Table 60. Latin America Virtualized Radio Access Network (vRAN) Market Size by Country (2024-2029) & (US$ Million)
- Table 61. Latin America Virtualized Radio Access Network (vRAN) Market Share by Country (2018-2022)
- Table 62. Latin America Virtualized Radio Access Network (vRAN) Market Share by Country (2023-2029)
- Table 63. Middle East and Africa Virtualized Radio Access Network (vRAN) Market Size Growth Rate (CAGR) by Country (US$ Million): 2018 VS 2022 VS 2029
- Table 64. Middle East & Africa Virtualized Radio Access Network (vRAN) Market Size by Country (2018-2023) & (US$ Million)
- Table 65. Middle East & Africa Virtualized Radio Access Network (vRAN) Market Size by Country (2024-2029) & (US$ Million)
- Table 66. Middle East & Africa Virtualized Radio Access Network (vRAN) Market Share by Country (2018-2022)
- Table 67. Middle East & Africa Virtualized Radio Access Network (vRAN) Market Share by Country (2023-2029)
- Table 68. Virtualized Radio Access Network (vRAN) Market Trends
- Table 69. Virtualized Radio Access Network (vRAN) Market Drivers
- Table 70. Virtualized Radio Access Network (vRAN) Market Challenges
- Table 71. Virtualized Radio Access Network (vRAN) Market Restraints
- Table 72. Research Programs/Design for This Report
- Table 73. Key Data Information from Secondary Sources
- Table 74. Key Data Information from Primary Sources
- Table 75. QYR Business Unit and Senior & Team Lead Analysts
List of Figures
- Figure 1. Virtualized Radio Access Network (vRAN) Product Picture
- Figure 2. Global Virtualized Radio Access Network (vRAN) Market Size Year-over-Year (2018-2029) & (US$ Million)
- Figure 3. Global Virtualized Radio Access Network (vRAN) Market Size, (US$ Million), 2018 VS 2022 VS 2029
- Figure 4. Global Virtualized Radio Access Network (vRAN) Market Share by Region: 2022 VS 2029
- Figure 5. Global Virtualized Radio Access Network (vRAN) Forecasted Market Size Share by Region (2018-2029)
- Figure 6. North America Virtualized Radio Access Network (vRAN) Market Size Growth Rate (2018-2029) & (US$ Million)
- Figure 7. Europe Virtualized Radio Access Network (vRAN) Market Size Growth Rate (2018-2029) & (US$ Million)
- Figure 8. Asia-Pacific Virtualized Radio Access Network (vRAN) Market Size Growth Rate (2018-2029) & (US$ Million)
- Figure 9. Latin America Virtualized Radio Access Network (vRAN) Market Size Growth Rate (2019-2029) & (US$ Million)
- Figure 10. Middle East & Africa Virtualized Radio Access Network (vRAN) Market Size Growth Rate (2019-2029) & (US$ Million)
- Figure 11. Global Virtualized Radio Access Network (vRAN) Market Size Share by Type: 2022 & 2029
- Figure 12. Software Market Size (US$ Million) & YoY Growth (2018-2029)
- Figure 13. Platform Market Size (US$ Million) & YoY Growth (2018-2029)
- Figure 14. Servers Market Size (US$ Million) & YoY Growth (2018-2029)
- Figure 15. Global Virtualized Radio Access Network (vRAN) Market Size Share by Application: 2022 & 2029
- Figure 16. Indoor Market Size (US$ Million) & YoY Growth (2018-2029)
- Figure 17. Outdoor Market Size (US$ Million) & YoY Growth (2018-2029)
- Figure 18. Virtualized Radio Access Network (vRAN) Market Share by Company Type (Tier 1, Tier 2, and Tier 3): 2022
- Figure 19. The Top 10 and Top 5 Players Market Share by Virtualized Radio Access Network (vRAN) Sales in 2022
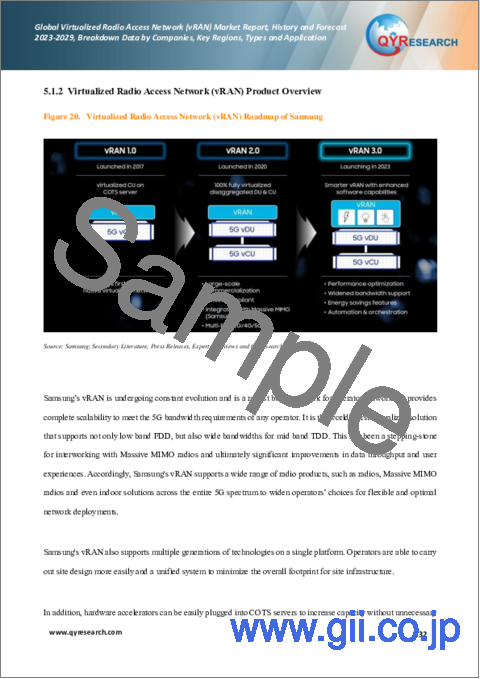
- Figure 20. Virtualized Radio Access Network (vRAN) Roadmap of Samsung
- Figure 21. Virtualized Radio Access Network (vRAN) Product Picture Examples of Dell EMC
- Figure 22. Virtualized Radio Access Network (vRAN) Product Specification Examples of Dell EMC
- Figure 23. North America Virtualized Radio Access Network (vRAN) Market Share by Country (2018-2029)
- Figure 24. United States Virtualized Radio Access Network (vRAN) Market Size (2018-2029) & (US$ Million)
- Figure 25. Canada Virtualized Radio Access Network (vRAN) Market Size (2018-2029) & (US$ Million)
- Figure 26. Europe Virtualized Radio Access Network (vRAN) Market Share by Region (2018-2029)
- Figure 27. Germany Virtualized Radio Access Network (vRAN) Market Size (2018-2029) & (US$ Million)
- Figure 28. France Virtualized Radio Access Network (vRAN) Market Size (2018-2029) & (US$ Million)
- Figure 29. U.K. Virtualized Radio Access Network (vRAN) Market Size (2018-2029) & (US$ Million)
- Figure 30. Italy Virtualized Radio Access Network (vRAN) Market Size (2018-2029) & (US$ Million)
- Figure 31. Russia Virtualized Radio Access Network (vRAN) Market Size (2018-2029) & (US$ Million)
- Figure 32. Asia-Pacific Virtualized Radio Access Network (vRAN) Market Share by Region (2018-2029)
- Figure 33. China Virtualized Radio Access Network (vRAN) Market Size (2018-2029) & (US$ Million)
- Figure 34. Japan Virtualized Radio Access Network (vRAN) Market Size (2018-2029) & (US$ Million)
- Figure 35. South Korea Virtualized Radio Access Network (vRAN) Market Size (2018-2029) & (US$ Million)
- Figure 36. Southeast Asia Virtualized Radio Access Network (vRAN) Market Size (2018-2029) & (US$ Million)
- Figure 37. India Virtualized Radio Access Network (vRAN) Market Size (2018-2029) & (US$ Million)
- Figure 38. Australia Virtualized Radio Access Network (vRAN) Market Size (2018-2029) & (US$ Million)
- Figure 39. Latin America Virtualized Radio Access Network (vRAN) Market Share by Country (2019-2029)
- Figure 40. Mexico Virtualized Radio Access Network (vRAN) Market Size (2019-2029) & (US$ Million)
- Figure 41. Brazil Virtualized Radio Access Network (vRAN) Market Size (2019-2029) & (US$ Million)
- Figure 42. Middle East & Africa Virtualized Radio Access Network (vRAN) Market Share by Country (2018-2029)
- Figure 43. Middle East Virtualized Radio Access Network (vRAN) Market Size (2019-2029) & (US$ Million)
- Figure 44. Africa Virtualized Radio Access Network (vRAN) Market Size (2019-2029) & (US$ Million)
- Figure 45. Bottom-up and Top-down Approaches for This Report
- Figure 46. Data Triangulation
Due to the COVID-19 pandemic and Russia-Ukraine War Influence, the global market for Virtualized Radio Access Network (vRAN) estimated was at US$ 1,921.97 million in the year 2022, is projected to reach a revised size of US$ 6,954.60 million by 2029, growing at a CAGR of 20.16% during the forecast period 2023-2029.
North American market for Virtualized Radio Access Network (vRAN) was valued at $ 693.82 million in 2022 and will reach $ 2,337.58 million by 2029, at a CAGR of 20.16% during the forecast period of 2023 through 2029.
Asia-Pacific market for Virtualized Radio Access Network (vRAN) was valued at $ 526.87 million in 2022 and will reach $ 2,334.72 million by 2029, at a CAGR of 23.72% during the forecast period of 2023 through 2029.
Europe market for Virtualized Radio Access Network (vRAN) was valued at $ 644.78 million in 2022 and will reach $ 2,022.36 million by 2029, at a CAGR of 18.00% during the forecast period of 2023 through 2029.
Report Scope
This report aims to provide a comprehensive presentation of the global market for Virtualized Radio Access Network (vRAN), with both quantitative and qualitative analysis, to help readers develop business/growth strategies, assess the market competitive situation, analyze their position in the current marketplace, and make informed business decisions regarding Virtualized Radio Access Network (vRAN).
The Virtualized Radio Access Network (vRAN) market size, estimations, and forecasts are provided in terms of revenue ($ millions), considering 2021 as the base year, with history and forecast data for the period from 2018 to 2029. This report segments the global Virtualized Radio Access Network (vRAN) market comprehensively. Regional market sizes, concerning products by Type, by Application, and by players, are also provided. The influence of COVID-19 and the Russia-Ukraine War were considered while estimating market sizes.
For a more in-depth understanding of the market, the report provides profiles of the competitive landscape, key competitors, and their respective market ranks. The report also discusses technological trends and new product developments.
This report will help the readers to understand the competition within the industries and strategies for the competitive environment to enhance the potential profit. The report also focuses on the competitive landscape of the global Virtualized Radio Access Network (vRAN) market, and introduces in detail the market share, industry ranking, competitor ecosystem, market performance, new product development, operation situation, expansion, and acquisition. etc. of the main players, which helps the readers to identify the main competitors and deeply understand the competition pattern of the market.
Market Segmentation
This report covers the Virtualized Radio Access Network (vRAN) segments by company, by Type, by Application, by region and country, and provides market size and CAGR for the history and forecast period (2018-2023, 2024-2029), considering 2022 as the base year. It elucidates potential revenue opportunities across different segments and explains attractive investment proposition matrices for this market.
By Company
- Samsung
- Nokia
- NEC
- Wind River
- Altiostar (Rakuten)
- Amdocs
- ASOCS
- Dell EMC
- Airspan
- Parallel Wireless
Segment by Type
- Software
- Platform
- Servers
Segment by Application
- Indoor Base Station
- Outdoor Base Station
By Region
- North America
- United States
- Canada
- Asia-Pacific
- China
- Japan
- South Korea
- Southeast Asia
- India
- Australia
- Europe
- Germany
- France
- U.K.
- Italy
- Russia
- Latin America
- Mexico
- Brazil
- Middle East & Africa
Core Chapters
- Chapter One: Introduces the report scope of the report, executive summary of global and regional market size and CAGR for the history and forecast period (2018-2023, 2024-2029). It offers a high-level view of the current state of the market and its likely evolution in the short to mid-term, and long term.
- Chapter Two: Provides the analysis of various market segments by Type, covering the market size and development potential of each market segment, to help readers find the blue ocean market in different market segments.
- Chapter Three: Provides the analysis of various market segments by Application, covering the market size and development potential of each market segment, to help readers find the blue ocean market in different downstream markets.
- Chapter Four: Detailed analysis of Virtualized Radio Access Network (vRAN) companies' competitive landscape, revenue, market share and ranking, latest development plan, merger, and acquisition information, etc.
- Chapter Five: Provides profiles of key players, introducing the basic situation of the main companies in the market in detail, including product introduction, revenue, recent development, etc.
- Chapter Six, Seven, Eight, Nine and Ten: North America, Europe, Asia Pacific, Latin America, Middle East & Africa, revenue by country.
- Chapter Eleven: this section also introduces the market dynamics, latest developments of the market, the driving factors and restrictive factors of the market, the challenges and risks faced by companies in the industry, and the analysis of relevant policies in the industry.
- Chapter Twelve: Research Finding/Conclusion
Table of Contents
1 Market Overview of Virtualized Radio Access Network (vRAN)
- 1.1 Virtualized Radio Access Network (vRAN) Market Overview
- 1.1.1 Virtualized Radio Access Network (vRAN) Product Scope
- 1.1.2 Virtualized Radio Access Network (vRAN) Market Status and Outlook
- 1.2 Global Virtualized Radio Access Network (vRAN) Market Size Overview by Region 2018 VS 2022 VS 2029
- 1.3 Global Virtualized Radio Access Network (vRAN) Market Size by Region (2018-2029)
- 1.4 Global Virtualized Radio Access Network (vRAN) Historic Market Size by Region (2018-2023)
- 1.5 Global Virtualized Radio Access Network (vRAN) Market Size Forecast by Region (2024-2029)
- 1.6 Key Regions Virtualized Radio Access Network (vRAN) Market Size (2018-2029)
- 1.6.1 North America Virtualized Radio Access Network (vRAN) Market Size (2018-2029)
- 1.6.2 Europe Virtualized Radio Access Network (vRAN) Market Size (2018-2029)
- 1.6.3 Asia-Pacific Virtualized Radio Access Network (vRAN) Market Size (2018-2029)
- 1.6.4 Latin America Virtualized Radio Access Network (vRAN) Market Size (2019-2029)
- 1.6.5 Middle East & Africa Virtualized Radio Access Network (vRAN) Market Size (2019-2029)
2 Virtualized Radio Access Network (vRAN) Market Overview by Type
- 2.1 Global Virtualized Radio Access Network (vRAN) Market Size by Type: 2018 VS 2022 VS 2029
- 2.2 Global Virtualized Radio Access Network (vRAN) Historic Market Size by Type (2018-2023)
- 2.3 Global Virtualized Radio Access Network (vRAN) Forecasted Market Size by Type (2024-2029)
- 2.4 Software
- 2.5 Platform
- 2.6 Servers
3 Virtualized Radio Access Network (vRAN) Market Overview by Application
- 3.1 Global Virtualized Radio Access Network (vRAN) Market Size by Application: 2018 VS 2022 VS 2029
- 3.2 Global Virtualized Radio Access Network (vRAN) Historic Market Size by Application (2018-2023)
- 3.3 Global Virtualized Radio Access Network (vRAN) Forecasted Market Size by Application (2024-2029)
- 3.4 Indoor
- 3.5 Outdoor
4 Virtualized Radio Access Network (vRAN) Competition Analysis by Players
- 4.1 Global Virtualized Radio Access Network (vRAN) Market Size by Players (2018-2023)
- 4.2 Global Top Players by Company Type (Tier 1, Tier 2, and Tier 3) & (based on the Revenue in Virtualized Radio Access Network (vRAN) as of 2022)
- 4.3 Global Key Players of Virtualized Radio Access Network (vRAN) Head office and Area Served
- 4.4 Global Key Players of Virtualized Radio Access Network (vRAN), Product
- 4.5 Global Key Players of Virtualized Radio Access Network (vRAN) Established Date
- 4.6 Competitive Status
- 4.6.1 Virtualized Radio Access Network (vRAN) Market Concentration Rate
- 4.6.2 Mergers & Acquisitions, Expansion Plans
5 Company (Top Players) Profiles
- 5.1 Samsung
- 5.1.1 Company Basic Information, Manufacturing Base, Sales Area and Its Competitors
- 5.1.2 Virtualized Radio Access Network (vRAN) Product Overview
- 5.1.3 Samsung Virtualized Radio Access Network (vRAN) Revenue (Million USD) and Gross Margin (%) (2018-2023)
- 5.1.4 Main Business/Business Overview
- 5.1.5 Samsung Recent Developments
- 5.2 Nokia
- 5.2.1 Company Basic Information, Manufacturing Base, Sales Area and Its Competitors
- 5.2.2 Virtualized Radio Access Network (vRAN) Product Overview
- 5.2.3 Nokia Virtualized Radio Access Network (vRAN) Revenue (Million USD) and Gross Margin (%) (2018-2023)
- 5.2.4 Main Business/Business Overview
- 5.2.5 Nokia Recent Developments
- 5.3 NEC
- 5.3.1 Company Basic Information, Manufacturing Base, Sales Area and Its Competitors
- 5.3.2 Virtualized Radio Access Network (vRAN) Product Overview
- 5.3.3 NEC Virtualized Radio Access Network (vRAN) Revenue (Million USD) and Gross Margin (%) (2018-2023)
- 5.3.4 Main Business/Business Overview
- 5.3.5 NEC Recent Developments
- 5.4 Wind River
- 5.4.1 Company Basic Information, Manufacturing Base, Sales Area and Its Competitors
- 5.4.2 Virtualized Radio Access Network (vRAN) Product Overview
- 5.4.3 Wind River Virtualized Radio Access Network (vRAN) Revenue (Million USD) and Gross Margin (%) (2018-2023)
- 5.4.4 Main Business/Business Overview
- 5.4.5 Wind River Recent Developments
- 5.5 Altiostar (Rakuten)
- 5.5.1 Company Basic Information, Manufacturing Base, Sales Area and Its Competitors
- 5.5.2 Virtualized Radio Access Network (vRAN) Product Overview
- 5.5.3 Altiostar (Rakuten) Virtualized Radio Access Network (vRAN) Revenue (Million USD) and Gross Margin (%) (2018-2023)
- 5.5.4 Main Business/Business Overview
- 5.5.5 Altiostar (Rakuten) Recent Developments
- 5.6 Amdocs
- 5.6.1 Company Basic Information, Manufacturing Base, Sales Area and Its Competitors
- 5.6.2 Virtualized Radio Access Network (vRAN) Product Overview
- 5.6.3 Amdocs Virtualized Radio Access Network (vRAN) Revenue (Million USD) and Gross Margin (%) (2018-2023)
- 5.6.4 Main Business/Business Overview
- 5.6.5 Amdocs Recent Developments
- 5.7 ASOCS
- 5.7.1 Company Basic Information, Manufacturing Base, Sales Area and Its Competitors
- 5.7.2 Virtualized Radio Access Network (vRAN) Product Overview
- 5.7.3 ASOCS Virtualized Radio Access Network (vRAN) Revenue (Million USD) and Gross Margin (%) (2018-2023)
- 5.7.4 Main Business/Business Overview
- 5.7.5 ASOCS Recent Developments
- 5.8 Dell EMC
- 5.8.1 Company Basic Information, Manufacturing Base, Sales Area and Its Competitors
- 5.8.2 Virtualized Radio Access Network (vRAN) Product Overview
- 5.8.3 Dell EMC Virtualized Radio Access Network (vRAN) Revenue (Million USD) and Gross Margin (%) (2018-2023)
- 5.8.4 Main Business/Business Overview
- 5.8.5 Dell EMC Recent Developments
- 5.9 Airspan
- 5.9.1 Company Basic Information, Manufacturing Base, Sales Area and Its Competitors
- 5.9.2 Virtualized Radio Access Network (vRAN) Product Overview
- 5.9.3 Airspan Virtualized Radio Access Network (vRAN) Revenue (Million USD) and Gross Margin (%) (2018-2023)
- 5.9.4 Main Business/Business Overview
- 5.9.5 Airspan Recent Developments
- 5.10 Parallel Wireless
- 5.10.1 Company Basic Information, Manufacturing Base, Sales Area and Its Competitors
- 5.10.2 Virtualized Radio Access Network (vRAN) Product Overview
- 5.10.3 Parallel Wireless Virtualized Radio Access Network (vRAN) Revenue (Million USD) and Gross Margin (%) (2018-2023)
- 5.10.4 Main Business/Business Overview
- 5.10.5 Parallel Wireless Recent Developments
6 North America
- 6.1 North America Virtualized Radio Access Network (vRAN) Market Size by Country (2018-2029)
- 6.2 United States
- 6.3 Canada
7 Europe
- 7.1 Europe Virtualized Radio Access Network (vRAN) Market Size by Country (2018-2029)
- 7.2 Germany
- 7.3 France
- 7.4 U.K.
- 7.5 Italy
- 7.6 Russia
8 Asia-Pacific
- 8.1 Asia-Pacific Virtualized Radio Access Network (vRAN) Market Size by Region (2018-2029)
- 8.2 China
- 8.3 Japan
- 8.4 South Korea
- 8.5 Southeast Asia
- 8.6 India
- 8.7 Australia
9 Latin America
- 9.1 Latin America Virtualized Radio Access Network (vRAN) Market Size by Country (2018-2029)
- 9.2 Mexico
- 9.3 Brazil
10 Middle East & Africa
- 10.1 Middle East & Africa Virtualized Radio Access Network (vRAN) Market Size by Country
- 10.2 Middle East
- 10.3 Africa
11 Virtualized Radio Access Network (vRAN) Market Dynamics
- 11.1 Virtualized Radio Access Network (vRAN) Industry Trends
- 11.2 Virtualized Radio Access Network (vRAN) Market Drivers
- 11.3 Virtualized Radio Access Network (vRAN) Market Challenges
- 11.4 Virtualized Radio Access Network (vRAN) Market Restraints
12 Research Finding/Conclusion
13 Methodology and Data Source
- 13.1 Methodology/Research Approach
- 13.1.1 Research Programs/Design
- 13.1.2 Market Size Estimation
- 13.1.3 Market Breakdown and Data Triangulation
- 13.2 Data Source
- 13.2.1 Secondary Sources
- 13.2.2 Primary Sources
- 13.3 Author List
- 13.4 Disclaimer