|
|
市場調査レポート
商品コード
1206253
電動スリップリングの世界市場の分析 (2023年)Global Electrical Slip Rings Market Research Report 2023 |
||||||
|
|
|||||||
|
● お客様のご希望に応じて、既存データの加工や未掲載情報(例:国別セグメント)の追加などの対応が可能です。 詳細はお問い合わせください。 |
|||||||


| 電動スリップリングの世界市場の分析 (2023年) |
|
出版日: 2023年01月30日
発行: QYResearch
ページ情報: 英文 189 Pages
納期: 2~3営業日
|
- 全表示
- 概要
- 図表
- 目次
世界の電動スリップリングの市場規模は、COVID-19の大流行により、2022年に8億7,593万米ドル、2029年までに11億9,637万米ドルの再調整規模に達する見通しです。
また、予測期間中 (2023年~2029年) に4.27%のCAGRで成長する、と予測されています。この健康危機による経済変化を十分に考慮し、2022年に世界市場の35.54%を占める中型カプセルは、2023年から2029年まで改訂4.7%のCAGRで成長し、2029年までに4億3,958万米ドルに達すると予測されています。一方、産業・商業分野は、この予測期間を通して4.28%のCAGRに変更されています。
2022年に、北米の電動スリップリングの市場規模は2億3,046万米ドル、欧州は2億9,007万米ドルとなっています。2022年の北米の割合は26.31%、欧州の割合は33.12%であり、欧州の市場シェアは2029年に32.75%に達し、分析期間を通じて4.13%のCAGRで推移すると予測されています。アジア太平洋地域については、中国とインドが注目すべき市場であり、今後6年間のCAGRはそれぞれ6.82%と6.21%です。
当レポートでは、世界の電動スリップリングの市場について分析し、種類別・用途別・地域別 (国別) の市場動向の見通し (2018年~2029年)、主要企業のプロファイルなどについて調査しております。
目次
第1章 電動スリップリング:市場概要
- 電動スリップリング:製品の概要と範囲
- 種類別のセグメント
- 市場規模・成長率の分析:種類別 (2023年・2029年)
- 小型カプセル
- 中型カプセル
- 密閉型パワースルーボア
- 密閉型シグナルスルーボア
- その他
- 用途別のセグメント
- 市場規模・成長率の分析:用途別 (2023年・2029年)
- 工業用・商業用
- 防衛・航空宇宙
- 試験装置
- 風力タービン
- 動画・光学システム
- レーダー
- その他
- 世界市場の成長見通し
- 世界の電動スリップリングの収益:推定・予測 (2018年~2029年)
- 世界の電動スリップリングの生産:推定・予測 (2018年~2029年)
- 地域別の市場規模
- 世界の電動スリップリングの市場規模:推定・予測、地域別 (2018年・2023年・2029年)
- 北米:推定・予測 (2018年~2029年)
- 欧州:推定・予測 (2018年~2029年)
- 中国:推定・予測 (2018年~2029年)
- 日本:推定・予測 (2018年~2029年)
- 韓国:推定・予測 (2018年~2029年)
第2章 メーカー別の市場競争
- 世界の電動スリップリングの生産:メーカー別 (2018年~2023年)
- 世界の電動スリップリングの収益・市場シェア:メーカー別 (2018年~2023年)
- 市場シェア:企業の種類別 (ティア1、ティア2、ティア3)
- 世界の電動スリップリングの平均価格:メーカー別 (2018年~2023年)
- 電動スリップリングメーカーの本社・設立時期
- 電動スリップリング市場の競争状況と動向
第3章 地域別の生産
- 世界の電動スリップリングの生産:地域別 (2018年~2023年)
- 世界の電動スリップリングの収益・市場シェア:地域別 (2018年~2023年)
- 世界の電動スリップリングの生産・収益・価格・粗利益 (2018年~2023年)
- 北米の電動スリップリングの生産
- 欧州の電動スリップリングの生産
- 中国の電動スリップリングの生産 (2018年~2023年)
- 日本の電動スリップリングの生産 (2018年~2023年)
- 韓国の電動スリップリングの生産 (2018年~2023年)
第4章 電動スリップリング:地域別の消費
- 世界の電動スリップリングの消費:地域別
- 消費:地域別
- 消費・市場シェア:地域別
- 北米
- 米国
- カナダ
- メキシコ
- 欧州
- ドイツ
- フランス
- 英国
- イタリア
- ロシア
- アジア太平洋
- 中国
- 日本
- 韓国
- 台湾
- 東南アジア
- インド
- オーストラリア
- 南米
- ブラジル
第5章 種類別のセグメント
- 電動スリップリングの生産・市場シェア:種類別 (2018年~2023年)
- 電動スリップリングの収益・市場シェア:種類別 (2018年~2023年)
- 電動スリップリングの価格:種類別 (2018年~2023年)
第6章 用途別のセグメント
- 電動スリップリングの生産・市場シェア:用途別 (2018年~2023年)
- 電動スリップリングの収益・市場シェア:用途別 (2018年~2023年)
- 電動スリップリングの価格:用途別 (2018年~2023年)
第7章 主要企業のプロファイル
- Moog
- 企業情報
- 製品ポートフォリオ
- 生産・収益・価格・粗利益 (2018年~2023年)
- 昨今の動向
- Schleifring
- Morgan
- Everaxis (Cobham)
- Mersen
- Stemmann
- LTN
- RUAG
- DSTI
- Cavotec SA
- Pandect Precision
- NSD Corporation
- Mercotac
- UEA
- BGB
- Conductix-Wampfler
- Molex
- Ravioli
- Rotac
- Michigan
- Hangzhou Prosper
- Moflon
- Jinpat Electronics
- Pan-link Technology
- Foxtac Electric
- SenRing Electronics
- TrueSci Fine Works
- Jarch
第8章 電動スリップリングの製造コストの分析
- 電動スリップリングの主要原材料の分析
- 製造コストの構造比率
- 電動スリップリングの製造プロセスの分析
- 電動スリップリングの産業チェーンの分析
第9章 マーケティングチャネル・流通業者・顧客
- マーケティングチャネル
- 電動スリップリングの流通業者の一覧
- 電動スリップリングの顧客
第10章 電動スリップリング市場:市場力学
- 電動スリップリング業界の動向
- 電動スリップリング市場の促進要因
- 電動スリップリング市場の課題
- ポーターのファイブフォース分析
第11章 生産・供給予測
- 世界の電動スリップリングの生産予測:地域別 (2024年~2029年)
- 北米:生産・収益予測 (2024年~2029年)
- 欧州:生産・収益予測 (2024年~2029年)
- 中国:生産・収益予測 (2024年~2029年)
- 日本:生産・収益予測 (2024年~2029年)
- 韓国:生産・収益予測 (2024年~2029年)
第12章 消費・需要予測
- 世界の電動スリップリングの予測・需要分析
- 北米:消費予測、国別
- 欧州:消費予測、国別
- アジア太平洋:消費予測、地域別
- 南米:消費予測、国別
第13章 種類別・用途別の予測
- 世界の生産・収益・価格予測:種類別 (2024年~2029年)
- 世界の生産・収益・価格予測:用途別 (2024年~2029年)
第14章 調査結果と結論
第15章 調査手法とデータソース
List of Tables
- Table 1. Global Electrical Slip Rings Market Size by Type (K Units) & (US$ Million) & (2023 VS 2029)
- Table 2. Global Electrical Slip Rings Market Size by Application (K Units) & (US$ Million) & (2023 VS 2029)
- Table 3. Electrical Slip Rings Market Size (US$ Million) Comparison by Region: 2018 VS 2023 VS 2029
- Table 4. Global Electrical Slip Rings Production by Manufacturers (2018-2023) & (K Units)
- Table 5. Global Electrical Slip Rings Production Market Share by Manufacturers (2018-2023)
- Table 6. Global Electrical Slip Rings Revenue by Manufacturers (2018-2023) & (US$ Million)
- Table 7. Global Electrical Slip Rings Revenue Share by Manufacturers (2018-2023)
- Table 8. Company Type (Tier 1, Tier 2, and Tier 3) & (based on the Revenue in Electrical Slip Rings as of 2022)
- Table 9. Global Market Electrical Slip Rings Average Price (US$/Unit) of Key Manufacturers (2018-2023)
- Table 10. Manufacturers Electrical Slip Rings Headquarter and Founded Time
- Table 11. Global Electrical Slip Rings Manufacturers Market Concentration Ratio (CR5)
- Table 12. Mergers & Acquisitions, Expansion Plans
- Table 13. Global Electrical Slip Rings Production (K Units) by Region (2018-2023)
- Table 14. Global Electrical Slip Rings Revenue (US$ Million) by Region (2018-2023)
- Table 15. Global Electrical Slip Rings Revenue Market Share by Region (2018-2023)
- Table 16. Global Electrical Slip Rings Production (K Units), Revenue (US$ Million), Price (US$/Unit) and Gross Margin (2018-2023)
- Table 17. North America Electrical Slip Rings Production (K Units), Revenue (US$ Million), Price (US$/Unit) and Gross Margin (2018-2023)
- Table 18. Europe Electrical Slip Rings Production (K Units), Revenue (US$ Million), Price (US$/Unit) and Gross Margin (2018-2023)
- Table 19. China Electrical Slip Rings Production (K Units), Revenue (US$ Million), Price (US$/Unit) and Gross Margin (2018-2023)
- Table 20. Japan Electrical Slip Rings Production (K Units), Revenue (US$ Million), Price (US$/Unit) and Gross Margin (2018-2023)
- Table 21. South Korea Electrical Slip Rings Production (K Units), Revenue (US$ Million), Price (US$/Unit) and Gross Margin (2018-2023)
- Table 22. Global Electrical Slip Rings Consumption by Region (2018-2023) & (K Units)
- Table 23. Global Electrical Slip Rings Consumption Market Share by Region (2018-2023)
- Table 24. North America Electrical Slip Rings Consumption by Country (2018-2023) & (K Units)
- Table 25. Europe Electrical Slip Rings Consumption by Country (2018-2023) & (K Units)
- Table 26. Asia Pacific Electrical Slip Rings Consumption by Region (2018-2023) & (K Units)
- Table 27. South America Electrical Slip Rings Consumption by Country (2018-2023) & (K Units)
- Table 28. Global Electrical Slip Rings Production (K Units) by Type (2018-2023)
- Table 29. Global Electrical Slip Rings Production Market Share by Type (2018-2023)
- Table 30. Global Electrical Slip Rings Revenue (US$ Million) by Type (2018-2023)
- Table 31. Global Electrical Slip Rings Revenue Share by Type (2018-2023)
- Table 32. Global Electrical Slip Rings Price (US$/Unit) by Type (2018-2023)
- Table 33. Global Electrical Slip Rings Production (K Units) by Application (2018-2023)
- Table 34. Global Electrical Slip Rings Production Market Share by Application (2018-2023)
- Table 35. Global Electrical Slip Rings Revenue (US$ Million) by Application (2018-2023)
- Table 36. Global Electrical Slip Rings Revenue Share by Application (2018-2023)
- Table 37. Global Electrical Slip Rings Price (US$/Unit) by Application (2018-2023)
- Table 38. Profile of Moog
- Table 39. Electrical Slip Rings Product Picture and Specifications of Moog
- Table 40. Electrical Slip Rings Production (K Units), Revenue (US$ Million), Price (US$/Unit) and Gross Margin of Moog (2018-2023)
- Table 41. Recent Developments/Updates
- Table 42. Profile of Schleifring
- Table 43. Electrical Slip Rings Product Picture and Specifications of Schleifring
- Table 44. Electrical Slip Rings Production (K Units), Revenue (US$ Million), Price (US$/Unit) and Gross Margin of Schleifring (2018-2023)
- Table 45. Recent Developments/Updates
- Table 46. Profile of Morgan
- Table 47. Electrical Slip Rings Product Picture and Specifications of Morgan
- Table 48. Electrical Slip Rings Production (K Units), Revenue (US$ Million), Price (US$/Unit) and Gross Margin of Morgan (2018-2023)
- Table 49. Recent Developments/Updates
- Table 50. Profile of Everaxis (Cobham)
- Table 51. Electrical Slip Rings Product Picture and Specifications of Everaxis (Cobham)
- Table 52. Electrical Slip Rings Production (K Units), Revenue (US$ Million), Price (US$/Unit) and Gross Margin of Everaxis (Cobham) (2018-2023)
- Table 53. Recent Developments/Updates
- Table 54. Profile of Mersen
- Table 55. Electrical Slip Rings Product Picture and Specifications of Mersen
- Table 56. Electrical Slip Rings Production (K Units), Revenue (US$ Million), Price (US$/Unit) and Gross Margin of Mersen (2018-2023)
- Table 57. Recent Developments/Updates
- Table 58. Profile of Stemmann
- Table 59. Electrical Slip Rings Product Picture and Specifications of Stemmann
- Table 60. Electrical Slip Rings Production (K Units), Revenue (US$ Million), Price (US$/Unit) and Gross Margin of Stemmann (2018-2023)
- Table 61. Recent Developments/Updates
- Table 62. Profile of LTN
- Table 63. Electrical Slip Rings Product Picture and Specifications of LTN
- Table 64. Electrical Slip Rings Production (K Units), Revenue (US$ Million), Price (US$/Unit) and Gross Margin of LTN (2018-2023)
- Table 65. Recent Developments/Updates
- Table 66. Profile of RUAG
- Table 67. Electrical Slip Rings Product Picture and Specifications of RUAG
- Table 68. Electrical Slip Rings Production (K Units), Revenue (US$ Million), Price (US$/Unit) and Gross Margin of RUAG, (2018-2023)
- Table 69. Recent Developments/Updates
- Table 70. Profile of DSTI
- Table 71. Electrical Slip Rings Product Picture and Specifications of DSTI
- Table 72. Electrical Slip Rings Production (K Units), Revenue (US$ Million), Price (US$/Unit) and Gross Margin of DSTI (2018-2023)
- Table 73. Recent Developments/Updates
- Table 74. Profile of Cavotec SA
- Table 75. Electrical Slip Rings Product Picture and Specifications of Cavotec SA
- Table 76. Electrical Slip Rings Production (K Units), Revenue (US$ Million), Price (US$/Unit) and Gross Margin of Cavotec SA (2018-2023)
- Table 77. Recent Developments/Updates
- Table 78. Profile of Pandect Precision
- Table 79. Electrical Slip Rings Product Picture and Specifications of Pandect Precision
- Table 80. Electrical Slip Rings Production (K Units), Revenue (US$ Million), Price (US$/Unit) and Gross Margin of Pandect Precision (2018-2023)
- Table 81. Recent Developments/Updates
- Table 82. Profile of NSD Corporation
- Table 83. Electrical Slip Rings Product Picture and Specifications of NSD Corporation
- Table 84. Electrical Slip Rings Production (K Units), Revenue (US$ Million), Price (US$/Unit) and Gross Margin of NSD Corporation (2018-2023)
- Table 85. Recent Developments/Updates
- Table 86. Profile of Mercotac
- Table 87. Electrical Slip Rings Product Picture and Specifications of Mercotac
- Table 88. Electrical Slip Rings Production (K Units), Revenue (US$ Million), Price (US$/Unit) and Gross Margin of Mercotac (2018-2023)
- Table 89. Profile of UEA
- Table 90. Electrical Slip Rings Product Picture and Specifications of UEA
- Table 91. Electrical Slip Rings Production (K Units), Revenue (US$ Million), Price (US$/Unit) and Gross Margin of UEA (2018-2023)
- Table 92. Recent Developments/Updates
- Table 93. Profile of BGB
- Table 94. Electrical Slip Rings Product Picture and Specifications of BGB
- Table 95. Electrical Slip Rings Production (K Units), Revenue (US$ Million), Price (US$/Unit) and Gross Margin of BGB (2018-2023)
- Table 96. Recent Developments/Updates
- Table 97. Profile of Conductix-Wampfler
- Table 98. Electrical Slip Rings Product Picture and Specifications of Conductix-Wampfler
- Table 99. Electrical Slip Rings Production (K Units), Revenue (US$ Million), Price (US$/Unit) and Gross Margin of Conductix-Wampfler (2018-2023)
- Table 100. Recent Developments/Updates
- Table 101. Profile of Molex
- Table 102. Electrical Slip Rings Product Picture and Specifications of Molex
- Table 103. Electrical Slip Rings Production (K Units), Revenue (US$ Million), Price (US$/Unit) and Gross Margin of Molex (2018-2023)
- Table 104. Recent Developments/Updates
- Table 105. Profile of Ravioli
- Table 106. Electrical Slip Rings Product Picture and Specifications of Ravioli
- Table 107. Slip Ring Rings Production (K Units), Revenue (US$ Million), Price (US$/Unit) and Gross Margin of Ravioli (2018-2023)
- Table 108. Profile of Rotac
- Table 109. Electrical Slip Rings Product Picture and Specifications of Rotac
- Table 110. Electrical Slip Rings Production (K Units), Revenue (US$ Million), Price (US$/Unit) and Gross Margin of Rotac (2018-2023)
- Table 111. Recent Developments/Updates
- Table 112. Profile of Michigan
- Table 113. Electrical Slip Rings Product Picture and Specifications of Michigan
- Table 114. Electrical Slip Rings Production (K Units), Revenue (US$ Million), Price (US$/Unit) and Gross Margin of Michigan (2018-2023)
- Table 115. Recent Developments/Updates
- Table 116. Profile of Hangzhou Prosper
- Table 117. Electrical Slip Rings Product Picture and Specifications of Hangzhou Prosper
- Table 118. Electrical Slip Rings Production (K Units), Revenue (US$ Million), Price (US$/Unit) and Gross Margin of Hangzhou Prosper (2018-2023)
- Table 119. Recent Developments/Updates
- Table 120. Profile of Moflon
- Table 121. Electrical Slip Rings Product Picture and Specifications of Moflon
- Table 122. Electrical Slip Rings Production (K Units), Revenue (US$ Million), Price (US$/Unit) and Gross Margin of Moflon (2018-2023)
- Table 123. Profile of Jinpat Electronics
- Table 124. Electrical Slip Rings Product Picture and Specifications of Jinpat Electronics
- Table 125. Electrical Slip Rings Production (K Units), Revenue (US$ Million), Price (US$/Unit) and Gross Margin of Jinpat Electronics (2018-2023)
- Table 126. Profile of Pan-link Technology
- Table 127. Electrical Slip Rings Product Picture and Specifications of Pan-link Technology
- Table 128. Electrical Slip Rings Production (K Units), Revenue (US$ Million), Price (US$/Unit) and Gross Margin of Pan-link Technology (2018-2023)
- Table 129. Profile of Foxtac Electric
- Table 130. Electrical Slip Rings Product Picture and Specifications of Foxtac Electric
- Table 131. Electrical Slip Rings Production (K Units), Revenue (US$ Million), Price (US$/Unit) and Gross Margin of Foxtac Electric (2018-2023)
- Table 132. Profile of SenRing Electronics
- Table 133. Electrical Slip Rings Product Picture and Specifications of SenRing Electronics
- Table 134. Electrical Slip Rings Production (K Units), Revenue (US$ Million), Price (US$/Unit) and Gross Margin of SenRing Electronics (2018-2023)
- Table 135. Recent Developments/Updates
- Table 136. Profile of TrueSci Fine Works
- Table 137. Electrical Slip Rings Product Picture and Specifications of TrueSci Fine Works
- Table 138. Electrical Slip Rings Production (K Units), Revenue (US$ Million), Price (US$/Unit) and Gross Margin of TrueSci Fine Works (2018-2023)
- Table 139. Profile of Jarch
- Table 140. Electrical Slip Rings Product Picture and Specifications of Jarch
- Table 141. Electrical Slip Rings Production (K Units), Revenue (US$ Million), Price (US$/Unit) and Gross Margin of Jarch (2018-2023)
- Table 142. Key Raw Materials Price Trend
- Table 143. Key Suppliers of Raw Materials
- Table 144. Electrical Slip Rings Distributors List
- Table 145. Electrical Slip Rings Customers List
- Table 146. Electrical Slip Rings Market Trends
- Table 147. Electrical Slip Rings Market Drivers
- Table 148. Electrical Slip Rings Market Challenges
- Table 149. Global Electrical Slip Rings Production (K Units) Forecast by Region (2024-2029)
- Table 150. North America Electrical Slip Rings Consumption Forecast by Country (2024-2029) & (K Units)
- Table 151. Europe Electrical Slip Rings Consumption Forecast by Country (2024-2029) & (K Units)
- Table 152. Asia Pacific Electrical Slip Rings Consumption Forecast by Region (2024-2029) & (K Units)
- Table 153. South America Electrical Slip Rings Consumption Forecast by Country (2024-2029) & (K Units)
- Table 154. Global Electrical Slip Rings Production Forecast by Type (2024-2029) & (K Units)
- Table 155. Global Electrical Slip Rings Revenue Forecast by Type (2024-2029) & (US$ Million)
- Table 156. Global Electrical Slip Rings Price Forecast by Type (2024-2029) & (US$/Unit)
- Table 157. Global Electrical Slip Rings Production Forecast by Application (2024-2029) & (K Units)
- Table 158. Global Electrical Slip Rings Revenue Forecast by Application (2024-2029) & (US$ Million)
- Table 159. Global Electrical Slip Rings Price Forecast by Application (2024-2029) & (US$/Unit)
- Table 160. Research Programs/Design for This Report
- Table 161. Key Data Information from Secondary Sources
- Table 162. Key Data Information from Primary Sources
List of Figures
- Figure 1. Product Picture of Electrical Slip Rings
- Figure 2. Global Electrical Slip Rings Market Share by Type: 2023 VS 2029
- Figure 3. Small Capsules Product Picture
- Figure 4. Mid-Sized Capsules Product Picture
- Figure 5. Enclosed Power Thru-Bore Product Picture
- Figure 6. Enclosed Signal Thru-Bore Product Picture
- Figure 7. Others Product Picture
- Figure 8. Global Electrical Slip Rings Market Share by Application: 2023 VS 2029
- Figure 9. Industrial & Commercial
- Figure 10. Defense & Aerospace
- Figure 11. Test Equipment
- Figure 12. Wind Turbines
- Figure 13. Video & Optical Systems
- Figure 14. Radar
- Figure 15. Global Electrical Slip Rings Revenue (US$ Million), 2018 VS 2023 VS 2029
- Figure 16. Global Electrical Slip Rings Revenue (US$ Million) (2018-2029)
- Figure 17. Global Electrical Slip Rings Production (K Units) & (2018-2029)
- Figure 18. North America Electrical Slip Rings Revenue (US$ Million) Growth Rate (2018-2029)
- Figure 19. Europe Electrical Slip Rings Revenue (US$ Million) Growth Rate (2018-2029)
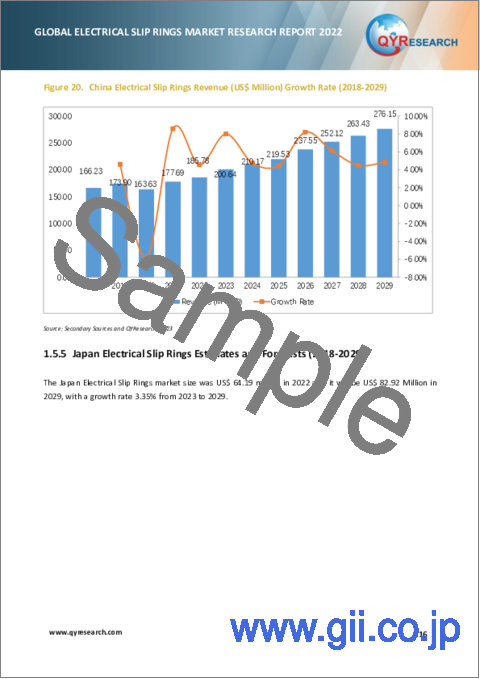
- Figure 20. China Electrical Slip Rings Revenue (US$ Million) Growth Rate (2018-2029)
- Figure 21. Japan Electrical Slip Rings Revenue (US$ Million) Growth Rate (2018-2029)
- Figure 22. South Korea Electrical Slip Rings Revenue (US$ Million) Growth Rate (2018-2029)
- Figure 23. Electrical Slip Rings Production Share by Manufacturers in 2022
- Figure 24. Global Electrical Slip Rings Revenue Share by Manufacturers in 2022
- Figure 25. Electrical Slip Rings Market Share by Company Type (Tier 1, Tier 2, and Tier 3): 2018 VS 2022
- Figure 26. Global Market Electrical Slip Rings Average Price (US$/Unit) of Key Manufacturers in 2022
- Figure 27. The Global 5 and 10 Largest Players: Market Share by Electrical Slip Rings Revenue in 2022
- Figure 28. Global Electrical Slip Rings Production Market Share by Region (2018-2023)
- Figure 29. North America Electrical Slip Rings Production (K Units) Growth Rate (2018-2023)
- Figure 30. Europe Electrical Slip Rings Production (K Units) Growth Rate (2018-2023)
- Figure 31. China Electrical Slip Rings Production (K Units) Growth Rate (2018-2023)
- Figure 32. Japan Electrical Slip Rings Production (K Units) Growth Rate (2018-2023)
- Figure 33. South Korea Electrical Slip Rings Production (K Units) Growth Rate (2018-2023)
- Figure 34. Global Electrical Slip Rings Consumption Market Share by Region (2018-2023)
- Figure 35. North America Electrical Slip Rings Consumption and Growth Rate (2018-2023) & (K Units)
- Figure 36. North America Electrical Slip Rings Consumption Market Share by Country in 2022
- Figure 37. U.S. Electrical Slip Rings Consumption and Growth Rate (2018-2023) & (K Units)
- Figure 38. Canada Electrical Slip Rings Consumption (K Units) and Growth Rate (2018-2023)
- Figure 39. Mexico Electrical Slip Rings Consumption and Growth Rate (2018-2023) & (K Units)
- Figure 40. Europe Electrical Slip Rings Consumption and Growth Rate (2018-2023) & (K Units)
- Figure 41. Europe Electrical Slip Rings Consumption Market Share by Country in 2022
- Figure 42. Germany Electrical Slip Rings Consumption and Growth Rate (2018-2023) & (K Units)
- Figure 43. France Electrical Slip Rings Consumption and Growth Rate (2018-2023) & (K Units)
- Figure 44. U.K. Electrical Slip Rings Consumption and Growth Rate (2018-2023) & (K Units)
- Figure 45. Italy Electrical Slip Rings Consumption and Growth Rate (2018-2023) & (K Units)
- Figure 46. Russia Electrical Slip Rings Consumption and Growth Rate (2018-2023) & (K Units)
- Figure 47. Asia Pacific Electrical Slip Rings Consumption and Growth Rate (K Units)
- Figure 48. Asia Pacific Electrical Slip Rings Consumption Market Share by Region in 2022
- Figure 49. China Electrical Slip Rings Consumption and Growth Rate (2018-2023) & (K Units)
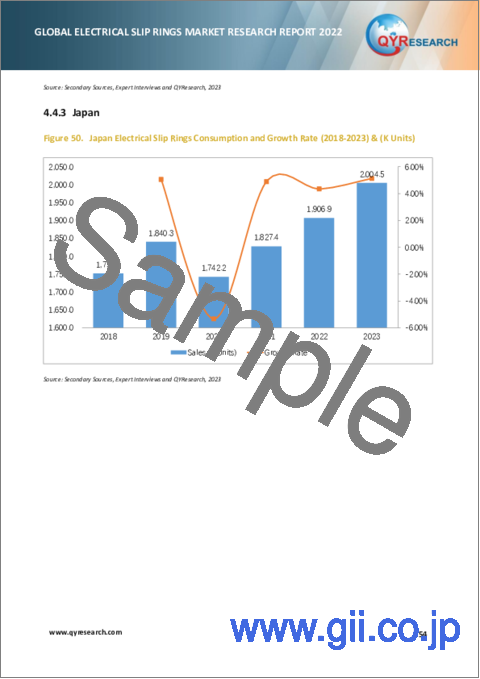
- Figure 50. Japan Electrical Slip Rings Consumption and Growth Rate (2018-2023) & (K Units)
- Figure 51. South Korea Electrical Slip Rings Consumption and Growth Rate (2018-2023) & (K Units)
- Figure 52. China Taiwan Electrical Slip Rings Consumption and Growth Rate (2018-2023) & (K Units)
- Figure 53. Southeast Asia Electrical Slip Rings Consumption and Growth Rate (2018-2023) & (K Units)
- Figure 54. India Electrical Slip Rings Consumption and Growth Rate (2018-2023) & (K Units)
- Figure 55. Australia Electrical Slip Rings Consumption and Growth Rate (2018-2023) & (K Units)
- Figure 56. South America Electrical Slip Rings Consumption and Growth Rate (K Units)
- Figure 57. South America Electrical Slip Rings Consumption Market Share by Country in 2022
- Figure 58. Brazil Electrical Slip Rings Consumption and Growth Rate (2018-2023) & (K Units)
- Figure 59. Production Market Share of Electrical Slip Rings by Type (2018-2023)
- Figure 60. Production Market Share of Electrical Slip Rings by Type in 2022
- Figure 61. Revenue Share of Electrical Slip Rings by Type (2018-2023)
- Figure 62. Revenue Market Share of Electrical Slip Rings by Type in 2022
- Figure 63. Production Market Share of Electrical Slip Rings by Application (2018-2023)
- Figure 64. Production Market Share of Electrical Slip Rings by Application in 2022
- Figure 65. Revenue Share of Electrical Slip Rings by Application (2018-2023)
- Figure 66. Revenue Market Share of Electrical Slip Rings by Application in 2022
- Figure 67. Manufacturing Cost Structure of Electrical Slip Rings
- Figure 68. Manufacturing Process Analysis of Electrical Slip Rings
- Figure 69. Slip Rings Industrial Chain Analysis
- Figure 70. Channels of Distribution
- Figure 71. Distributors Profiles
- Figure 72. Porter's Five Forces Analysis
- Figure 73. Global Electrical Slip Rings Production Market Share Forecast by Region (2024-2029)
- Figure 74. North America Electrical Slip Rings Revenue (US$ Million) Growth Rate Forecast (2024-2029)
- Figure 75. Europe Electrical Slip Rings Revenue (US$ Million) Growth Rate Forecast (2024-2029)
- Figure 76. China Electrical Slip Rings Revenue (US$ Million) Growth Rate Forecast (2024-2029)
- Figure 77. Japan Electrical Slip Rings Revenue (US$ Million) Growth Rate Forecast (2024-2029)
- Figure 78. South Korea Electrical Slip Rings Revenue (US$ Million) Growth Rate Forecast (2024-2029)
- Figure 79. Global Forecasted Demand Analysis of Electrical Slip Rings (2018-2029) & (K Units)
- Figure 80. Global Electrical Slip Rings Production Market Share Forecast by Type (2024-2029)
- Figure 81. Global Electrical Slip Rings Revenue Market Share Forecast by Type (2024-2029)
- Figure 82. Global Electrical Slip Rings Production Market Share Forecast by Application (2024-2029)
- Figure 83. Global Electrical Slip Rings Revenue Market Share Forecast by Application (2024-2029)
- Figure 84. Bottom-up and Top-down Approaches for This Report
- Figure 85. Data Triangulation
Due to the COVID-19 pandemic, the global Electrical Slip Rings market size is estimated to be worth US$ 875.93 million in 2022 and is forecast to a readjusted size of US$ 1,196.37 million by 2029 with a CAGR of 4.27% during the forecast period 2023-2029. Fully considering the economic change by this health crisis, Mid-Sized Capsules accounting for 35.54% of the Electrical Slip Rings global market in 2022, is projected to value US$ 439.58 million by 2029, growing at a revised 4.7% CAGR from 2023 to 2029. While Industrial & Commercial segment is altered to an 4.28% CAGR throughout this forecast period.
North America Electrical Slip Rings market size was US$ 230.46 million in 2022, while Europe was US$ 290.07 million. The proportion of the North America was 26.31% in 2022, while Europe's percentage was 33.12%, and it is predicted that Europe market share will reach 32.75% in 2029, trailing a CAGR of 4.13% through the analysis period. As for the Asia-Pacific region, the notable markets are China and India, CAGR is 6.82% and 6.21% respectively for the next 6-year period.
The global major manufacturers of Electrical Slip Rings include Moog, Schleifring, Morgan, Everaxis (Cobham), Mersen, Stemmann, LTN, RUAG, and DSTI, etc. In terms of revenue, the global three largest players hold a 45.27% market share of Electrical Slip Rings in 2022.
Drivers and Restrains:
The research report has incorporated the analysis of different factors that augment the market's growth. It constitutes trends, restraints, and drivers that transform the market in either a positive or negative manner. This section also provides the scope of different segments and applications that can potentially influence the market in the future. The detailed information is based on current trends and historic milestones. This section also provides an analysis of the volume of production about the global market and about each type from 2018 to 2029. This section mentions the volume of production by region from 2018 to 2029.
A thorough evaluation of the restrains included in the report portrays the contrast to drivers and gives room for strategic planning. Factors that overshadow the market growth are pivotal as they can be understood to devise different bends for getting hold of the lucrative opportunities that are present in the ever-growing market. Additionally, insights into market expert's opinions have been taken to understand the market better.
Segment Analysis:
The research report includes specific segments by region (country), by manufacturers, by Type and by Application. Each type provides information about the production during the forecast period of 2018 to 2029. by Application segment also provides consumption during the forecast period of 2018 to 2029. Understanding the segments helps in identifying the importance of different factors that aid the market growth.
By Company
- Moog
- Schleifring
- Morgan
- Everaxis (Cobham)
- Mersen
- Stemmann
- LTN
- RUAG
- DSTI
- Cavotec SA
- Pandect Precision
- NSD
- Mercotac
- UEA
- BGB
- Conductix-Wampfler
- Molex
- Ravioli
- Rotac
- Michigan Scientific
- Hangzhou Prosper
- Moflon
- Jinpat Electronics
- Pan-link Technology
- Foxtac Electric
- SenRing Electronics
- TrueSci Fine Works
- Jarch
Segment by Type
- Small Capsules
- Mid-Sized Capsules
- Enclosed Power Thru-Bore
- Enclosed Signal Thru-Bore
- Others
Segment by Application
- Industrial & Commercial
- Defense & Aerospace
- Test Equipment
- Wind Turbines
- Video & Optical Systems
- Radar
- Others
Production by Region
- North America
- Europe
- China
- Japan
- South Korea
Consumption by Region
- North America
- U.S.
- Canada
- Mexico
- Asia-Pacific
- China
- Japan
- South Korea
- China Taiwan
- Southeast Asia
- India
- Australia
- Europe
- Germany
- France
- U.K.
- Italy
- Russia
- Rest of Europe
- South America
- Brazil
- Rest of South America
Table of Contents
1 Electrical Slip Rings Market Overview
- 1.1 Product Overview and Scope of Electrical Slip Rings
- 1.2 Electrical Slip Rings Segment by Type
- 1.2.1 Global Electrical Slip Rings Market Size Growth Rate Analysis by Type: 2023 VS 2029
- 1.2.2 Small Capsules
- 1.2.3 Mid-Sized Capsules
- 1.2.4 Enclosed Power Thru-Bore
- 1.2.5 Enclosed Signal Thru-Bore
- 1.2.6 Others
- 1.3 Electrical Slip Rings Segment by Application
- 1.3.1 Global Electrical Slip Rings Market Size Growth Rate Analysis by Application: 2023 VS 2029
- 1.3.2 Industrial & Commercial
- 1.3.3 Defense & Aerospace
- 1.3.4 Test Equipment
- 1.3.5 Wind Turbines
- 1.3.6 Video & Optical Systems
- 1.3.7 Radar
- 1.3.8 Others
- 1.4 Global Market Growth Prospects
- 1.4.1 Global Electrical Slip Rings Revenue Estimates and Forecasts (2018-2029)
- 1.4.2 Global Electrical Slip Rings Production Estimates and Forecasts (2018-2029)
- 1.5 Global Market Size by Region
- 1.5.1 Global Electrical Slip Rings Market Size Estimates and Forecasts by Region: 2018 VS 2023 VS 2029
- 1.5.2 North America Electrical Slip Rings Estimates and Forecasts (2018-2029)
- 1.5.3 Europe Electrical Slip Rings Estimates and Forecasts (2018-2029)
- 1.5.4 China Electrical Slip Rings Estimates and Forecasts (2018-2029)
- 1.5.5 Japan Electrical Slip Rings Estimates and Forecasts (2018-2029)
- 1.5.6 South Korea Electrical Slip Rings Estimates and Forecasts (2018-2029)
2 Market Competition by Manufacturers
- 2.1 Global Electrical Slip Rings Production by Manufacturers (2018-2023)
- 2.2 Global Electrical Slip Rings Revenue Market Share by Manufacturers (2018-2023)
- 2.3 Electrical Slip Rings Market Share by Company Type (Tier 1, Tier 2, and Tier 3)
- 2.4 Global Electrical Slip Rings Average Price by Manufacturers (2018-2023)
- 2.5 Manufacturers Electrical Slip Rings Headquarter and Founded Time
- 2.6 Electrical Slip Rings Market Competitive Situation and Trends
- 2.6.1 Electrical Slip Rings Market Concentration Rate
- 2.6.2 Global 5 and 10 Largest Electrical Slip Rings Players Market Share by Revenue
- 2.6.3 Mergers & Acquisitions, Expansion
3 Production by Region
- 3.1 Global Production of Electrical Slip Rings by Region (2018-2023)
- 3.2 Global Electrical Slip Rings Revenue Market Share by Region (2018-2023)
- 3.3 Global Electrical Slip Rings Production, Revenue, Price and Gross Margin (2018-2023)
- 3.4 North America Electrical Slip Rings Production
- 3.4.1 North America Electrical Slip Rings Production Growth Rate (2018-2023)
- 3.4.2 North America Electrical Slip Rings Production, Revenue, Price and Gross Margin (2018-2023)
- 3.5 Europe Electrical Slip Rings Production
- 3.5.1 Europe Electrical Slip Rings Production Growth Rate (2018-2023)
- 3.5.2 Europe Electrical Slip Rings Production, Revenue, Price and Gross Margin (2018-2023)
- 3.6 China Electrical Slip Rings Production (2018-2023)
- 3.6.1 China Electrical Slip Rings Production Growth Rate (2018-2023)
- 3.6.2 China Electrical Slip Rings Production, Revenue, Price and Gross Margin (2018-2023)
- 3.7 Japan Electrical Slip Rings Production (2018-2023)
- 3.7.1 Japan Electrical Slip Rings Production Growth Rate (2018-2023)
- 3.7.2 Japan Electrical Slip Rings Production, Revenue, Price and Gross Margin (2018-2023)
- 3.8 South Korea Electrical Slip Rings Production (2018-2023)
- 3.8.1 South Korea Electrical Slip Rings Production Growth Rate (2018-2023)
- 3.8.2 South Korea Electrical Slip Rings Production, Revenue, Price and Gross Margin (2018-2023)
4 Electrical Slip Rings Consumption by Region
- 4.1 Global Electrical Slip Rings Consumption by Region
- 4.1.1 Global Electrical Slip Rings Consumption by Region
- 4.1.2 Global Electrical Slip Rings Consumption Market Share by Region
- 4.2 North America
- 4.2.1 North America Electrical Slip Rings Consumption by Country
- 4.2.2 U.S.
- 4.2.3 Canada
- 4.2.4 Mexico
- 4.3 Europe
- 4.3.1 Europe Electrical Slip Rings Consumption by Country
- 4.3.2 Germany
- 4.3.3 France
- 4.3.4 U.K.
- 4.3.5 Italy
- 4.3.6 Russia
- 4.4 Asia Pacific
- 4.4.1 Asia Pacific Electrical Slip Rings Consumption by Region
- 4.4.2 China
- 4.4.3 Japan
- 4.4.4 South Korea
- 4.4.5 China Taiwan
- 4.4.6 Southeast Asia
- 4.4.7 India
- 4.4.8 Australia
- 4.5 South America
- 4.5.1 South America Electrical Slip Rings Consumption by Country
- 4.5.2 Brazil
5 Segment by Type
- 5.1 Global Electrical Slip Rings Production Market Share by Type (2018-2023)
- 5.2 Global Electrical Slip Rings Revenue Market Share by Type (2018-2023)
- 5.3 Global Electrical Slip Rings Price by Type (2018-2023)
6 Segment by Application
- 6.1 Global Electrical Slip Rings Production Market Share by Application (2018-2023)
- 6.2 Global Electrical Slip Rings Revenue Market Share by Application (2018-2023)
- 6.3 Global Electrical Slip Rings Price by Application (2018-2023)
7 Key Companies Profiled
- 7.1 Moog
- 7.1.1 Company Profile
- 7.1.2 Electrical Slip Rings Product Portfolio
- 7.1.3 Electrical Slip Rings Production, Revenue, Price and Gross Margin (2018-2023)
- 7.1.4 Recent Developments/Updates
- 7.2 Schleifring
- 7.2.1 Company Profile
- 7.2.2 Electrical Slip Rings Product Portfolio
- 7.2.3 Electrical Slip Rings Production, Revenue, Price and Gross Margin (2018-2023)
- 7.2.4 Recent Developments/Updates
- 7.3 Morgan
- 7.3.1 Company Profile
- 7.3.2 Electrical Slip Rings Product Portfolio
- 7.3.3 Electrical Slip Rings Production, Revenue, Price and Gross Margin (2018-2023)
- 7.3.4 Recent Developments/Updates
- 7.4 Everaxis (Cobham)
- 7.4.1 Company Profile
- 7.4.2 Electrical Slip Rings Product Portfolio
- 7.4.3 Electrical Slip Rings Production, Revenue, Price and Gross Margin (2018-2023)
- 7.4.4 Recent Developments/Updates
- 7.5 Mersen
- 7.5.1 Company Profile
- 7.5.2 Electrical Slip Rings Product Portfolio
- 7.5.3 Electrical Slip Rings Production, Revenue, Price and Gross Margin (2018-2023)
- 7.5.4 Recent Developments/Updates
- 7.6 Stemmann
- 7.6.1 Company Profile
- 7.6.2 Electrical Slip Rings Product Portfolio
- 7.6.3 Electrical Slip Rings Production, Revenue, Price and Gross Margin (2018-2023)
- 7.6.4 Recent Developments/Updates
- 7.7 LTN
- 7.7.1 Company Profile
- 7.7.2 Electrical Slip Rings Product Portfolio
- 7.7.3 Electrical Slip Rings Production, Revenue, Price and Gross Margin (2018-2023)
- 7.7.4 Recent Developments/Updates
- 7.8 RUAG
- 7.8.1 Company Profile
- 7.8.2 Electrical Slip Rings Product Portfolio
- 7.8.3 Electrical Slip Rings Production, Revenue, Price and Gross Margin (2018-2023)
- 7.8.4 Recent Developments/Updates
- 7.9 DSTI
- 7.9.1 Company Profile
- 7.9.2 Electrical Slip Rings Product Portfolio
- 7.9.3 Electrical Slip Rings Production, Revenue, Price and Gross Margin (2018-2023)
- 7.9.4 Recent Developments/Updates
- 7.10 Cavotec SA
- 7.10.1 Company Profile
- 7.10.2 Electrical Slip Rings Product Portfolio
- 7.10.3 Electrical Slip Rings Production, Revenue, Price and Gross Margin (2018-2023)
- 7.10.4 Recent Developments/Updates
- 7.11 Pandect Precision
- 7.11.1 Company Profile
- 7.11.2 Electrical Slip Rings Product Portfolio
- 7.11.3 Electrical Slip Rings Production, Revenue, Price and Gross Margin (2018-2023)
- 7.11.4 Recent Developments/Updates
- 7.12 NSD Corporation
- 7.12.1 Company Profile
- 7.12.2 Electrical Slip Rings Product Portfolio
- 7.12.3 Electrical Slip Rings Production, Revenue, Price and Gross Margin (2018-2023)
- 7.12.4 Recent Developments/Updates
- 7.13 Mercotac
- 7.13.1 Company Profile
- 7.13.2 Electrical Slip Rings Product Portfolio
- 7.13.3 Electrical Slip Rings Production, Revenue, Price and Gross Margin (2018-2023)
- 7.14 UEA
- 7.14.1 Company Profile
- 7.14.2 Electrical Slip Rings Product Portfolio
- 7.14.3 Electrical Slip Rings Production, Revenue, Price and Gross Margin (2018-2023)
- 7.14.4 Recent Developments/Updates
- 7.15 BGB
- 7.15.1 Company Profile
- 7.15.2 Electrical Slip Rings Product Portfolio
- 7.15.3 Electrical Slip Rings Production, Revenue, Price and Gross Margin (2018-2023)
- 7.15.4 Recent Developments/Updates
- 7.16 Conductix-Wampfler
- 7.16.1 Company Profile
- 7.16.2 Electrical Slip Rings Product Portfolio
- 7.16.3 Electrical Slip Rings Production, Revenue, Price and Gross Margin (2018-2023)
- 7.16.4 Recent Developments/Updates
- 7.17 Molex
- 7.17.1 Company Profile
- 7.17.2 Electrical Slip Rings Product Portfolio
- 7.17.3 Electrical Slip Rings Production, Revenue, Price and Gross Margin (2018-2023)
- 7.17.4 Recent Developments/Updates
- 7.18 Ravioli
- 7.18.1 Company Profile
- 7.18.2 Electrical Slip Rings Product Portfolio
- 7.18.3 Slip Ring Rings Production, Revenue, Price and Gross Margin (2018-2023)
- 7.19 Rotac
- 7.19.1 Company Profile
- 7.19.2 Electrical Slip Rings Product Portfolio
- 7.19.3 Electrical Slip Rings Production, Revenue, Price and Gross Margin (2018-2023)
- 7.19.4 Recent Developments/Updates
- 7.20 Michigan
- 7.20.1 Company Profile
- 7.20.2 Electrical Slip Rings Product Portfolio
- 7.20.3 Electrical Slip Rings Production, Revenue, Price and Gross Margin (2018-2023)
- 7.20.4 Recent Developments/Updates
- 7.21 Hangzhou Prosper
- 7.21.1 Company Profile
- 7.21.2 Electrical Slip Rings Product Portfolio
- 7.21.3 Electrical Slip Rings Production, Revenue, Price and Gross Margin (2018-2023)
- 7.21.4 Recent Developments/Updates
- 7.22 Moflon
- 7.22.1 Company Profile
- 7.22.2 Electrical Slip Rings Product Portfolio
- 7.22.3 Electrical Slip Rings Production, Revenue, Price and Gross Margin (2018-2023)
- 7.23 Jinpat Electronics
- 7.23.1 Company Profile
- 7.23.2 Electrical Slip Rings Product Portfolio
- 7.23.3 Electrical Slip Rings Production, Revenue, Price and Gross Margin (2018-2023)
- 7.24 Pan-link Technology
- 7.24.1 Company Profile
- 7.24.2 Electrical Slip Rings Product Portfolio
- 7.24.3 Electrical Slip Rings Production, Revenue, Price and Gross Margin (2018-2023)
- 7.25 Foxtac Electric
- 7.25.1 Company Profile
- 7.25.2 Electrical Slip Rings Product Portfolio
- 7.25.3 Electrical Slip Rings Production, Revenue, Price and Gross Margin (2018-2023)
- 7.26 SenRing Electronics
- 7.26.1 Company Profile
- 7.26.2 Electrical Slip Rings Product Portfolio
- 7.26.3 Electrical Slip Rings Production, Revenue, Price and Gross Margin (2018-2023)
- 7.26.4 Recent Developments/Updates
- 7.27 TrueSci Fine Works
- 7.27.1 Company Profile
- 7.27.2 Electrical Slip Rings Product Portfolio
- 7.27.3 Electrical Slip Rings Production, Revenue, Price and Gross Margin (2018-2023)
- 7.28 Jarch
- 7.28.1 Company Profile
- 7.28.2 Electrical Slip Rings Product Portfolio
- 7.28.3 Electrical Slip Rings Production, Revenue, Price and Gross Margin (2018-2023)
8 Electrical Slip Rings Manufacturing Cost Analysis
- 8.1 Electrical Slip Rings Key Raw Materials Analysis
- 8.2 Proportion of Manufacturing Cost Structure
- 8.3 Manufacturing Process Analysis of Electrical Slip Rings
- 8.4 Slip Rings Industrial Chain Analysis
9 Marketing Channel, Distributors and Customers
- 9.1 Marketing Channel
- 9.2 Electrical Slip Rings Distributors List
- 9.3 Electrical Slip Rings Customers
10 Electrical Slip Rings Market Dynamics
- 10.1 Electrical Slip Rings Industry Trends
- 10.2 Electrical Slip Rings Market Drivers
- 10.3 Electrical Slip Rings Market Challenges
- 10.4 Porter's Five Forces Analysis
11 Production and Supply Forecast
- 11.1 Global Forecasted Production of Electrical Slip Rings by Region (2024-2029)
- 11.2 North America Electrical Slip Rings Revenue Forecast (2024-2029)
- 11.3 Europe Electrical Slip Rings Revenue Forecast (2024-2029)
- 11.4 China Electrical Slip Rings Revenue Forecast (2024-2029)
- 11.5 Japan Electrical Slip Rings Revenue Forecast (2024-2029)
- 11.6 South Korea Electrical Slip Rings Revenue Forecast (2024-2029)
12 Consumption and Demand Forecast
- 12.1 Global Forecasted Demand Analysis of Electrical Slip Rings
- 12.2 North America Forecasted Consumption of Electrical Slip Rings by Country
- 12.3 Europe Market Forecasted Consumption of Electrical Slip Rings by Country
- 12.4 Asia Pacific Market Forecasted Consumption of Electrical Slip Rings by Region
- 12.5 South America Forecasted Consumption of Electrical Slip Rings by Country
13 Forecast by Type and by Application
- 13.1 Global Production, Revenue and Price Forecast by Type (2024-2029)
- 13.1.1 Global Forecasted Production of Electrical Slip Rings by Type (2024-2029)
- 13.1.2 Global Forecasted Revenue of Electrical Slip Rings by Type (2024-2029)
- 13.1.3 Global Forecasted Price of Electrical Slip Rings by Type (2024-2029)
- 13.2 Global Production, Revenue and Price Forecast by Application (2024-2029)
- 13.2.1 Global Forecasted Production of Electrical Slip Rings by Application (2024-2029)
- 13.2.2 Global Forecasted Revenue of Electrical Slip Rings by Application (2024-2029)
- 13.2.3 Global Forecasted Price of Electrical Slip Rings by Application (2024-2029)
14 Research Findings and Conclusion
15 Methodology and Data Source
- 15.1 Methodology/Research Approach
- 15.1.1 Research Programs/Design
- 15.1.2 Market Size Estimation
- 15.1.3 Market Breakdown and Data Triangulation
- 15.2 Data Source
- 15.2.1 Secondary Sources
- 15.2.2 Primary Sources
- 15.3 Author List
- 15.4 Disclaimer