|
|
市場調査レポート
商品コード
1104945
スポーツ栄養補助食品の世界市場:分析・沿革・予測 (2017年~2028年)Global Sports Nutritional Supplements Market Report, History and Forecast 2017-2028 |
||||||
|
|
|||||||
|
● お客様のご希望に応じて、既存データの加工や未掲載情報(例:国別セグメント)の追加などの対応が可能です。 詳細はお問い合わせください。 |
|||||||


| スポーツ栄養補助食品の世界市場:分析・沿革・予測 (2017年~2028年) |
|
出版日: 2022年07月21日
発行: QYResearch
ページ情報: 英文 125 Pages
納期: 2~3営業日
|
- 全表示
- 概要
- 図表
- 目次
COVID-19の大流行により、世界のスポーツ栄養補助食品の市場規模は2021年に325億4,139万米ドルの値で、2028年には488億9,210万米ドルの再調整サイズになり、2022年~2028年の予測期間には6.35%のCAGRで成長すると予測されています。
北米のスポーツ栄養補助食品市場規模は、2021年に147億6,080万米ドルでした。欧州のスポーツ栄養補助食品の状況としては、ドイツは2028年までに34億2,196万米ドルに達すると予測されています。アジアでは、注目すべき市場は日本と韓国で、今後6年間のCAGRはそれぞれ5.78%と7.77%となっています。
COVID-19による経済変化を十分に考慮すると、2021年にスポーツ栄養補助食品の世界市場の8.55%を占めたクレアチンは、2028年までに49億8,820万米ドルの価値を持つと予測されます。
目次
第1章 スポーツ栄養補助食品:市場概要
- スポーツ栄養補助食品:製品概要
- 種類別の市場セグメント
- クレアチン
- タンパク質
- アミノ酸
- その他
- 種類別の市場規模
- 市場規模の概要:種類別 (2017年~2028年)
- 過去の市場規模:種類別 (2017年~2022年)
- 市場規模の予測:種類別 (2023年~2028年)
- 主要地域の市場規模:種類別
- 北米のスポーツ栄養補助食品の販売:種類別 (2017年~2022年)
- 欧州のスポーツ栄養補助食品の販売:種類別 (2017年~2022年)
- アジア太平洋のスポーツ栄養補助食品の販売:種類別 (2017年~2022年)
- ラテンアメリカのスポーツ栄養補助食品の販売:種類別 (2017年~2022年)
- 中東・アフリカのスポーツ栄養補助食品の販売:種類別 (2017年~2022年)
第2章 スポーツ栄養補助食品:企業別の市場競争
- 世界のスポーツ栄養補助食品の主要企業の販売 (2017年~2022年)
- 世界のスポーツ栄養補助食品の主要企業の収益 (2017年~2022年)
- 世界のスポーツ栄養補助食品の主要企業の価格 (2017年~2022年)
- 世界のスポーツ栄養補助食品の主要メーカーの製造拠点・販売エリア・製品種類
- スポーツ栄養補助食品市場の競争状況と動向
- 世界の主要メーカー:企業の種類別 (ティア1、ティア2、ティア3) (収益別、2021年)
- 主要メーカーの設立時期
- 主要メーカーの主力製品
第3章 スポーツ栄養補助食品:地域別の現状と展望
- 世界のスポーツ栄養補助食品の市場規模・CAGR:地域別 (2017年・2021年・2028年)
- 過去の市場規模:地域別
- 市場規模の予測:地域別
第4章 スポーツ栄養補助食品:販売チャネル別
- 販売チャネル別の市場セグメント
- オンラインセール
- オフラインセール
- 販売チャネル別の市場規模
- 市場規模の概要:販売チャネル別 (2017年~2028年)
- 過去の市場規模:販売チャネル別 (2017年~2022年)
- 市場規模の予測:販売チャネル別 (2023年~2028年)
- 主要地域の市場規模:販売チャネル別
- 北米のスポーツ栄養補助食品の販売:販売チャネル別 (2017年~2022年)
- 欧州のスポーツ栄養補助食品の販売:販売チャネル別 (2017年~2022年)
- アジア太平洋のスポーツ栄養補助食品の販売:販売チャネル別 (2017年~2022年)
- ラテンアメリカのスポーツ栄養補助食品の販売:販売チャネル別 (2017年~2022年)
- 中東・アフリカのスポーツ栄養補助食品の販売:販売チャネル別 (2017年~2022年)
第5章 北米のスポーツ栄養補助食品:国別
- 過去の市場規模:国別
- 市場規模の予測:国別
第6章 欧州のスポーツ栄養補助食品:国別
第7章 アジア太平洋のスポーツ栄養補助食品:地域別
第8章 ラテンアメリカのスポーツ栄養補助食品:国別
第9章 中東・アフリカのスポーツ栄養補助食品:国別
第10章 企業プロファイル:スポーツ栄養補助食品事業の主要指標
- Glanbia Nutritionals
- BellRing Brands (Dymatize Enterprises)
- Cellucor
- Herbalife Nutrition
- Nestlé
- Abbott Nutrition
- Xiwang Foodstuffs Co., Ltd.
- CytoSport
- Clif Bar
- Quest Nutrition
- NOW Foods
- Amway (Nutrilite XS)
- MaxiNutrition (KRGER GROUP)
- BPI Sports
- BY-Health Co Ltd
- Science in Sports
- Competitor (CPT)
第11章 上流工程・機会・課題・リスク・影響要因の分析
- スポーツ栄養補助食品の主要原材料
- 製造コストの構造
- スポーツ栄養補助食品の産業チェーンの分析
- スポーツ栄養補助食品の市場力学
第12章 マーケティング戦略分析、流通業者
- 販売チャンネル
- スポーツ栄養補助食品の流通業者
- スポーツ栄養補助食品の下流工程の顧客
第13章 調査結果と結論
第14章 付録
LIST OF TABLES
- Table 1. Major Company of Creatine
- Table 2. Major Company of Proteins
- Table 3. Major Company of Amino Acid
- Table 4. Global Sports Nutritional Supplements Sales by Type: 2017 VS 2021 VS 2028 (US$ Million)
- Table 5. Global Sports Nutritional Supplements Sales by Type (2017-2022) & (M Units)
- Table 6. Global Sports Nutritional Supplements Sales Market Share in Volume by Type (2017-2022)
- Table 7. Global Sports Nutritional Supplements Sales by Type (2017-2022) & (US$ Million)
- Table 8. Global Sports Nutritional Supplements Sales Market Share in Value by Type (2017-2022)
- Table 9. Global Sports Nutritional Supplements Price by Type (2017-2022) & (US$/Unit)
- Table 10. Global Sports Nutritional Supplements Sales by Type (2023-2028) & (M Units)
- Table 11. Global Sports Nutritional Supplements Sales Market Share in Volume by Type (2023-2028)
- Table 12. Global Sports Nutritional Supplements Sales by Type (2023-2028) & (US$ Million)
- Table 13. Global Sports Nutritional Supplements Sales Market Share in Value by Type (2023-2028)
- Table 14. Global Sports Nutritional Supplements Price by Type (2023-2028) & (US$/Unit)
- Table 15. North America Sports Nutritional Supplements Sales by Type (2017-2022) & (M Units)
- Table 16. Europe Sports Nutritional Supplements Sales (M Units) by Type (2017-2022)
- Table 17. Asia-Pacific Sports Nutritional Supplements Sales (M Units) by Type (2017-2022)
- Table 18. Latin America Sports Nutritional Supplements Sales (M Units) by Type (2017-2022)
- Table 19. Middle East and Africa Sports Nutritional Supplements Sales (M Units) by Type (2017-2022)
- Table 20. Global Sports Nutritional Supplements Sales by Company (2017-2022) & (M Units)
- Table 21. Global Sports Nutritional Supplements Sales Share by Company (2017-2022)
- Table 22. Global Sports Nutritional Supplements Revenue by Company (2017-2022) & (US$ Million)
- Table 23. Global Sports Nutritional Supplements Revenue Share by Company (2017-2022)
- Table 24. Global Market Sports Nutritional Supplements Price by Company (2017-2022) & (US$/Unit)
- Table 25. Global Sports Nutritional Supplements Top Manufacturers Headquarters Distribution and Sales Area
- Table 26. Global Sports Nutritional Supplements Manufacturers Market Concentration Ratio (CR5)
- Table 27. Global Top Manufacturers Market Share by Company Type (Tier 1, Tier 2, and Tier 3) & (based on the Revenue in Sports Nutritional Supplements as of 2021)
- Table 28. Dates of Establishment of Key Manufacturers
- Table 29. Key Manufacturers Sports Nutritional Supplements Product Type
- Table 30. Global Sports Nutritional Supplements Market Size Comparison by Region (US$ Million): 2017 VS 2021 VS 2028
- Table 31. Global Sports Nutritional Supplements Sales by Region (2017-2022) & (M Units)
- Table 32. Global Sports Nutritional Supplements Sales Market Share in Volume by Region (2017-2022)
- Table 33. Global Sports Nutritional Supplements Sales by Region (2017-2022) & (US$ Million)
- Table 34. Global Sports Nutritional Supplements Sales Market Share in Value by Region (2017-2022)
- Table 35. Global Sports Nutritional Supplements Sales (M Units), Value (US$ Million), Price (US$/Unit) and Gross Margin (2017-2022)
- Table 36. Global Sports Nutritional Supplements Sales by Region (2023-2028) & (M Units)
- Table 37. Global Sports Nutritional Supplements Sales Market Share in Volume by Region (2023-2028)
- Table 38. Global Sports Nutritional Supplements Sales by Region (2023-2028) & (US$ Million)
- Table 39. Global Sports Nutritional Supplements Sales Market Share in Value by Region (2023-2028)
- Table 40. Global Sports Nutritional Supplements Sales (M Units), Value (US$ Million), Price (US$/Unit) and Gross Margin (2023-2028)
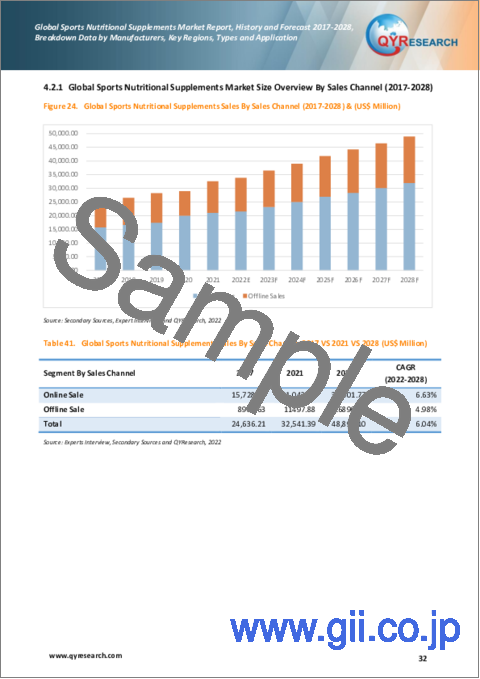
- Table 41. Global Sports Nutritional Supplements Sales By Sales Channel: 2017 VS 2021 VS 2028 (US$ Million)
- Table 42. Global Sports Nutritional Supplements Sales By Sales Channel (2017-2022) & (M Units)
- Table 43. Global Sports Nutritional Supplements Sales Market Share in Volume By Sales Channel (2017-2022)
- Table 44. Global Sports Nutritional Supplements Sales By Sales Channel (2017-2022) & (US$ Million)
- Table 45. Global Sports Nutritional Supplements Sales Market Share in Value By Sales Channel (2017-2022)
- Table 46. Global Sports Nutritional Supplements Price By Sales Channel (2017-2022) & (US$/Unit)
- Table 47. Global Sports Nutritional Supplements Sales By Sales Channel (2023-2028) & (M Units)
- Table 48. Global Sports Nutritional Supplements Sales Market Share in Volume By Sales Channel (2023-2028)
- Table 49. Global Sports Nutritional Supplements Sales By Sales Channel (2023-2028) & (US$ Million)
- Table 50. Global Sports Nutritional Supplements Sales Market Share in Value By Sales Channel (2023-2028)
- Table 51. Global Sports Nutritional Supplements Price By Sales Channel (2023-2028) & (US$/Unit)
- Table 52. North America Sports Nutritional Supplements Sales By Sales Channel (2017-2022) & (M Units)
- Table 53. Europe Sports Nutritional Supplements Sales (M Units) By Sales Channel (2017-2022)
- Table 54. Asia-Pacific Sports Nutritional Supplements Sales (M Units) By Sales Channel (2017-2022)
- Table 55. Latin America Sports Nutritional Supplements Sales (M Units) By Sales Channel (2017-2022)
- Table 56. Middle East and Africa Sports Nutritional Supplements Sales (M Units) By Sales Channel (2017-2022)
- Table 57. North America Sports Nutritional Supplements Sales by Country (2017-2022) & (M Units)
- Table 58. North America Sports Nutritional Supplements Sales Market Share in Volume by Country (2017-2022)
- Table 59. North America Sports Nutritional Supplements Sales by Country (2017-2022) & (US$ Million)
- Table 60. North America Sports Nutritional Supplements Sales Market Share in Value by Country (2017-2022)
- Table 61. North America Sports Nutritional Supplements Sales by Country (2023-2028) & (M Units)
- Table 62. North America Sports Nutritional Supplements Sales Market Share in Volume by Country (2023-2028)
- Table 63. North America Sports Nutritional Supplements Sales by Country (2023-2028) & (US$ Million)
- Table 64. North America Sports Nutritional Supplements Sales Market Share in Value by Country (2023-2028)
- Table 65. Europe Sports Nutritional Supplements Sales by Country (2017-2022) & (M Units)
- Table 66. Europe Sports Nutritional Supplements Sales Market Share in Volume by Country (2017-2022)
- Table 67. Europe Sports Nutritional Supplements Sales by Country (2017-2022) & (US$ Million)
- Table 68. Europe Sports Nutritional Supplements Sales Market Share in Value by Country (2017-2022)
- Table 69. Europe Sports Nutritional Supplements Sales by Country (2023-2028) & (M Units)
- Table 70. Europe Sports Nutritional Supplements Sales Market Share in Volume by Country (2023-2028)
- Table 71. Europe Sports Nutritional Supplements Sales by Country (2023-2028) & (US$ Million)
- Table 72. Europe Sports Nutritional Supplements Sales Market Share in Value by Country (2023-2028)
- Table 73. Asia-Pacific Sports Nutritional Supplements Sales by Region (2017-2022) & (M Units)
- Table 74. Asia-Pacific Sports Nutritional Supplements Sales Market Share in Volume by Region (2017-2022)
- Table 75. Asia-Pacific Sports Nutritional Supplements Sales by Region (2017-2022) & (US$ Million)
- Table 76. Asia-Pacific Sports Nutritional Supplements Sales Market Share in Value by Region (2017-2022)
- Table 77. Asia-Pacific Sports Nutritional Supplements Sales by Region (2023-2028) & (M Units)
- Table 78. Asia-Pacific Sports Nutritional Supplements Sales Market Share in Volume by Region (2023-2028)
- Table 79. Asia-Pacific Sports Nutritional Supplements Sales by Region (2023-2028) & (US$ Million)
- Table 80. Asia-Pacific Sports Nutritional Supplements Sales Market Share in Value by Region (2023-2028)
- Table 81. Latin America Sports Nutritional Supplements Sales by Country (2017-2022) & (M Units)
- Table 82. Latin America Sports Nutritional Supplements Sales Market Share in Volume by Country (2017-2022)
- Table 83. Latin America Sports Nutritional Supplements Sales by Country (2017-2022) & (US$ Million)
- Table 84. Latin America Sports Nutritional Supplements Sales Market Share in Value by Country (2017-2022)
- Table 85. Latin America Sports Nutritional Supplements Sales by Country (2023-2028) & (M Units)
- Table 86. Latin America Sports Nutritional Supplements Sales Market Share in Volume by Country (2023-2028)
- Table 87. Latin America Sports Nutritional Supplements Sales by Country (2023-2028) & (US$ Million)
- Table 88. Latin America Sports Nutritional Supplements Sales Market Share in Value by Country (2023-2028)
- Table 89. Middle East and Africa Sports Nutritional Supplements Sales by Country (2017-2022) & (M Units)
- Table 90. Middle East and Africa Sports Nutritional Supplements Sales Market Share in Volume by Country (2017-2022)
- Table 91. Middle East and Africa Sports Nutritional Supplements Sales by Country (2017-2022) & (US$ Million)
- Table 92. Middle East and Africa Sports Nutritional Supplements Sales Market Share in Value by Country (2017-2022)
- Table 93. Middle East and Africa Sports Nutritional Supplements Sales by Country (2023-2028) & (M Units)
- Table 94. Middle East and Africa Sports Nutritional Supplements Sales Market Share by Country (2023-2028)
- Table 95. Middle East and Africa Sports Nutritional Supplements Sales by Country (2023-2028) & (US$ Million)
- Table 96. Middle East and Africa Sports Nutritional Supplements Sales Market Share in Value by Country (2023-2028)
- Table 97. Glanbia Nutritionals Corporation Information
- Table 98. Glanbia Nutritionals Introduction and Business Overview
- Table 99. Glanbia Nutritionals Sports Nutritional Supplements Sales (M Units), Revenue (US$ Million), Price (US$/Unit) and Gross Margin (2017-2022)
- Table 100. Glanbia Nutritionals Sports Nutritional Supplements Product
- Table 101. Glanbia Nutritionals Recent Development
- Table 102. BellRing Brands(Dymatize Enterprises) Corporation Information
- Table 103. BellRing Brands(Dymatize Enterprises) Introduction and Business Overview
- Table 104. BellRing Brands(Dymatize Enterprises) Sports Nutritional Supplements Sales (M Units), Revenue (US$ Million), Price (US$/Unit) and Gross Margin (2017-2022)
- Table 105. BellRing Brands(Dymatize Enterprises) Sports Nutritional Supplements Product
- Table 106. Cellucor Corporation Information
- Table 107. Cellucor Introduction and Business Overview
- Table 108. Cellucor Sports Nutritional Supplements Sales (M Units), Revenue (US$ Million), Price (US$/Unit) and Gross Margin (2017-2022)
- Table 109. Cellucor Sports Nutritional Supplements Product
- Table 110. Herbalife Nutrition Corporation Information
- Table 111. Herbalife Nutrition Introduction and Business Overview
- Table 112. Herbalife Nutrition Sports Nutritional Supplements Sales (M Units), Revenue (US$ Million), Price (US$/Unit) and Gross Margin (2017-2022)
- Table 113. Herbalife Nutrition Sports Nutritional Supplements Product
- Table 114. Herbalife Nutrition Recent Development
- Table 115. NestlMaxiNutrition KRÜGER GROUP Corporation Information
- Table 116. NestlMaxiNutrition KRÜGER GROUP Introduction and Business Overview
- Table 117. NestlMaxiNutrition KRÜGER GROUP Sports Nutritional Supplements Sales (M Units), Revenue (US$ Million), Price (US$/Unit) and Gross Margin (2017-2022)
- Table 118. NestlMaxiNutrition KRÜGER GROUP Sports Nutritional Supplements Product
- Table 119. NestlMaxiNutrition KRÜGER GROUP Recent Development
- Table 120. Abbott Nutrition Corporation Information
- Table 121. Abbott Nutrition Introduction and Business Overview
- Table 122. Abbott Nutrition Sports Nutritional Supplements Sales (M Units), Revenue (US$ Million), Price (US$/Unit) and Gross Margin (2017-2022)
- Table 123. Abbott Nutrition Sports Nutritional Supplements Product
- Table 124. Abbott Nutrition Recent Development
- Table 125. Xiwang Foodstuffs Co., Ltd. Corporation Information
- Table 126. Xiwang Foodstuffs Co., Ltd. Introduction and Business Overview
- Table 127. Xiwang Foodstuffs Co., Ltd. Sports Nutritional Supplements Sales (M Units), Revenue (US$ Million), Price (US$/Unit) and Gross Margin (2017-2022)
- Table 128. Xiwang Foodstuffs Co., Ltd. Sports Nutritional Supplements Product
- Table 129. Xiwang Foodstuffs Co., Ltd. Recent Development
- Table 130. CytoSport Corporation Information
- Table 131. CytoSport Introduction and Business Overview
- Table 132. CytoSport Sports Nutritional Supplements Sales (M Units), Revenue (US$ Million), Price (US$/Unit) and Gross Margin (2017-2022)
- Table 133. CytoSport Sports Nutritional Supplements Product
- Table 134. Clif Bar Corporation Information
- Table 135. Clif Bar Introduction and Business Overview
- Table 136. Clif Bar Sports Nutritional Supplements Sales (M Units), Revenue (US$ Million), Price (US$/Unit) and Gross Margin (2017-2022)
- Table 137. Clif Bar Sports Nutritional Supplements Product
- Table 138. Quest Nutrition Corporation Information
- Table 139. Quest Nutrition Introduction and Business Overview
- Table 140. Quest Nutrition Sports Nutritional Supplements Sales (M Units), Revenue (US$ Million), Price (US$/Unit) and Gross Margin (2017-2022)
- Table 141. Quest Nutrition Sports Nutritional Supplements Product
- Table 142. NOW Foods Corporation Information
- Table 143. NOW Foods Introduction and Business Overview
- Table 144. NOW Foods Sports Nutritional Supplements Sales (M Units), Revenue (US$ Million), Price (US$/Unit) and Gross Margin (2017-2022)
- Table 145. NOW Foods Sports Nutritional Supplements Product
- Table 146. NOW Foods Recent Development
- Table 147. Amway(Nutrilite XS ) Corporation Information
- Table 148. Amway(Nutrilite XS ) Introduction and Business Overview
- Table 149. Amway(Nutrilite XS ) Sports Nutritional Supplements Sales (M Units), Revenue (US$ Million), Price (US$/Unit) and Gross Margin (2017-2022)
- Table 150. Amway(Nutrilite XS ) Sports Nutritional Supplements Product
- Table 151. Amway(Nutrilite XS ) Recent Development
- Table 152. MaxiNutritionMaxiNutrition KRÜGER GROUPMaxiNutrition KRÜGER GROUPRMaxiNutrition KRÜGER GROUPGER GROUPMaxiNutrition KRÜGER GROUP Corporation Information
- Table 153. MaxiNutritionMaxiNutrition KRÜGER GROUPMaxiNutrition KRÜGER GROUPRMaxiNutrition KRÜGER GROUPGER GROUPMaxiNutrition KRÜGER GROUP Introduction and Business Overview
- Table 154. MaxiNutritionMaxiNutrition KRÜGER GROUPMaxiNutrition KRÜGER GROUPRMaxiNutrition KRÜGER GROUPGER GROUPMaxiNutrition KRÜGER GROUP Sports Nutritional Supplements Sales (M Units), Revenue (US$ Million), Price (US$/Unit) and Gross Margin (2017-2022)
- Table 155. MaxiNutritionMaxiNutrition KRÜGER GROUPMaxiNutrition KRÜGER GROUPRMaxiNutrition KRÜGER GROUPGER GROUPMaxiNutrition KRÜGER GROUP Sports Nutritional Supplements Product
- Table 156. BPI Sports Corporation Information
- Table 157. BPI Sports Introduction and Business Overview
- Table 158. BPI Sports Sports Nutritional Supplements Sales (M Units), Revenue (US$ Million), Price (US$/Unit) and Gross Margin (2017-2022)
- Table 159. BPI Sports Sports Nutritional Supplements Product
- Table 160. BY-Health Co Ltd Corporation Information
- Table 161. BY-Health Co Ltd Introduction and Business Overview
- Table 162. BY-Health Co Ltd Sports Nutritional Supplements Sales (M Units), Revenue (US$ Million), Price (US$/Unit) and Gross Margin (2017-2022)
- Table 163. BY-Health Co Ltd Sports Nutritional Supplements Product
- Table 164. BY-Health Co Ltd Recent Development
- Table 165. Science in Sports Corporation Information
- Table 166. Science in Sports Introduction and Business Overview
- Table 167. Science in Sports Sports Nutritional Supplements Sales (M Units), Revenue (US$ Million), Price (US$/Unit) and Gross Margin (2017-2022)
- Table 168. Science in Sports Sports Nutritional Supplements Product
- Table 169. Competitor(CPT) Corporation Information
- Table 170. Competitor(CPT) Introduction and Business Overview
- Table 171. Competitor(CPT) Sports Nutritional Supplements Sales (M Units), Revenue (US$ Million), Price (US$/Unit) and Gross Margin (2017-2022)
- Table 172. Competitor(CPT) Sports Nutritional Supplements Product
- Table 173. Key Raw Materials Lists
- Table 174. Raw Materials Key Suppliers Lists
- Table 175. Sports Nutritional Supplements Market Trends
- Table 176. Sports Nutritional Supplements Market Drivers
- Table 177. Sports Nutritional Supplements Market Challenges
- Table 178. Sports Nutritional Supplements Market Restraints
- Table 179. Sports Nutritional Supplements Distributors List
- Table 180. Sports Nutritional Supplements Downstream Customers
- Table 181. Research Programs/Design for This Report
- Table 182. Key Data Information from Secondary Sources
- Table 183. Key Data Information from Primary Sources
List of Figures
- Figure 1. Sports Nutritional Supplements Product Picture
- Figure 2. Global Sports Nutritional Supplements Market Size, 2017 VS 2021 VS 2028 (US$ Million)
- Figure 3. Global Sports Nutritional Supplements Market Size Status and Outlook (2017-2028) & (US$ Million)
- Figure 4. Global Sports Nutritional Supplements Sales Status and Outlook (2017-2028) & (M Units)
- Figure 5. Product Picture of Creatine
- Figure 6. Global Creatine Sales YoY Growth (2017-2028) & (M Units)
- Figure 7. Product Picture of Proteins
- Figure 8. Global Proteins Sales YoY Growth (2017-2028) & (M Units)
- Figure 9. Product Picture of Amino Acid
- Figure 10. Global Amino Acid Sales YoY Growth (2017-2028) & (M Units)
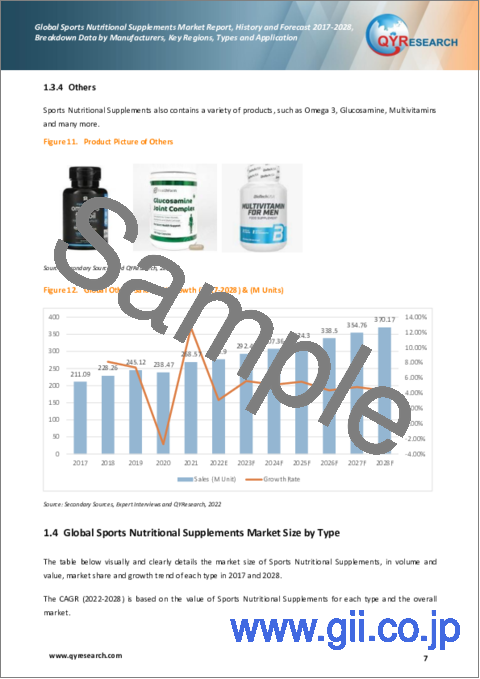
- Figure 11. Product Picture of Others
- Figure 12. Global Others Sales YoY Growth (2017-2028) & (M Units)
- Figure 13. Global Sports Nutritional Supplements Sales by Type (2017-2028) & (US$ Million)
- Figure 14. Global Sports Nutritional Supplements Market Share by Type in 2021 & 2028
- Figure 15. North America Sports Nutritional Supplements Sales Market Share in Volume by Type in 2021
- Figure 16. Europe Sports Nutritional Supplements Sales Market Share in Volume by Type in 2021
- Figure 17. Asia-Pacific Sports Nutritional Supplements Sales Market Share in Volume by Type in 2021
- Figure 18. Latin America Sports Nutritional Supplements Sales Market Share in Volume by Type in 2021
- Figure 19. Middle East and Africa Sports Nutritional Supplements Sales Market Share in Volume by Type in 2021
- Figure 20. The 5 and 10 Largest Manufacturers in the World: Market Share by Sports Nutritional Supplements Sales in 2021
- Figure 21. The 5 and 10 Largest Manufacturers in the World: Market Share by Sports Nutritional Supplements Revenue in 2021
- Figure 22. Global Online Sale Sales YoY Growth (2017-2028) & (M Units)
- Figure 23. Global Offline Sale Sales YoY Growth (2017-2028) & (M Units)
- Figure 24. Global Sports Nutritional Supplements Sales By Sales Channel (2017-2028) & (US$ Million)
- Figure 25. Global Sports Nutritional Supplements Market Share By Sales Channel in 2021 & 2028
- Figure 26. North America Sports Nutritional Supplements Sales Market Share in Volume By Sales Channel in 2021
- Figure 27. Europe Sports Nutritional Supplements Sales Market Share in Volume By Sales Channel in 2021
- Figure 28. Asia-Pacific Sports Nutritional Supplements Sales Market Share in Volume By Sales Channel in 2021
- Figure 29. Latin America Sports Nutritional Supplements Sales Market Share in Volume By Sales Channel in 2021
- Figure 30. Middle East and Africa Sports Nutritional Supplements Sales Market Share in Volume By Sales Channel in 2021
- Figure 31. Sports Nutritional Supplements Manufacturing Cost Structure
- Figure 32. Sports Nutritional Supplements Industrial Chain Analysis
- Figure 33. Channels of Distribution
- Figure 34. Distributors Profiles
- Figure 35. Bottom-up and Top-down Approaches for This Report
- Figure 36. Data Triangulation
- Figure 37. Key Executives Interviewed
Market Analysis and Insights:
Due to the COVID-19 pandemic, the global Sports Nutritional Supplements market size was value at US$ 32,541.39 million in 2021 and is forecast to be a readjusted size of US$ 48,892.10 million by 2028 with a CAGR of 6.35% during the forecast period 2022-2028.
The global main manufacturers of Sports Nutritional Supplements include Glanbia Nutritionals, BellRing Brands, Cellucor, Herbalife Nutrition, Nestlé, Abbott Nutrition, Xiwang Foodstuffs, CytoSport , and Clif Bar, etc. In 2021, the global six largest players have a share approximately 14% in terms of revenue.
The North America Sports Nutritional Supplements market size was US$ 14,760.80 million in 2021. As for the Europe Sports Nutritional Supplements landscape, Germany is projected to reach US$ 3,421.96 million by 2028. and in Asia, the notable markets are Japan and South Korea, CAGR is 5.78% and 7.77% respectively for the next 6-year period.
Fully considering the economic change by the COVID-19, Creatine accounting for 8.55% of the Sports Nutritional Supplements global market in 2021, is projected to value US$ 4988.20 million by 2028.
Scope and Market Size:
The global Sports Nutritional Supplements market is segmented by region (country), company, by Type, and By Sales Channel. Players, stakeholders, and other participants in the global Sports Nutritional Supplements market will be able to gain the upper hand as they use the report as a powerful resource. The segmental analysis focuses on sales, revenue and forecast by region (country), by Type, and By Sales Channel for the period 2017-2028.
By Company
- Glanbia Nutritionals
- BellRing Brands
- Cellucor
- Herbalife Nutrition
- Nestlé
- Abbott Nutrition
- Xiwang Foodstuffs
- CytoSport
- Clif Bar
- Quest Nutrition
- NOW Foods
- Amway(Nutrilite XS )
- MaxiNutrition (KRÜGER GROUP)
- BPI Sports
- By-Health
- Science in Sports
- Competitor(CPT)
Segment by Type
- Creatine
- Proteins
- Amino Acid
- Others
Segment By Sales Channel
- Online Sale
- Offline Sale
By Region
- North America
- United States
- Canada
- Asia-Pacific
- China
- Japan
- South Korea
- India
- Australia
- China Taiwan
- Indonesia
- Thailand
- Malaysia
- Europe
- Germany
- France
- U.K.
- Italy
- Russia
- Latin America
- Mexico
- Brazil
- Argentina
- Colombia
- Middle East & Africa
- Turkey
- Saudi Arabia
- UAE
TABLE OF CONTENTS
1 Sports Nutritional Supplements Market Overview
- 1.1 Sports Nutritional Supplements Product Overview
- 1.2 Top-down and bottom-up approaches are used to validate the global Sports Nutritional Supplements market size and to estimate the market size for company, regional division, product type and application (end users). In the complete market engineering process, both top-down and bottom-up approaches along with several data triangulation methods have been extensively utilized to perform market estimation and market forecast for the overall market division and subdivision listed in this report. Extensive qualitative and further quantitative analysis has also been done from all the numbers arrived at in the complete market engineering process to list key information throughout the report.
- 1.3 Sports Nutritional Supplements Market Segment by Type
- 1.3.1 Creatine
- 1.3.2 Proteins
- 1.3.3 Amino Acid
- 1.3.4 Others
- 1.4 Global Sports Nutritional Supplements Market Size by Type
- 1.4.1 Global Sports Nutritional Supplements Market Size Overview by Type (2017-2028)
- 1.4.2 Global Sports Nutritional Supplements Historic Market Size Review by Type (2017-2022)
- 1.4.3 Global Sports Nutritional Supplements Forecasted Market Size by Type (2023-2028)
- 1.5 Key Regions Market Size Segment by Type
- 1.5.1 North America Sports Nutritional Supplements Sales Breakdown by Type (2017-2022)
- 1.5.2 Europe Sports Nutritional Supplements Sales Breakdown by Type (2017-2022)
- 1.5.3 Asia-Pacific Sports Nutritional Supplements Sales Breakdown by Type (2017-2022)
- 1.5.4 Latin America Sports Nutritional Supplements Sales Breakdown by Type (2017-2022)
- 1.5.5 Middle East and Africa Sports Nutritional Supplements Sales Breakdown by Type (2017-2022)
2 Sports Nutritional Supplements Market Competition by Company
- 2.1 Global Top Players by Sports Nutritional Supplements Sales (2017-2022)
- 2.2 Global Top Players by Sports Nutritional Supplements Revenue (2017-2022)
- 2.3 Global Top Players by Sports Nutritional Supplements Price (2017-2022)
- 2.4 Global Top Manufacturers Sports Nutritional Supplements Headquarters Distribution, Sales Area, Product Type
- 2.5 Sports Nutritional Supplements Market Competitive Situation and Trends
- 2.5.1 Sports Nutritional Supplements Market Concentration Rate (2017-2022)
- 2.5.2 Global 5 and 10 Largest Manufacturers by Sports Nutritional Supplements Sales and Revenue in 2021
- 2.6 Global Top Manufacturers by Company Type (Tier 1, Tier 2, and Tier 3) & (based on the Revenue in Sports Nutritional Supplements as of 2021)
- 2.7 Date of Establishment of Key Manufacturers Market
- 2.8 Key Manufacturers Sports Nutritional Supplements Product Offered
3 Sports Nutritional Supplements Status and Outlook by Region
- 3.1 Global Sports Nutritional Supplements Market Size and CAGR by Region: 2017 VS 2021 VS 2028
- 3.2 Global Sports Nutritional Supplements Historic Market Size by Region
- 3.2.1 Global Sports Nutritional Supplements Sales in Volume by Region (2017-2022)
- 3.2.2 Global Sports Nutritional Supplements Sales in Value by Region (2017-2022)
- 3.2.3 Global Sports Nutritional Supplements Sales (Volume & Value), Price and Gross Margin (2017-2022)
- 3.3 Global Sports Nutritional Supplements Forecasted Market Size by Region
- 3.3.1 Global Sports Nutritional Supplements Sales in Volume by Region (2023-2028)
- 3.3.2 Global Sports Nutritional Supplements Sales in Value by Region (2023-2028)
- 3.3.3 Global Sports Nutritional Supplements Sales (Volume & Value), Price and Gross Margin (2023-2028)
4 Sports Nutritional Supplements By Sales Channel
- 4.1 Sports Nutritional Supplements Market Segment By Sales Channel
- 4.1.1 Online Sale
- 4.1.2 Offline Sale
- 4.2 Global Sports Nutritional Supplements Market Size By Sales Channel
- 4.2.1 Global Sports Nutritional Supplements Market Size Overview By Sales Channel (2017-2028)
- 4.2.2 Global Sports Nutritional Supplements Historic Market Size Review By Sales Channel (2017-2022)
- 4.2.3 Global Sports Nutritional Supplements Forecasted Market Size By Sales Channel (2023-2028)
- 4.3 Key Regions Market Size Segment By Sales Channel
- 4.3.1 North America Sports Nutritional Supplements Sales Breakdown By Sales Channel (2017-2022)
- 4.3.2 Europe Sports Nutritional Supplements Sales Breakdown By Sales Channel (2017-2022)
- 4.3.3 Asia-Pacific Sports Nutritional Supplements Sales Breakdown By Sales Channel (2017-2022)
- 4.3.4 Latin America Sports Nutritional Supplements Sales Breakdown By Sales Channel (2017-2022)
- 4.3.5 Middle East and Africa Sports Nutritional Supplements Sales Breakdown By Sales Channel (2017-2022)
5 North America Sports Nutritional Supplements by Country
- 5.1 North America Sports Nutritional Supplements Historic Market Size by Country
- 5.1.1 North America Sports Nutritional Supplements Sales in Volume by Country (2017-2022)
- 5.1.2 North America Sports Nutritional Supplements Sales in Value by Country (2017-2022)
- 5.2 North America Sports Nutritional Supplements Forecasted Market Size by Country
- 5.2.1 North America Sports Nutritional Supplements Sales in Volume by Country (2023-2028)
- 5.2.2 North America Sports Nutritional Supplements Sales in Value by Country (2023-2028)
6 Europe Sports Nutritional Supplements by Country
- 6.1 Europe Sports Nutritional Supplements Historic Market Size by Country
- 6.1.1 Europe Sports Nutritional Supplements Sales in Volume by Country (2017-2022)
- 6.1.2 Europe Sports Nutritional Supplements Sales in Value by Country (2017-2022)
- 6.2 Europe Sports Nutritional Supplements Forecasted Market Size by Country
- 6.2.1 Europe Sports Nutritional Supplements Sales in Volume by Country (2023-2028)
- 6.2.2 Europe Sports Nutritional Supplements Sales in Value by Country (2023-2028)
7 Asia-Pacific Sports Nutritional Supplements by Region
- 7.1 Asia-Pacific Sports Nutritional Supplements Historic Market Size by Region
- 7.1.1 Asia-Pacific Sports Nutritional Supplements Sales in Volume by Region (2017-2022)
- 7.1.2 Asia-Pacific Sports Nutritional Supplements Sales in Value by Region (2017-2022)
- 7.2 Asia-Pacific Sports Nutritional Supplements Forecasted Market Size by Region
- 7.2.1 Asia-Pacific Sports Nutritional Supplements Sales in Volume by Region (2023-2028)
- 7.2.2 Asia-Pacific Sports Nutritional Supplements Sales in Value by Region (2023-2028)
8 Latin America Sports Nutritional Supplements by Country
- 8.1 Latin America Sports Nutritional Supplements Historic Market Size by Country
- 8.1.1 Latin America Sports Nutritional Supplements Sales in Volume by Country (2017-2022)
- 8.1.2 Latin America Sports Nutritional Supplements Sales in Value by Country (2017-2022)
- 8.2 Latin America Sports Nutritional Supplements Forecasted Market Size by Country
- 8.2.1 Latin America Sports Nutritional Supplements Sales in Volume by Country (2023-2028)
- 8.2.2 Latin America Sports Nutritional Supplements Sales in Value by Country (2023-2028)
9 Middle East and Africa Sports Nutritional Supplements by Country
- 9.1 Middle East and Africa Sports Nutritional Supplements Historic Market Size by Country
- 9.1.1 Middle East and Africa Sports Nutritional Supplements Sales in Volume by Country (2017-2022)
- 9.1.2 Middle East and Africa Sports Nutritional Supplements Sales in Value by Country (2017-2022)
- 9.2 Middle East and Africa Sports Nutritional Supplements Forecasted Market Size by Country
- 9.2.1 Middle East and Africa Sports Nutritional Supplements Sales in Volume by Country (2023-2028)
- 9.2.2 Middle East and Africa Sports Nutritional Supplements Sales in Value by Country (2023-2028)
10 Company Profiles and Key Figures in Sports Nutritional Supplements Business
- 10.1 Glanbia Nutritionals
- 10.1.1 Glanbia Nutritionals Corporation Information
- 10.1.2 Glanbia Nutritionals Introduction and Business Overview
- 10.1.3 Glanbia Nutritionals Sports Nutritional Supplements Sales, Revenue and Gross Margin (2017-2022)
- 10.1.4 Glanbia Nutritionals Sports Nutritional Supplements Products Offered
- 10.1.5 Glanbia Nutritionals Recent Development
- 10.2 BellRing Brands(Dymatize Enterprises)
- 10.2.1 BellRing Brands(Dymatize Enterprises) Corporation Information
- 10.2.2 BellRing Brands(Dymatize Enterprises) Introduction and Business Overview
- 10.2.3 BellRing Brands(Dymatize Enterprises) Sports Nutritional Supplements Sales, Revenue and Gross Margin (2017-2022)
- 10.2.4 BellRing Brands(Dymatize Enterprises) Sports Nutritional Supplements Products Offered
- 10.3 Cellucor
- 10.3.1 Cellucor Corporation Information
- 10.3.2 Cellucor Introduction and Business Overview
- 10.3.3 Cellucor Sports Nutritional Supplements Sales, Revenue and Gross Margin (2017-2022)
- 10.3.4 Cellucor Sports Nutritional Supplements Products Offered
- 10.4 Herbalife Nutrition
- 10.4.1 Herbalife Nutrition Corporation Information
- 10.4.2 Herbalife Nutrition Introduction and Business Overview
- 10.4.3 Herbalife Nutrition Sports Nutritional Supplements Sales, Revenue and Gross Margin (2017-2022)
- 10.4.4 Herbalife Nutrition Sports Nutritional Supplements Products Offered
- 10.4.5 Herbalife Nutrition Recent Development
- 10.5 Nestlé
- 10.5.1 Nestlé Corporation Information
- 10.5.2 Nestlé Introduction and Business Overview
- 10.5.3 Nestlé Sports Nutritional Supplements Sales, Revenue and Gross Margin (2017-2022)
- 10.5.4 Nestlé Sports Nutritional Supplements Products Offered
- 10.5.5 Nestlé Recent Development
- 10.6 Abbott Nutrition
- 10.6.1 Abbott Nutrition Corporation Information
- 10.6.2 Abbott Nutrition Introduction and Business Overview
- 10.6.3 Abbott Nutrition Sports Nutritional Supplements Sales, Revenue and Gross Margin (2017-2022)
- 10.6.4 Abbott Nutrition Sports Nutritional Supplements Products Offered
- 10.6.5 Abbott Nutrition Recent Development
- 10.7 Xiwang Foodstuffs Co., Ltd.
- 10.7.1 Xiwang Foodstuffs Co., Ltd. Corporation Information
- 10.7.2 Xiwang Foodstuffs Co., Ltd. Introduction and Business Overview
- 10.7.3 Xiwang Foodstuffs Co., Ltd. Sports Nutritional Supplements Sales, Revenue and Gross Margin (2017-2022)
- 10.7.4 Xiwang Foodstuffs Co., Ltd. Sports Nutritional Supplements Products Offered
- 10.7.5 Xiwang Foodstuffs Co., Ltd. Recent Development
- 10.8 CytoSport
- 10.8.1 CytoSport Corporation Information
- 10.8.2 CytoSport Introduction and Business Overview
- 10.8.3 CytoSport Sports Nutritional Supplements Sales, Revenue and Gross Margin (2017-2022)
- 10.8.4 CytoSport Sports Nutritional Supplements Products Offered
- 10.9 Clif Bar
- 10.9.1 Clif Bar Corporation Information
- 10.9.2 Clif Bar Introduction and Business Overview
- 10.9.3 Clif Bar Sports Nutritional Supplements Sales, Revenue and Gross Margin (2017-2022)
- 10.9.4 Clif Bar Sports Nutritional Supplements Products Offered
- 10.10 Quest Nutrition
- 10.10.1 Quest Nutrition Corporation Information
- 10.10.2 Quest Nutrition Introduction and Business Overview
- 10.10.3 Quest Nutrition Sports Nutritional Supplements Sales, Revenue and Gross Margin (2017-2022)
- 10.10.4 Quest Nutrition Sports Nutritional Supplements Products Offered
- 10.11 NOW Foods
- 10.11.1 NOW Foods Corporation Information
- 10.11.2 NOW Foods Introduction and Business Overview
- 10.11.3 NOW Foods Sports Nutritional Supplements Sales, Revenue and Gross Margin (2017-2022)
- 10.11.4 NOW Foods Sports Nutritional Supplements Products Offered
- 10.11.5 NOW Foods Recent Development
- 10.12 Amway(Nutrilite XS )
- 10.12.1 Amway(Nutrilite XS ) Corporation Information
- 10.12.2 Amway(Nutrilite XS ) Introduction and Business Overview
- 10.12.3 Amway(Nutrilite XS ) Sports Nutritional Supplements Sales, Revenue and Gross Margin (2017-2022)
- 10.12.4 Amway(Nutrilite XS ) Sports Nutritional Supplements Products Offered
- 10.12.5 Amway(Nutrilite XS ) Recent Development
- 10.13 MaxiNutrition (KRÜGER GROUP)
- 10.13.1 MaxiNutrition (KRÜGER GROUP) Corporation Information
- 10.13.2 MaxiNutrition (KRÜGER GROUP) Introduction and Business Overview
- 10.13.3 MaxiNutrition (KRÜGER GROUP) Sports Nutritional Supplements Sales, Revenue and Gross Margin (2017-2022)
- 10.13.4 MaxiNutrition (KRÜGER GROUP) Sports Nutritional Supplements Products Offered
- 10.14 BPI Sports
- 10.14.1 BPI Sports Corporation Information
- 10.14.2 BPI Sports Introduction and Business Overview
- 10.14.3 BPI Sports Sports Nutritional Supplements Sales, Revenue and Gross Margin (2017-2022)
- 10.14.4 BPI Sports Sports Nutritional Supplements Products Offered
- 10.15 BY-Health Co Ltd
- 10.15.1 BY-Health Co Ltd Corporation Information
- 10.15.2 BY-Health Co Ltd Introduction and Business Overview
- 10.15.3 BY-Health Co Ltd Sports Nutritional Supplements Sales, Revenue and Gross Margin (2017-2022)
- 10.15.4 BY-Health Co Ltd Sports Nutritional Supplements Products Offered
- 10.15.5 BY-Health Co Ltd Recent Development
- 10.16 Science in Sports
- 10.16.1 Science in Sports Corporation Information
- 10.16.2 Science in Sports Introduction and Business Overview
- 10.16.3 Science in Sports Sports Nutritional Supplements Sales, Revenue and Gross Margin (2017-2022)
- 10.16.4 Science in Sports Sports Nutritional Supplements Products Offered
- 10.17 Competitor(CPT)
- 10.17.1 Competitor(CPT) Corporation Information
- 10.17.2 Competitor(CPT) Introduction and Business Overview
- 10.17.3 Competitor(CPT) Sports Nutritional Supplements Sales, Revenue and Gross Margin (2017-2022)
- 10.17.4 Competitor(CPT) Sports Nutritional Supplements Products Offered
11 Upstream, Opportunities, Challenges, Risks and Influences Factors Analysis
- 11.1 Sports Nutritional Supplements Key Raw Materials
- 11.1.1 Key Raw Materials
- 11.1.2 Raw Materials Key Suppliers
- 11.2 Manufacturing Cost Structure
- 11.2.1 Raw Materials
- 11.2.2 Labor Cost
- 11.2.3 Manufacturing Expenses
- 11.3 Sports Nutritional Supplements Industrial Chain Analysis
- 11.4 Sports Nutritional Supplements Market Dynamics
- 11.4.1 Sports Nutritional Supplements Industry Trends
- 11.4.2 Sports Nutritional Supplements Market Drivers
- 11.4.3 Sports Nutritional Supplements Market Challenges
- 11.4.4 Sports Nutritional Supplements Market Restraints
12 Marketing Strategy Analysis, Distributors
- 12.1 Sales Channel
- 12.2 Sports Nutritional Supplements Distributors
- 12.3 Sports Nutritional Supplements Downstream Customers
13 Research Findings and Conclusion
14 Appendix
- 14.1 Research Methodology
- 14.1.1 Methodology/Research Approach
- 14.1.2 Data Source
- 14.2 Author Details
- 14.3 Disclaimer