|
|
市場調査レポート
商品コード
1100616
球状シリカフィラーの世界市場の分析 (2022年)Global Spherical Silica Fillers Market Research Report 2022 |
||||||
|
|
|||||||
|
● お客様のご希望に応じて、既存データの加工や未掲載情報(例:国別セグメント)の追加などの対応が可能です。 詳細はお問い合わせください。 |
|||||||


| 球状シリカフィラーの世界市場の分析 (2022年) |
|
出版日: 2022年07月12日
発行: QYResearch
ページ情報: 英文 151 Pages
納期: 2~3営業日
|
- 全表示
- 概要
- 図表
- 目次
世界の球状シリカフィラーの市場規模は、2021年に5億1,353万米ドルに達した後、2022年から2028年の間に6.27%のCAGRで成長し、2028年末までに8億1,676万米ドルに達すると予測されています。
当レポートでは、世界の球状シリカフィラーの市場について分析し、種類別・用途別・地域別 (国別) の市場動向の見通し (2017年~2028年)、主要企業のプロファイルなどについて調査しております。
目次
第1章 球状シリカフィラー:市場概要
- 球状シリカフィラー:製品の概要と範囲
- 種類別のセグメント
- 市場規模・成長率の分析:種類別 (2022年・2028年)
- 0.01~10μm
- 10~20μm
- 20μm以上
- 用途別のセグメント
- 市場規模・成長率の分析:用途別 (2022年・2028年)
- EMC
- CCL
- MUF
- 世界市場の成長見通し
- 世界の球状シリカフィラーの収益:推定・予測 (2017年~2028年)
- 世界の球状シリカフィラーの生産能力:推定・予測 (2017年~2028年)
- 世界の球状シリカフィラーの生産:推定・予測 (2017年~2028年)
- 地域別の市場規模
- 世界の球状シリカフィラーの市場規模:推定・予測、地域別 (2017年・2022年・2028年)
- 米国:推定・予測 (2017年~2028年)
- 東南アジア:推定・予測 (2017年~2028年)
- 中国:推定・予測 (2017年~2028年)
- 日本:推定・予測 (2017年~2028年)
- 韓国:推定・予測 (2017年~2028年)
第2章 メーカー別の市場競争
- 世界の球状シリカフィラーの生産能力・市場シェア:メーカー別 (2017年~2022年)
- 世界の球状シリカフィラーの収益・市場シェア:メーカー別 (2017年~2022年)
- 市場シェア:企業の種類別 (ティア1、ティア2、ティア3)
- 世界の球状シリカフィラーの平均価格:メーカー別 (2017年~2022年)
- 球状シリカフィラーメーカーの製造拠点・提供エリア
- 球状シリカフィラー市場の競争状況と動向
第3章 地域別の生産能力
- 世界の球状シリカフィラーの生産能力・市場シェア:地域別 (2017年~2022年)
- 世界の球状シリカフィラーの収益・市場シェア:地域別 (2017年~2022年)
- 世界の球状シリカフィラーの生産能力・収益・価格・粗利益 (2017年~2022年)
- 米国の球状シリカフィラーの生産
- 東南アジアの球状シリカフィラーの生産
- 中国の球状シリカフィラーの生産 (2017年~2022年)
- 日本の球状シリカフィラーの生産 (2017年~2022年)
- 韓国の球状シリカフィラーの生産 (2017年~2022年)
第4章 球状シリカフィラー:地域別の消費
- 世界の球状シリカフィラーの消費:地域別
- 消費:地域別
- 消費・市場シェア:地域別
- 北米
- 米国
- カナダ
- 欧州
- ドイツ
- フランス
- 英国
- ベルギー
- オランダ
- アジア太平洋
- 中国
- 日本
- 韓国
- 台湾
- 東南アジア
- ラテンアメリカ
- メキシコ
- ブラジル
第5章 種類別のセグメント
- 球状シリカフィラーの生産・市場シェア:種類別 (2017年~2022年)
- 球状シリカフィラーの収益・市場シェア:種類別 (2017年~2022年)
- 球状シリカフィラーの価格:種類別 (2017年~2022年)
第6章 用途別のセグメント
- 球状シリカフィラーの生産・市場シェア:用途別 (2017年~2022年)
- 球状シリカフィラーの収益・市場シェア:用途別 (2017年~2022年)
- 球状シリカフィラーの価格:用途別 (2017年~2022年)
第7章 主要企業のプロファイル
- MICRON
- 企業情報
- 製品ポートフォリオ
- 生産能力・収益・価格・粗利益 (2017年~2022年)
- 主要事業・市場
- DENKA
- TATSUMORI
- ADMATECHS
- SHIN-ETSU CHEMICAL
- IMERYS
- SIBELCO
- JIANGSU YOKE TECHNOLOGY
- NOVORAY
第8章 球状シリカフィラーの製造コストの分析
- 球状シリカフィラーの主要原材料の分析
- 製造コストの構造比率
- 球状シリカフィラーの製造プロセスの分析
- 球状シリカフィラーの産業チェーンの分析
第9章 マーケティングチャネル・流通業者・顧客
- マーケティングチャネル
- 球状シリカフィラーの流通業者の一覧
- 球状シリカフィラーの顧客
第10章 球状シリカフィラー市場:市場力学
- 球状シリカフィラー業界の動向
- 球状シリカフィラー市場の促進要因
- 球状シリカフィラー市場の課題
- 球状シリカフィラー市場の抑制要因
第11章 生産・供給予測
- 世界の球状シリカフィラーの生産予測:地域別 (2023年~2028年)
- 米国:生産・収益予測 (2023年~2028年)
- 東南アジア:生産・収益予測 (2023年~2028年)
- 中国:生産・収益予測 (2023年~2028年)
- 日本:生産・収益予測 (2023年~2028年)
- 韓国:生産・収益予測 (2023年~2028年)
第12章 消費・需要予測
- 世界の球状シリカフィラーの予測・需要分析
- 北米:消費予測、国別
- 欧州:消費予測、国別
- アジア太平洋:消費予測、地域別
- ラテンアメリカ:消費予測、国別
第13章 種類別・用途別の予測
- 世界の生産・収益・価格予測:種類別 (2023年~2028年)
- 世界の生産・収益・価格予測:用途別 (2023年~2028年)
第14章 調査結果と結論
第15章 調査手法とデータソース
LIST OF TABLES
- Table 1. Global Spherical Silica Fillers Market Size by Type (MT) & (US$ Million) & (2022 VS 2028)
- Table 2. Admatechs Product Picture of 0.01渭m-10渭m
- Table 3. Micron Product Description of 10渭m-20渭m
- Table 4. Global Spherical Silica Fillers Market Size by Application (MT) & (US$ Million) & (2022 VS 2028)
- Table 5. Epoxy Molding Compounds Manufacturing Base Distribution and Headquarters
- Table 6. Types of CCL Based on Base Material
- Table 7. Manufacturers Copper Clad Laminate Production Sites and Area Served
- Table 8. Global Copper Clad Laminate Consumption (Million USD) Comparison by Applications
- Table 9. Product Requirement for Spherical Silica Used in High Frequency and High-Speed CCL
- Table 10. Spherical Silica Fillers Market Size Comparison by Region: 2017 VS 2022 VS 2028 (US$ Million)
- Table 11. Global Spherical Silica Fillers Production Capacity (MT) by Manufacturers in 2021
- Table 12. Global Spherical Silica Fillers Production by Manufacturers (2017-2022) & (MT)
- Table 13. Global Spherical Silica Fillers Production Market Share by Manufacturers (2017-2022)
- Table 14. Global Spherical Silica Fillers Revenue by Manufacturers (2017-2022) & (US$ Million)
- Table 15. Global Spherical Silica Fillers Revenue Share by Manufacturers (2017-2022)
- Table 16. Company Type (Tier 1, Tier 2, and Tier 3) & (based on the Revenue in Spherical Silica Fillers as of 2021)
- Table 17. Global Market Spherical Silica Fillers Average Price (USD/Kg) of Key Manufacturers (2017-2022)
- Table 18. Manufacturers Spherical Silica Fillers Production Sites and Area Served
- Table 19. Global Spherical Silica Fillers Manufacturers Market Concentration Ratio (CR5 and HHI)
- Table 20. Mergers & Acquisitions, Expansion Plans
- Table 21. Global Spherical Silica Fillers Production Capacity (MT) by Region (2017-2022)
- Table 22. Global Spherical Silica Fillers Production (MT) by Region (2017-2022)
- Table 23. Global Spherical Silica Fillers Production Market Share by Region (2017-2022)
- Table 24. Global Spherical Silica Fillers Revenue (US$ Million) by Region (2017-2022)
- Table 25. Global Spherical Silica Fillers Revenue Market Share by Region (2017-2022)
- Table 26. Global Spherical Silica Fillers Production Capacity (MT), Revenue (US$ Million), Price (USD/Kg) and Gross Margin (2017-2022)
- Table 27. USA Spherical Silica Fillers Production Capacity (MT), Revenue (US$ Million), Price (USD/Kg) and Gross Margin (2017-2022)
- Table 28. Southeast Asia Spherical Silica Fillers Production Capacity (MT), Revenue (US$ Million), Price (USD/Kg) and Gross Margin (2017-2022)
- Table 29. China Spherical Silica Fillers Production Capacity (MT), Revenue (US$ Million), Price (USD/Kg) and Gross Margin (2017-2022)
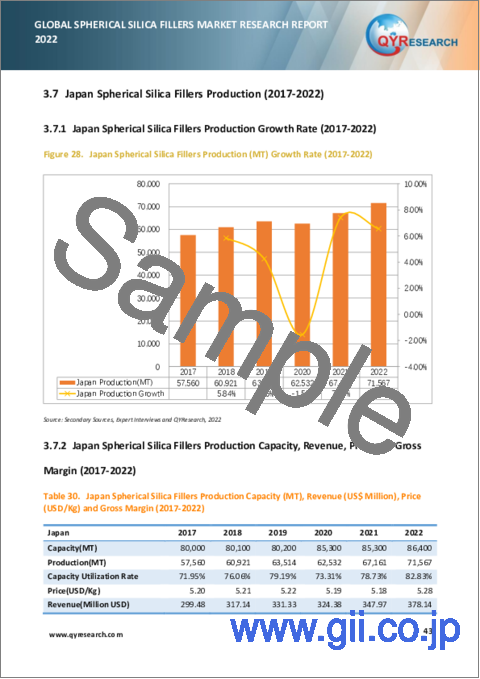
- Table 30. Japan Spherical Silica Fillers Production Capacity (MT), Revenue (US$ Million), Price (USD/Kg) and Gross Margin (2017-2022)
- Table 31. Korea Spherical Silica Fillers Production Capacity (MT), Revenue (US$ Million), Price (USD/Kg) and Gross Margin (2017-2022)
- Table 32. Global Spherical Silica Fillers Consumption by Region (2017-2022) & (MT)
- Table 33. Global Spherical Silica Fillers Consumption Market Share by Region (2017-2022)
- Table 34. North America Spherical Silica Fillers Consumption by Country (2017-2022) & (MT)
- Table 35. Europe Spherical Silica Fillers Consumption by Country (2017-2022) & (MT)
- Table 36. Asia Pacific Spherical Silica Fillers Consumption by Region (2017-2022) & (MT)
- Table 37. Latin America Spherical Silica Fillers Consumption by Country (2017-2022) & (MT)
- Table 38. Global Spherical Silica Fillers Production (MT) by Type (2017-2022)
- Table 39. Global Spherical Silica Fillers Production Market Share by Type (2017-2022)
- Table 40. Global Spherical Silica Fillers Revenue (US$ Million) by Type (2017-2022)
- Table 41. Global Spherical Silica Fillers Revenue Share by Type (2017-2022)
- Table 42. Global Spherical Silica Fillers Price (USD/Kg) by Type (2017-2022)
- Table 43. Global Spherical Silica Fillers Production (MT) by Application (2017-2022)
- Table 44. Global Spherical Silica Fillers Production Market Share by Application (2017-2022)
- Table 45. Global Spherical Silica Fillers Revenue (US$ Million) by Application (2017-2022)
- Table 46. Global Spherical Silica Fillers Revenue Share by Application (2017-2022)
- Table 47. Global Spherical Silica Fillers Price (USD/Kg) by Application (2017-2022)
- Table 48. Micron Spherical Silica Fillers Corporation Information
- Table 49. Micron Spherical Silica Fillers Specification and Application
- Table 50. Micron Spherical Silica Fillers Production Capacity (MT), Revenue (US$ Million), Price (USD/Kg) and Gross Margin (2017-2022)
- Table 51. Denka Spherical Silica Fillers Corporation Information
- Table 52. Denka Spherical Silica Fillers Specification and Application
- Table 53. Denka Spherical Silica Fillers Production Capacity (MT), Revenue (US$ Million), Price (USD/Kg) and Gross Margin (2017-2022)
- Table 54. Denka Main Business and Markets Served
- Table 55. Tatsumori Spherical Silica Fillers Corporation Information
- Table 56. Tatsumori Spherical Silica Fillers Specification and Application
- Table 57. Tatsumori Spherical Silica Fillers Production Capacity (MT), Revenue (US$ Million), Price (USD/Kg) and Gross Margin (2017-2022)
- Table 58. Admatechs Spherical Silica Fillers Corporation Information
- Table 59. Admatechs Spherical Silica Fillers Specification and Application
- Table 60. Admatechs Spherical Silica Fillers Production Capacity (MT), Revenue (US$ Million), Price (USD/Kg) and Gross Margin (2017-2022)
- Table 61. Admatechs Main Business and Markets Served
- Table 62. Shin-Etsu Chemical Spherical Silica Fillers Corporation Information
- Table 63. Shin-Etsu Chemical Spherical Silica Fillers Specification and Application
- Table 64. Shin-Etsu Chemical Spherical Silica Fillers Production Capacity (MT), Revenue (US$ Million), Price (USD/Kg) and Gross Margin (2017-2022)
- Table 65. Shin-Etsu Chemical Main Business and Markets Served
- Table 66. Imerys Spherical Silica Fillers Corporation Information
- Table 67. Imerys Spherical Silica Fillers Specification and Application
- Table 68. Imerys Spherical Silica Fillers Production Capacity (MT), Revenue (US$ Million), Price (USD/Kg) and Gross Margin (2017-2022)
- Table 69. Sibelco Spherical Silica Fillers Corporation Information
- Table 70. Sibelco Spherical Silica Fillers Specification and Application
- Table 71. Sibelco Spherical Silica Fillers Production Capacity (MT), Revenue (US$ Million), Price (USD/Kg) and Gross Margin (2017-2022)
- Table 72. Sibelco Main Business and Markets Served
- Table 73. Jiangsu Yoke Technology Spherical Silica Fillers Corporation Information
- Table 74. Jiangsu Yoke Technology Spherical Silica Fillers Specification and Application
- Table 75. Jiangsu Yoke Technology Spherical Silica Fillers Production Capacity (MT), Revenue (US$ Million), Price (USD/Kg) and Gross Margin (2017-2022)
- Table 76. NOVORAY Spherical Silica Fillers Corporation Information
- Table 77. NOVORAY Spherical Silica Fillers Specification and Application
- Table 78. NOVORAY Spherical Silica Fillers Production Capacity (MT), Revenue (US$ Million), Price (USD/Kg) and Gross Margin (2017-2022)
- Table 79. Production Base and Market Concentration Rate of Raw Material
- Table 80. Key Suppliers of Raw Materials
- Table 81. Spherical Silica Fillers Distributors List
- Table 82. Spherical Silica Customers List
- Table 83. KYOCERA Information List
- Table 84. Hitachi Chemical Information List
- Table 85. Samsung SDI Information List
- Table 86. Shin-Etsu Information List
- Table 87. Spherical Silica Fillers Market Trends
- Table 88. Spherical Silica Fillers Market Drivers
- Table 89. Spherical Silica Fillers Market Challenges
- Table 90. Spherical Silica Fillers Market Restraints
- Table 91. Global Spherical Silica Fillers Production (MT) Forecast by Region (2023-2028)
- Table 92. Global Spherical Silica Fillers Production Market Share Forecast by Region (2023-2028)
- Table 93. North America Spherical Silica Fillers Consumption Forecast by Country (2023-2028) & (MT)
- Table 94. Europe Spherical Silica Fillers Consumption Forecast by Country (2023-2028) & (MT)
- Table 95. Asia Pacific Spherical Silica Fillers Consumption Forecast by Region (2023-2028) & (MT)
- Table 96. Latin America Spherical Silica Fillers Consumption Forecast by Country (2023-2028) & (MT)
- Table 97. Global Spherical Silica Fillers Production Forecast by Type (2023-2028) & (MT)
- Table 98. Global Spherical Silica Fillers Production Market Share Forecast by Type (2023-2028)
- Table 99. Global Spherical Silica Fillers Revenue Forecast by Type (2023-2028) & (US$ Million)
- Table 100. Global Spherical Silica Fillers Revenue Market Share Forecast by Type (2023-2028)
- Table 101. Global Spherical Silica Fillers Price Forecast by Type (2023-2028) & (USD/Kg)
- Table 102. Global Spherical Silica Fillers Production Forecast by Application (2023-2028) & (MT)
- Table 103. Global Spherical Silica Fillers Production Market Share Forecast by Application (2023-2028)
- Table 104. Global Spherical Silica Fillers Revenue Forecast by Application (2023-2028) & (US$ Million)
- Table 105. Global Spherical Silica Fillers Revenue Market Share Forecast by Application (2023-2028)
- Table 106. Global Spherical Silica Fillers Price Forecast by Application (2023-2028) & (USD/Kg)
- Table 107. Research Programs/Design for This Report
- Table 108. Key Data Information from Secondary Sources
- Table 109. Key Data Information from Primary Sources
List of Figures
- Figure 1. Product Picture of Spherical Silica Fillers
- Figure 2. Global Spherical Silica Fillers Market Share by Type: 2022 VS 2028
- Figure 3. 0.01渭m-10渭m Product Picture
- Figure 4. Above 20 渭m Product Picture
- Figure 5. Global Spherical Silica Fillers Market Share by Application: 2022 VS 2028
- Figure 6. Filler
- Figure 7. Electronic Packaging Industry Chain
- Figure 8. Product Picture of Copper Clad Laminate
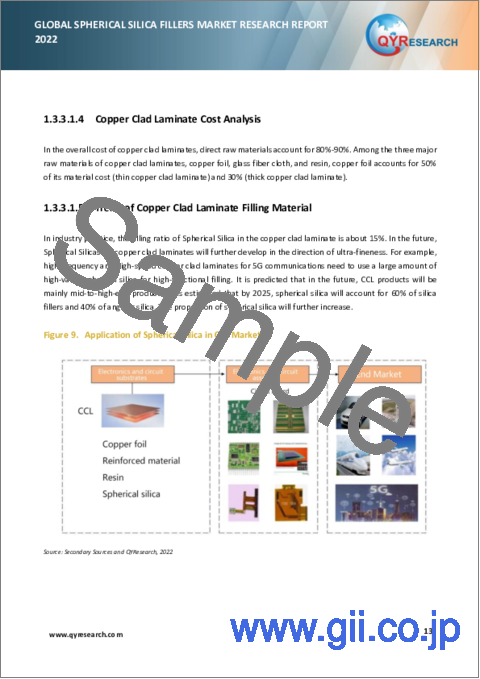
- Figure 9. Application of Spherical Silica in CCL Market
- Figure 10. High Frequency and High-Speed Copper Clad Laminate Constitution
- Figure 11. Schematic Diagram of Underfill 2.5D Use Scene
- Figure 12. Global Spherical Silica Fillers Revenue (US$ Million), 2017 VS 2022 VS 2028
- Figure 13. Global Spherical Silica Fillers Revenue (US$ Million) (2017-2028)
- Figure 14. Global Spherical Silica Fillers Production Capacity (MT) & (2017-2028)
- Figure 15. Global Spherical Silica Fillers Production (MT) & (2017-2028)
- Figure 16. Spherical Silica Fillers Market Size Comparison by Region: 2017 VS 2022 VS 2028 (US$ Million)
- Figure 17. USA Spherical Silica Fillers Revenue (US$ Million) Growth Rate (2017-2028)
- Figure 18. Southeast Asia Spherical Silica Fillers Revenue (US$ Million) Growth Rate (2017-2028)
- Figure 19. China Spherical Silica Fillers Revenue (US$ Million) Growth Rate (2017-2028)
- Figure 20. Japan Spherical Silica Fillers Revenue (US$ Million) Growth Rate (2017-2028)
- Figure 21. Korea Spherical Silica Fillers Revenue (US$ Million) Growth Rate (2017-2028)
- Figure 22. Spherical Silica Fillers Production Share by Manufacturers in 2021
- Figure 23. Global Spherical Silica Fillers Revenue Share by Manufacturers in 2021
- Figure 24. The Global 5 and 3 Largest Players: Market Share by Spherical Silica Fillers Revenue in 2021
- Figure 25. USA Spherical Silica Fillers Production (MT) Growth Rate (2017-2022)
- Figure 26. Southeast Asia Spherical Silica Fillers Production (MT) Growth Rate (2017-2022)
- Figure 27. China Spherical Silica Fillers Production (MT) Growth Rate (2017-2022)
- Figure 28. Japan Spherical Silica Fillers Production (MT) Growth Rate (2017-2022)
- Figure 29. Korea Spherical Silica Fillers Production (MT) Growth Rate (2017-2022)
- Figure 30. Global Spherical Silica Fillers Consumption Market Share by Region (2017-2022)
- Figure 31. North America Spherical Silica Fillers Consumption and Growth Rate (2017-2022) & (MT)
- Figure 32. North America Spherical Silica Fillers Consumption Market Share by Country in 2021
- Figure 33. U.S. Spherical Silica Fillers Consumption and Growth Rate (2017-2022) & (MT)
- Figure 34. Canada Spherical Silica Fillers Consumption (MT) and Growth Rate (2017-2022)
- Figure 35. Europe Spherical Silica Fillers Consumption and Growth Rate (2017-2022) & (MT)
- Figure 36. Europe Spherical Silica Fillers Consumption Market Share by Country in 2021
- Figure 37. Germany Spherical Silica Fillers Consumption and Growth Rate (2017-2022) & (MT)
- Figure 38. France Spherical Silica Fillers Consumption and Growth Rate (2017-2022) & (MT)
- Figure 39. U.K. Spherical Silica Fillers Consumption and Growth Rate (2017-2022) & (MT)
- Figure 40. Belgium Spherical Silica Fillers Consumption and Growth Rate (2017-2022) & (MT)
- Figure 41. Netherlands Spherical Silica Fillers Consumption and Growth Rate (2017-2022) & (MT)
- Figure 42. Asia Pacific Spherical Silica Fillers Consumption and Growth Rate (MT)
- Figure 43. Asia Pacific Spherical Silica Fillers Consumption Market Share by Region in 2021
- Figure 44. China Spherical Silica Fillers Consumption and Growth Rate (2017-2022) & (MT)
- Figure 45. Japan Spherical Silica Fillers Consumption and Growth Rate (2017-2022) & (MT)
- Figure 46. South Korea Spherical Silica Fillers Consumption and Growth Rate (2017-2022) & (MT)
- Figure 47. China Taiwan Spherical Silica Fillers Consumption and Growth Rate (2017-2022) & (MT)
- Figure 48. Southeast Asia Spherical Silica Fillers Consumption and Growth Rate (2017-2022) & (MT)
- Figure 49. Latin America Spherical Silica Fillers Consumption and Growth Rate (MT)
- Figure 50. Latin America Spherical Silica Fillers Consumption Market Share by Country in 2021
- Figure 51. Mexico Spherical Silica Fillers Consumption and Growth Rate (2017-2022) & (MT)
- Figure 52. Brazil Spherical Silica Fillers Consumption and Growth Rate (2017-2022) & (MT)
- Figure 53. Production Market Share of Spherical Silica Fillers by Type (2017-2022)
- Figure 54. Production Market Share of Spherical Silica Fillers by Type in 2021
- Figure 55. Revenue Share of Spherical Silica Fillers by Type (2017-2022)
- Figure 56. Revenue Market Share of Spherical Silica Fillers by Type in 2021
- Figure 57. Production Market Share of Spherical Silica Fillers by Application (2017-2022)
- Figure 58. Production Market Share of Spherical Silica Fillers by Application in 2021
- Figure 59. Revenue Share of Spherical Silica Fillers by Application (2017-2022)
- Figure 60. Revenue Market Share of Spherical Silica Fillers by Application in 2021
- Figure 61. Product Portfolio of NOVORAY
- Figure 62. Manufacturing Cost Structure of Spherical Silica Fillers
- Figure 63. Flame and Fusion Method Manufacturing Process Analysis of Spherical Silica
- Figure 64. VMC Method Manufacturing Process Analysis of Spherical Silica
- Figure 65. Spherical Silica Fillers Industrial Chain Analysis
- Figure 66. Channels of Distribution
- Figure 67. Distributors Profiles
- Figure 68. USA Spherical Silica Fillers Production (MT) Growth Rate Forecast (2023-2028)
- Figure 69. Southeast Asia Spherical Silica Fillers Production (MT) Growth Rate Forecast (2023-2028)
- Figure 70. China Spherical Silica Fillers Production (MT) Growth Rate Forecast (2023-2028)
- Figure 71. Japan Spherical Silica Fillers Production (MT) Growth Rate Forecast (2023-2028)
- Figure 72. Korea Spherical Silica Fillers Production (MT) Growth Rate Forecast (2023-2028)
- Figure 73. Global Forecasted Sales Analysis of Spherical Silica Fillers (2017-2028) & (MT)
- Figure 74. Bottom-up and Top-down Approaches for This Report
- Figure 75. Data Triangulation 128
The global Spherical Silica Fillers market was valued at USD 513.53 million in 2021 and is expected to reach USD 816.76 million by the end of 2028, growing at a CAGR of 6.27% between 2022 and 2028.
Drivers and Restrains:
The research report has incorporated the analysis of different factors that augment the market's growth. It constitutes trends, restraints, and drivers that transform the market in either a positive or negative manner. This section also provides the scope of different segments and applications that can potentially influence the market in the future. The detailed information is based on current trends and historic milestones. This section also provides an analysis of the volume of production about the global market and about each type from 2017 to 2028. This section mentions the volume of production by region from 2017 to 2028. Pricing analysis is included in the report according to each type from the year 2017 to 2028, manufacturer from 2017 to 2022, region from 2017 to 2022, and global price from 2017 to 2028.
A thorough evaluation of the restrains included in the report portrays the contrast to drivers and gives room for strategic planning. Factors that overshadow the market growth are pivotal as they can be understood to devise different bends for getting hold of the lucrative opportunities that are present in the ever-growing market. Additionally, insights into market expert's opinions have been taken to understand the market better.
Segment Analysis:
The research report includes specific segments by region (country), by manufacturers, by Type and by Application. Each type provides information about the production during the forecast period of 2017 to 2028. by Application segment also provides consumption during the forecast period of 2017 to 2028. Understanding the segments helps in identifying the importance of different factors that aid the market growth.
By Company
- Micron
- Denka
- Tatsumori
- Admatechs
- Shin-Etsu Chemical
- Imerys
- Sibelco
- Jiangsu Yoke Technology
- NOVORAY
Segment by Type
- 0.01µm-10µm
- 10µm-20µm
- Above 20 µm
Segment by Application
- EMC
- CCL
- MUF
- Other
Production by Region
- Japan
- China
- Korea
- USA
- Southeast Asia
Consumption by Region
- North America
- U.S.
- Canada
- Asia-Pacific
- China
- Japan
- Korea
- Taiwan
- Southeast Asia
- Europe
- Germany
- France
- UK
- Belgium
- Netherlands
- Rest of Europe
- South America
- Mexico
- Brazil
- Rest of South America
TABLE OF CONTENTS
1 SPHERICAL SILICA FILLERS MARKET OVERVIEW
- 1.1 PRODUCT OVERVIEW AND SCOPE OF SPHERICAL SILICA FILLERS
- 1.2 SPHERICAL SILICA FILLERS SEGMENT BY TYPE
- 1.2.1 GLOBAL SPHERICAL SILICA FILLERS MARKET SIZE GROWTH RATE ANALYSIS BY TYPE: 2022 VS 2028
- 1.2.2 0.01MM-10MM
- 1.2.3 10MM-20MM
- 1.2.4 ABOVE 20 MM
- 1.3 SPHERICAL SILICA FILLERS SEGMENT BY APPLICATION
- 1.3.1 GLOBAL SPHERICAL SILICA FILLERS MARKET SIZE GROWTH RATE ANALYSIS BY APPLICATION: 2022 VS 2028
- 1.3.2 EMC
- 1.3.3 CCL
- 1.3.4 MUF
- 1.4 GLOBAL MARKET GROWTH PROSPECTS
- 1.4.1 GLOBAL SPHERICAL SILICA FILLERS REVENUE ESTIMATES AND FORECASTS (2017-2028)
- 1.4.2 GLOBAL SPHERICAL SILICA FILLERS PRODUCTION CAPACITY ESTIMATES AND FORECASTS (2017-2028)
- 1.4.3 GLOBAL SPHERICAL SILICA FILLERS PRODUCTION ESTIMATES AND FORECASTS (2017-2028)
- 1.5 GLOBAL MARKET SIZE BY REGION
- 1.5.1 GLOBAL SPHERICAL SILICA FILLERS MARKET SIZE ESTIMATES AND FORECASTS BY REGION: 2017 VS 2022 VS 2028
- 1.5.2 USA SPHERICAL SILICA FILLERS ESTIMATES AND FORECASTS (2017-2028)
- 1.5.3 SOUTHEAST ASIA SPHERICAL SILICA FILLERS ESTIMATES AND FORECASTS (2017-2028)
- 1.5.4 CHINA SPHERICAL SILICA FILLERS ESTIMATES AND FORECASTS (2017-2028)
- 1.5.5 JAPAN SPHERICAL SILICA FILLERS ESTIMATES AND FORECASTS (2017-2028)
- 1.5.6 KOREA SPHERICAL SILICA FILLERS ESTIMATES AND FORECASTS (2017-2028)
2 MARKET COMPETITION BY MANUFACTURERS
- 2.1 GLOBAL SPHERICAL SILICA FILLERS PRODUCTION CAPACITY MARKET SHARE BY MANUFACTURERS (2017-2022)
- 2.2 GLOBAL SPHERICAL SILICA FILLERS REVENUE MARKET SHARE BY MANUFACTURERS (2017-2022)
- 2.3 SPHERICAL SILICA FILLERS MARKET SHARE BY COMPANY TYPE (TIER 1, TIER 2, AND TIER 3)
- 2.4 GLOBAL SPHERICAL SILICA FILLERS AVERAGE PRICE BY MANUFACTURERS (2017-2022)
- 2.5 MANUFACTURERS SPHERICAL SILICA FILLERS PRODUCTION SITES, AREA SERVED
- 2.6 SPHERICAL SILICA FILLERS MARKET COMPETITIVE SITUATION AND TRENDS
- 2.6.1 SPHERICAL SILICA FILLERS MARKET CONCENTRATION RATE
- 2.6.2 GLOBAL 5 AND 3 LARGEST SPHERICAL SILICA FILLERS PLAYERS MARKET SHARE BY REVENUE
- 2.6.3 MERGERS & ACQUISITIONS, EXPANSION
3 PRODUCTION CAPACITY BY REGION
- 3.1 GLOBAL PRODUCTION CAPACITY OF SPHERICAL SILICA FILLERS MARKET SHARE BY REGION (2017-2022)
- 3.2 GLOBAL SPHERICAL SILICA FILLERS REVENUE MARKET SHARE BY REGION (2017-2022)
- 3.3 GLOBAL SPHERICAL SILICA FILLERS PRODUCTION CAPACITY, REVENUE, PRICE AND GROSS MARGIN (2017-2022)
- 3.4 USA SPHERICAL SILICA FILLERS PRODUCTION
- 3.4.1 USA SPHERICAL SILICA FILLERS PRODUCTION GROWTH RATE (2017-2022)
- 3.4.2 USA SPHERICAL SILICA FILLERS PRODUCTION CAPACITY, REVENUE, PRICE AND GROSS MARGIN (2017-2022)
- 3.5 SOUTHEAST ASIA SPHERICAL SILICA FILLERS PRODUCTION
- 3.5.1 SOUTHEAST ASIA SPHERICAL SILICA FILLERS PRODUCTION GROWTH RATE (2017-2022)
- 3.5.2 SOUTHEAST ASIA SPHERICAL SILICA FILLERS PRODUCTION CAPACITY, REVENUE, PRICE AND GROSS MARGIN (2017-2022)
- 3.6 CHINA SPHERICAL SILICA FILLERS PRODUCTION (2017-2022)
- 3.6.1 CHINA SPHERICAL SILICA FILLERS PRODUCTION GROWTH RATE (2017-2022)
- 3.6.2 CHINA SPHERICAL SILICA FILLERS PRODUCTION CAPACITY, REVENUE, PRICE AND GROSS MARGIN (2017-2022)
- 3.7 JAPAN SPHERICAL SILICA FILLERS PRODUCTION (2017-2022)
- 3.7.1 JAPAN SPHERICAL SILICA FILLERS PRODUCTION GROWTH RATE (2017-2022)
- 3.7.2 JAPAN SPHERICAL SILICA FILLERS PRODUCTION CAPACITY, REVENUE, PRICE AND GROSS MARGIN (2017-2022)
- 3.8 KOREA SPHERICAL SILICA FILLERS PRODUCTION
- 3.8.1 KOREA SPHERICAL SILICA FILLERS PRODUCTION GROWTH RATE (2017-2022)
- 3.8.2 KOREA SPHERICAL SILICA FILLERS PRODUCTION CAPACITY, REVENUE, PRICE AND GROSS MARGIN (2017-2022)
4 SPHERICAL SILICA FILLERS CONSUMPTION BY REGION
- 4.1 GLOBAL SPHERICAL SILICA FILLERS CONSUMPTION BY REGION
- 4.1.1 GLOBAL SPHERICAL SILICA FILLERS CONSUMPTION BY REGION
- 4.1.2 GLOBAL SPHERICAL SILICA FILLERS CONSUMPTION MARKET SHARE BY REGION
- 4.2 NORTH AMERICA
- 4.2.1 NORTH AMERICA SPHERICAL SILICA FILLERS CONSUMPTION BY COUNTRY
- 4.2.2 U.S.
- 4.2.3 CANADA
- 4.3 EUROPE
- 4.3.1 EUROPE SPHERICAL SILICA FILLERS CONSUMPTION BY COUNTRY
- 4.3.2 GERMANY
- 4.3.3 FRANCE
- 4.3.4 U.K.
- 4.3.5 BELGIUM
- 4.3.6 NETHERLANDS
- 4.4 ASIA PACIFIC
- 4.4.1 ASIA PACIFIC SPHERICAL SILICA FILLERS CONSUMPTION BY REGION
- 4.4.2 CHINA
- 4.4.3 JAPAN
- 4.4.4 SOUTH KOREA
- 4.4.5 CHINA TAIWAN
- 4.4.6 SOUTHEAST ASIA
- 4.5 LATIN AMERICA
- 4.5.1 LATIN AMERICA SPHERICAL SILICA FILLERS CONSUMPTION BY COUNTRY
- 4.5.2 MEXICO
- 4.5.3 BRAZIL
5 SEGMENT BY TYPE
- 5.1 GLOBAL SPHERICAL SILICA FILLERS PRODUCTION MARKET SHARE BY TYPE (2017-2022)
- 5.2 GLOBAL SPHERICAL SILICA FILLERS REVENUE MARKET SHARE BY TYPE (2017-2022)
- 5.3 GLOBAL SPHERICAL SILICA FILLERS PRICE BY TYPE (2017-2022)
6 SEGMENT BY APPLICATION
- 6.1 GLOBAL SPHERICAL SILICA FILLERS PRODUCTION MARKET SHARE BY APPLICATION (2017-2022)
- 6.2 GLOBAL SPHERICAL SILICA FILLERS REVENUE MARKET SHARE BY APPLICATION (2017-2022)
- 6.3 GLOBAL SPHERICAL SILICA FILLERS PRICE BY APPLICATION (2017-2022)
7 KEY COMPANIES PROFILED
- 7.1 MICRON
- 7.1.1 MICRON SPHERICAL SILICA FILLERS CORPORATION INFORMATION
- 7.1.2 MICRON SPHERICAL SILICA FILLERS PRODUCT PORTFOLIO
- 7.1.3 MICRON SPHERICAL SILICA FILLERS PRODUCTION CAPACITY, REVENUE, PRICE AND GROSS MARGIN (2017-2022)
- 7.1.4 MICRON MAIN BUSINESS AND MARKETS SERVED
- 7.2 DENKA
- 7.2.1 DENKA SPHERICAL SILICA FILLERS CORPORATION INFORMATION
- 7.2.2 DENKA SPHERICAL SILICA FILLERS PRODUCT PORTFOLIO
- 7.2.3 DENKA SPHERICAL SILICA FILLERS PRODUCTION CAPACITY, REVENUE, PRICE AND GROSS MARGIN (2017-2022)
- 7.2.4 DENKA MAIN BUSINESS AND MARKETS SERVED
- 7.3 TATSUMORI
- 7.3.1 TATSUMORI SPHERICAL SILICA FILLERS CORPORATION INFORMATION
- 7.3.2 TATSUMORI SPHERICAL SILICA FILLERS PRODUCT PORTFOLIO
- 7.3.3 TATSUMORI SPHERICAL SILICA FILLERS PRODUCTION CAPACITY, REVENUE, PRICE AND GROSS MARGIN (2017-2022)
- 7.3.4 TATSUMORI MAIN BUSINESS AND MARKETS SERVED
- 7.4 ADMATECHS
- 7.4.1 ADMATECHS SPHERICAL SILICA FILLERS CORPORATION INFORMATION
- 7.4.2 ADMATECHS SPHERICAL SILICA FILLERS PRODUCT PORTFOLIO
- 7.4.3 ADMATECHS SPHERICAL SILICA FILLERS PRODUCTION CAPACITY, REVENUE, PRICE AND GROSS MARGIN (2017-2022)
- 7.4.4 ADMATECHS MAIN BUSINESS AND MARKETS SERVED
- 7.4.5 TECHNOLOGY OF ADMATECHS SPERICAL SILICA POWDER
- 7.5 SHIN-ETSU CHEMICAL
- 7.5.1 SHIN-ETSU CHEMICAL SPHERICAL SILICA FILLERS CORPORATION INFORMATION
- 7.5.2 SHIN-ETSU CHEMICAL SPHERICAL SILICA FILLERS PRODUCT PORTFOLIO
- 7.5.3 SHIN-ETSU CHEMICAL SPHERICAL SILICA FILLERS PRODUCTION CAPACITY, REVENUE, PRICE AND GROSS MARGIN (2017-2022)
- 7.5.4 SHIN-ETSU CHEMICAL MAIN BUSINESS AND MARKETS SERVED
- 7.6 IMERYS
- 7.6.1 IMERYS SPHERICAL SILICA FILLERS CORPORATION INFORMATION
- 7.6.2 IMERYS SPHERICAL SILICA FILLERS PRODUCT PORTFOLIO
- 7.6.3 IMERYS SPHERICAL SILICA FILLERS PRODUCTION CAPACITY, REVENUE, PRICE AND GROSS MARGIN (2017-2022)
- 7.6.4 IMERYS MAIN BUSINESS AND MARKETS SERVED
- 7.7 SIBELCO
- 7.7.1 SIBELCO SPHERICAL SILICA FILLERS CORPORATION INFORMATION
- 7.7.2 SIBELCO SPHERICAL SILICA FILLERS PRODUCT PORTFOLIO
- 7.7.3 SIBELCO SPHERICAL SILICA FILLERS PRODUCTION CAPACITY, REVENUE, PRICE AND GROSS MARGIN (2017-2022)
- 7.7.4 SIBELCO MAIN BUSINESS AND MARKETS SERVED
- 7.8 JIANGSU YOKE TECHNOLOGY
- 7.8.1 JIANGSU YOKE TECHNOLOGY SPHERICAL SILICA FILLERS CORPORATION INFORMATION
- 7.8.2 JIANGSU YOKE TECHNOLOGY SPHERICAL SILICA FILLERS PRODUCT PORTFOLIO
- 7.8.3 JIANGSU YOKE TECHNOLOGY SPHERICAL SILICA FILLERS PRODUCTION CAPACITY, REVENUE, PRICE AND GROSS MARGIN (2017-2022)
- 7.8.4 JIANGSU YOKE TECHNOLOGY MAIN BUSINESS AND MARKETS SERVED
- 7.9 NOVORAY
- 7.9.1 NOVORAY SPHERICAL SILICA FILLERS CORPORATION INFORMATION
- 7.9.2 NOVORAY SPHERICAL SILICA FILLERS PRODUCT PORTFOLIO
- 7.9.3 NOVORAY SPHERICAL SILICA FILLERS PRODUCTION CAPACITY, REVENUE, PRICE AND GROSS MARGIN (2017-2022)
- 7.9.4 NOVORAY MAIN BUSINESS AND MARKETS SERVED
8 SPHERICAL SILICA FILLERS MANUFACTURING COST ANALYSIS
- 8.1 SPHERICAL SILICA FILLERS KEY RAW MATERIALS ANALYSIS
- 8.1.1 KEY RAW MATERIALS
- 8.1.2 KEY SUPPLIERS OF RAW MATERIALS
- 8.2 PROPORTION OF MANUFACTURING COST STRUCTURE
- 8.3 MANUFACTURING PROCESS ANALYSIS OF SPHERICAL SILICA FILLERS
- 8.4 SPHERICAL SILICA FILLERS INDUSTRIAL CHAIN ANALYSIS
9 MARKETING CHANNEL, DISTRIBUTORS AND CUSTOMERS
- 9.1 MARKETING CHANNEL
- 9.2 SPHERICAL SILICA FILLERS DISTRIBUTORS LIST
- 9.3 SPHERICAL SILICA CUSTOMERS
- 9.3.1 KYOCERA ANALYSIS
- 9.3.2 HITACHI CHEMICAL ANALYSIS
- 9.3.3 SAMSUNG SDI ANALYSIS
- 9.3.4 SHIN-ETSU ANALYSIS
10 SPHERICAL SILICA FILLERS MARKET DYNAMICS
- 10.1 SPHERICAL SILICA FILLERS INDUSTRY TRENDS
- 10.2 SPHERICAL SILICA FILLERS MARKET DRIVERS
- 10.3 SPHERICAL SILICA FILLERS MARKET CHALLENGES
- 10.4 SPHERICAL SILICA FILLERS MARKET RESTRAINTS
11 PRODUCTION AND SUPPLY FORECAST
- 11.1 GLOBAL FORECASTED PRODUCTION OF SPHERICAL SILICA FILLERS BY REGION (2023-2028)
- 11.2 USA SPHERICAL SILICA FILLERS PRODUCTION, REVENUE FORECAST (2023-2028)
- 11.3 SOUTHEAST ASIA SPHERICAL SILICA FILLERS PRODUCTION, REVENUE FORECAST (2023-2028)
- 11.4 CHINA SPHERICAL SILICA FILLERS PRODUCTION, REVENUE FORECAST (2023-2028)
- 11.5 JAPAN SPHERICAL SILICA FILLERS PRODUCTION, REVENUE FORECAST (2023-2028)
- 11.6 KOREA SPHERICAL SILICA FILLERS PRODUCTION, REVENUE FORECAST (2023-2028)
12 CONSUMPTION AND DEMAND FORECAST
- 12.1 GLOBAL FORECASTED DEMAND ANALYSIS OF SPHERICAL SILICA FILLERS
- 12.2 NORTH AMERICA FORECASTED CONSUMPTION OF SPHERICAL SILICA FILLERS BY COUNTRY
- 12.3 EUROPE MARKET FORECASTED CONSUMPTION OF SPHERICAL SILICA FILLERS BY COUNTRY
- 12.4 ASIA PACIFIC MARKET FORECASTED CONSUMPTION OF SPHERICAL SILICA FILLERS BY REGION
- 12.5 LATIN AMERICA FORECASTED CONSUMPTION OF SPHERICAL SILICA FILLERS BY COUNTRY
13 FORECAST BY TYPE AND BY APPLICATION
- 13.1 GLOBAL PRODUCTION, REVENUE AND PRICE FORECAST BY TYPE (2023-2028)
- 13.1.1 GLOBAL FORECASTED PRODUCTION OF SPHERICAL SILICA FILLERS BY TYPE (2023-2028)
- 13.1.2 GLOBAL FORECASTED REVENUE OF SPHERICAL SILICA FILLERS BY TYPE (2023-2028)
- 13.1.3 GLOBAL FORECASTED PRICE OF SPHERICAL SILICA FILLERS BY TYPE (2023-2028)
- 13.2 GLOBAL PRODUCTION, REVENUE AND PRICE FORECAST BY APPLICATION (2023-2028)
- 13.2.1 GLOBAL FORECASTED PRODUCTION OF SPHERICAL SILICA FILLERS BY APPLICATION (2023-2028)
- 13.2.2 GLOBAL FORECASTED REVENUE OF SPHERICAL SILICA FILLERS BY APPLICATION (2023-2028)
- 13.2.3 GLOBAL FORECASTED PRICE OF SPHERICAL SILICA FILLERS BY APPLICATION (2023-2028)
14 RESEARCH FINDINGS AND CONCLUSION
15 METHODOLOGY AND DATA SOURCE
- 15.1 METHODOLOGY/RESEARCH APPROACH
- 15.1.1 RESEARCH PROGRAMS/DESIGN
- 15.1.2 MARKET SIZE ESTIMATION
- 15.1.3 MARKET BREAKDOWN AND DATA TRIANGULATION
- 15.2 DATA SOURCE
- 15.2.1 SECONDARY SOURCES
- 15.2.2 PRIMARY SOURCES
- 15.3 AUTHOR LIST
- 15.4 DISCLAIMER