|
|
市場調査レポート
商品コード
1100557
活性白土の世界市場の分析 (2022年)Global Activated Bleaching Earth Market Research Report 2022 |
||||||
|
|
|||||||
|
● お客様のご希望に応じて、既存データの加工や未掲載情報(例:国別セグメント)の追加などの対応が可能です。 詳細はお問い合わせください。 |
|||||||


| 活性白土の世界市場の分析 (2022年) |
|
出版日: 2022年07月12日
発行: QYResearch
ページ情報: 英文 128 Pages
納期: 2~3営業日
|
- 全表示
- 概要
- 図表
- 目次
世界の活性白土の市場規模は、新型コロナウイルス感染症 (COVID-19) による再調整を経て、2022年に8億7,071万米ドル、2028年までに9億7,652万米ドルに達する見通しです。
また、予測期間中 (2022年~2028年) に1.93%のCAGRで成長すると予想されています。
種類別では、湿式技術が2021年に世界市場の67.63%を占め、2028年には6億9,612万米ドルの規模に達し、2022年から2028年までに2.83%のCAGRで成長すると予測されています。用途別では、食用油セグメントが予測期間中に1.93%のCAGRで成長する見通しです。
目次
第1章 活性白土:市場概要
- 活性白土:製品の概要と範囲
- 種類別のセグメント
- 販売成長率の比較:種類別 (2022年~2028年)
- 湿式技術
- 乾式技術
- 用途別のセグメント
- 販売の比較:用途別 (2022年~2028年)
- 食用油
- 鉱油
- 世界の活性白土の市場規模:推定・予測
- 収益:推定・予測 (2017年~2028年)
- 販売:推定・予測 (2017年~2028年)
- 市場規模:地域別 (2017年・2022年・2028年)
第2章 活性白土:メーカー別の市場競争
- 販売・市場シェア:メーカー別 (2017年~2022年)
- 収益・市場シェア:メーカー別 (2017年~2022年)
- 平均価格:メーカー別 (2017年~2022年)
- 活性白土メーカーの製造拠点・提供エリア・製品種類
- 活性白土市場の競争状況と動向
- メーカーの企業合併・買収 (M&A)、拡張計画
第3章 活性白土市場:地域別の遡及的シナリオ
- 販売の遡及的シナリオ:地域別 (2017年~2022年)
- 収益の遡及的シナリオ:地域別 (2017年~2022年)
- 北米の活性白土市場:国別の詳細分析
- 米国
- カナダ
- メキシコ
- 欧州の活性白土市場:国別の詳細分析
- ドイツ
- フランス
- 英国
- イタリア
- スペイン
- アジア太平洋の活性白土市場:国別の詳細分析
- 中国
- 日本
- 韓国
- インド
- オーストラリア
- インドネシア
- タイ
- マレーシア
- 南米の活性白土市場:国別の詳細分析
- ブラジル
- アルゼンチン
- 中東・アフリカの活性白土市場:国別の詳細分析
- トルコ
- 湾岸協力会議 (GCC) 諸国
- エジプト
第4章 活性白土:過去の市場分析、種類別
- 販売・市場シェア:種類別 (2017年~2022年)
- 収益・市場シェア:種類別 (2017年~2022年)
- 価格:種類別 (2017年~2022年)
第5章 活性白土:過去の市場分析、用途別
- 販売・市場シェア:用途別 (2017年~2022年)
- 収益・市場シェア:用途別 (2017年~2022年)
- 価格:用途別 (2017年~2022年)
第6章 主要企業のプロファイル
- Clariant
- 企業情報
- 企業概略・事業概要
- 販売・収益・粗利益 (2017年~2022年)
- 製品ポートフォリオ
- Taiko Group
- The W Clay Industries Sdn. Bhd
- Ashapura Perfoclay Limited
- Musim Mas
- Hangzhou Yongsheng
- Huangshan Baiyue Activated Clay
- Tianyu Group
- Guangxi Longan Ruifeng Industrial
- EP Engineered Clays
- Oil-Dri Corporation of America
- Milestone Catalyst Corporation
- SB Patil Minerals Private Limited
第7章 活性白土の製造コストの分析
- 活性白土の主要原材料の分析
- 製造コストの構造比率
- 活性白土の製造プロセスの分析
- 活性白土の産業チェーンの分析
第8章 マーケティングチャネル・流通業者・顧客
- マーケティングチャネル
- 活性白土の流通業者の一覧
- 活性白土の顧客
第9章 活性白土市場:市場力学
- 活性白土業界の動向
- 活性白土市場の促進要因
- 活性白土市場の課題
- 活性白土市場の抑制要因
第10章 世界市場の予測
- 活性白土市場:種類別の推計・予測
- 販売予測:種類別 (2023年~2028年)
- 収益予測:種類別 (2023年~2028年)
- 活性白土市場:用途別の推計・予測
- 販売予測:用途別 (2023年~2028年)
- 収益予測:用途別 (2023年~2028年)
- 活性白土市場:地域別の推計・予測
- 販売予測:地域別 (2023年~2028年)
- 収益予測:地域別 (2023年~2028年)
第11章 調査結果と結論
第12章 調査手法とデータソース
LIST OF TABLES
- Table 1. Global Activated Bleaching Earth Sales Growth Rate Comparison by Type (2022-2028) & (US$ Million)
- Table 2. Global Activated Bleaching Earth Sales Growth Rate Comparison by Application (2022-2028) & (US$ Million)
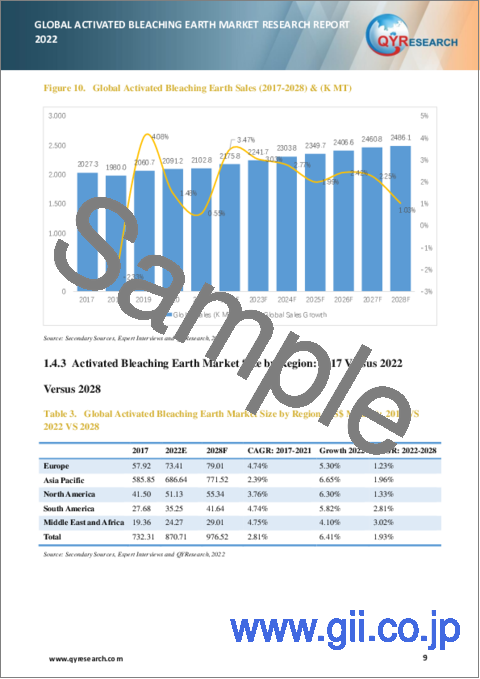
- Table 3. Global Activated Bleaching Earth Market Size by Region (US$ Million): 2017 VS 2022 VS 2028
- Table 4. Global Activated Bleaching Earth Market Competitive Situation by Manufacturers in 2021
- Table 5. Global Activated Bleaching Earth Sales (K MT) of Key Manufacturers (2017-2022)
- Table 6. Global Activated Bleaching Earth Sales Market Share by Manufacturers (2017-2022)
- Table 7. Global Activated Bleaching Earth Revenue (US$ Million) by Manufacturers (2017-2022)
- Table 8. Global Activated Bleaching Earth Revenue Share by Manufacturers (2017-2022)
- Table 9. Global Market Activated Bleaching Earth Average Price (USD/MT) of Key Manufacturers (2017-2022)
- Table 10. Manufacturers Activated Bleaching Earth Manufacturing Sites and Area Served
- Table 11. Manufacturers Activated Bleaching Earth Product Type
- Table 12. Global Activated Bleaching Earth by Company Type (Tier 1, Tier 2, and Tier 3) & (based on the Revenue in Activated Bleaching Earth as of 2021)
- Table 13. Manufacturers Mergers & Acquisitions, Expansion Plans
- Table 14. Global Activated Bleaching Earth Sales by Region (2017-2022) & (K MT)
- Table 15. Global Activated Bleaching Earth Sales Market Share by Region (2017-2022)
- Table 16. Global Activated Bleaching Earth Revenue by Region (2017-2022) & (US$ Million)
- Table 17. Global Activated Bleaching Earth Revenue Market Share by Region (2017-2022)
- Table 18. North America Activated Bleaching Earth Sales by Country (2017-2022) & (K MT)
- Table 19. North America Activated Bleaching Earth Sales Market Share by Country (2017-2022)
- Table 20. North America Activated Bleaching Earth Revenue by Country (2017-2022) & (US$ Million)
- Table 21. North America Activated Bleaching Earth Revenue Market Share by Country (2017-2022)
- Table 22. Europe Activated Bleaching Earth Sales by Country (2017-2022) & (K MT)
- Table 23. Europe Activated Bleaching Earth Sales Market Share by Country (2017-2022)
- Table 24. Europe Activated Bleaching Earth Revenue by Country (2017-2022) & (US$ Million)
- Table 25. Europe Activated Bleaching Earth Revenue Market Share by Country (2017-2022)
- Table 26. Asia Pacific Activated Bleaching Earth Sales by Region (2017-2022) & (K MT)
- Table 27. Asia Pacific Activated Bleaching Earth Sales Market Share by Region (2017-2022)
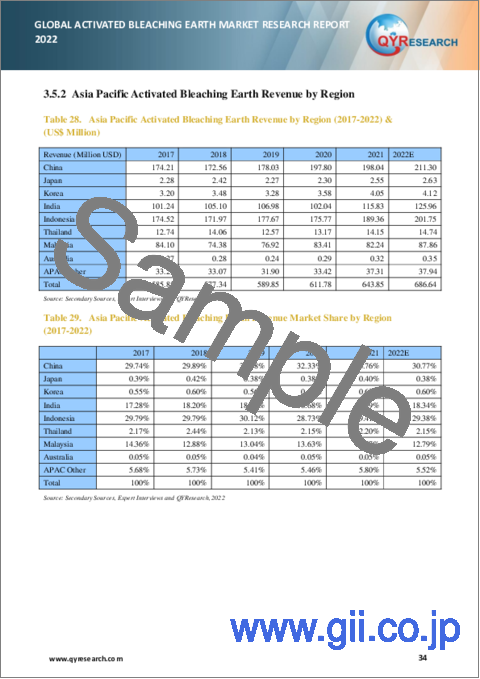
- Table 28. Asia Pacific Activated Bleaching Earth Revenue by Region (2017-2022) & (US$ Million)
- Table 29. Asia Pacific Activated Bleaching Earth Revenue Market Share by Region (2017-2022)
- Table 30. South America Activated Bleaching Earth Sales by Country (2017-2022) & (K MT)
- Table 31. South America Activated Bleaching Earth Sales Market Share by Country (2017-2022)
- Table 32. South America Activated Bleaching Earth Revenue by Country (2017-2022) & (US$ Million)
- Table 33. South America Activated Bleaching Earth Revenue Market Share by Country (2017-2022)
- Table 34. Middle East and Africa Activated Bleaching Earth Sales by Country (2017-2022) & (K MT)
- Table 35. Middle East and Africa Activated Bleaching Earth Sales Market Share by Country (2017-2022)
- Table 36. Middle East and Africa Activated Bleaching Earth Revenue by Country (2017-2022) & (US$ Million)
- Table 37. Middle East and Africa Activated Bleaching Earth Revenue Market Share by Country (2017-2022)
- Table 38. Global Activated Bleaching Earth Sales by Type (2017-2022) & (K MT)
- Table 39. Global Activated Bleaching Earth Sales Market Share by Type (2017-2022)
- Table 40. Global Activated Bleaching Earth Revenue by Type (2017-2022) & (US$ Million)
- Table 41. Global Activated Bleaching Earth Revenue Share by Type (2017-2022)
- Table 42. Global Activated Bleaching Earth Price by Type (2017-2022) & (USD/MT)
- Table 43. Global Activated Bleaching Earth Sales (K MT) by Application (2017-2022)
- Table 44. Global Activated Bleaching Earth Sales Market Share by Application (2017-2022)
- Table 45. Global Activated Bleaching Earth Revenue by Application (2017-2022) & (US$ Million)
- Table 46. Global Activated Bleaching Earth Revenue Share by Application (2017-2022)
- Table 47. Global Activated Bleaching Earth Price by Application (2017-2022) & (USD/MT)
- Table 48. Clariant Corporation Information
- Table 49. Clariant Description and Business Overview
- Table 50. Clariant Activated Bleaching Earth Sales (K MT), Revenue (US$ Million), Price (USD/MT) and Gross Margin (2017-2022)
- Table 51. Clariant Activated Bleaching Earth Product
- Table 52. Taiko Group Corporation Information
- Table 53. Taiko Group Description and Business Overview
- Table 54. Taiko Group Activated Bleaching Earth Sales (K MT), Revenue (US$ Million), Price (USD/MT) and Gross Margin (2017-2022)
- Table 55. Taiko Group Activated Bleaching Earth Product
- Table 56. The W Clay Industries Sdn. Bhd Corporation Information
- Table 57. The W Clay Industries Sdn. Bhd Description and Business Overview
- Table 58. The W Clay Industries Sdn. Bhd Activated Bleaching Earth Sales (K MT), Revenue (US$ Million), Price (USD/MT) and Gross Margin (2017-2022)
- Table 59. The W Clay Industries Sdn. Bhd Activated Bleaching Earth Product
- Table 60. Ashapura Perfoclay Limited Corporation Information
- Table 61. Ashapura Perfoclay Limited Description and Business Overview
- Table 62. Ashapura Perfoclay Limited Activated Bleaching Earth Sales (K MT), Revenue (US$ Million), Price (USD/MT) and Gross Margin (2017-2022)
- Table 63. Ashapura Perfoclay Limited Activated Bleaching Earth Product
- Table 64. Musim Mas Corporation Information
- Table 65. Musim Mas Description and Business Overview
- Table 66. Musim Mas Activated Bleaching Earth Sales (K MT), Revenue (US$ Million), Price (USD/MT) and Gross Margin (2017-2022)
- Table 67. Musim Mas Activated Bleaching Earth Product
- Table 68. Hangzhou Yongsheng Corporation Information
- Table 69. Hangzhou Yongsheng Description and Business Overview
- Table 70. Hangzhou Yongsheng Activated Bleaching Earth Sales (K MT), Revenue (US$ Million), Price (USD/MT) and Gross Margin (2017-2022)
- Table 71. Hangzhou Yongsheng Activated Bleaching Earth Product
- Table 72. Huangshan Baiyue Activated Clay Corporation Information
- Table 73. Huangshan Baiyue Activated Clay Description and Business Overview
- Table 74. Huangshan Baiyue Activated Clay Activated Bleaching Earth Sales (K MT), Revenue (US$ Million), Price (USD/MT) and Gross Margin (2017-2022)
- Table 75. Huangshan Baiyue Activated Clay Activated Bleaching Earth Product
- Table 76. Tianyu Group Corporation Information
- Table 77. Tianyu Group Description and Business Overview
- Table 78. Tianyu Group Activated Bleaching Earth Sales (K MT), Revenue (US$ Million), Price (USD/MT) and Gross Margin (2017-2022)
- Table 79. Tianyu Group Activated Bleaching Earth Product
- Table 80. Guangxi Longan Ruifeng Industrial Corporation Information
- Table 81. Guangxi Longan Ruifeng Industrial Description and Business Overview
- Table 82. Guangxi Longan Ruifeng Industrial Activated Bleaching Earth Sales (K MT), Revenue (US$ Million), Price (USD/MT) and Gross Margin (2017-2022)
- Table 83. Guangxi Longan Ruifeng Industrial Activated Bleaching Earth Product
- Table 84. EP Engineered Clays Corporation Information
- Table 85. EP Engineered Clays Description and Business Overview
- Table 86. EP Engineered Clays Activated Bleaching Earth Sales (K MT), Revenue (US$ Million), Price (USD/MT) and Gross Margin (2017-2022)
- Table 87. EP Engineered Clays Activated Bleaching Earth Product
- Table 88. Oil-Dri Corporation of America Corporation Information
- Table 89. Oil-Dri Corporation of America Description and Business Overview
- Table 90. Oil-Dri Corporation of America Activated Bleaching Earth Sales (K MT), Revenue (US$ Million), Price (USD/MT) and Gross Margin (2017-2022)
- Table 91. Oil-Dri Corporation of America Activated Bleaching Earth Product
- Table 92. Milestone Catalyst Corporation Corporation Information
- Table 93. Milestone Catalyst Corporation Description and Business Overview
- Table 94. Milestone Catalyst Corporation Activated Bleaching Earth Sales (K MT), Revenue (US$ Million), Price (USD/MT) and Gross Margin (2017-2022)
- Table 95. Milestone Catalyst Corporation Activated Bleaching Earth Product
- Table 96. SB Patil Minerals Private Limited Corporation Information
- Table 97. SB Patil Minerals Private Limited Description and Business Overview
- Table 98. SB Patil Minerals Private Limited Activated Bleaching Earth Sales (K MT), Revenue (US$ Million), Price (USD/MT) and Gross Margin (2017-2022)
- Table 99. SB Patil Minerals Private Limited Activated Bleaching Earth Product
- Table 100. Production Base and Market Concentration Rate of Raw Material
- Table 101. Activated Bleaching Earth Distributors List
- Table 102. Activated Bleaching Earth Customers List
- Table 103. Activated Bleaching Earth Market Trends
- Table 104. Activated Bleaching Earth Market Drivers
- Table 105. Activated Bleaching Earth Market Restraints
- Table 106. Global Activated Bleaching Earth Sales Forecast by Type (2023-2028) & (K MT)
- Table 107. Global Activated Bleaching Earth Sales Market Share Forecast by Type (2023-2028)
- Table 108. Global Activated Bleaching Earth Revenue Forecast by Type (2023-2028) & (US$ Million)
- Table 109. Global Activated Bleaching Earth Revenue Market Share Forecast by Type (2023-2028)
- Table 110. Global Activated Bleaching Earth Sales Forecast by Application (2023-2028) & (K MT)
- Table 111. Global Activated Bleaching Earth Sales Market Share Forecast by Application (2023-2028)
- Table 112. Global Activated Bleaching Earth Revenue Forecast by Application (2023-2028) & (US$ Million)
- Table 113. Global Activated Bleaching Earth Revenue Market Share Forecast by Application (2023-2028)
- Table 114. Global Activated Bleaching Earth Sales Forecast by Region (2023-2028) & (K MT)
- Table 115. Global Activated Bleaching Earth Sales Market Share Forecast by Region (2023-2028)
- Table 116. Global Activated Bleaching Earth Revenue Forecast by Region (2023-2028) & (US$ Million)
- Table 117. Global Activated Bleaching Earth Revenue Market Share Forecast by Region (2023-2028)
- Table 118. Research Programs/Design for This Report
- Table 119. Key Data Information from Secondary Sources
- Table 120. Key Data Information from Primary Sources
List of Figures
- Figure 1. Product Picture of Activated Bleaching Earth
- Figure 2. Global Activated Bleaching Earth Market Share by Type: 2022 & 2028
- Figure 3. Wet Technology Product Picture
- Figure 4. Dry Technology Product Picture
- Figure 5. Global Activated Bleaching Earth Market Share by Application: 2022 & 2028
- Figure 6. Edible Oils
- Figure 7. Mineral Oils
- Figure 8. Global Activated Bleaching Earth Revenue, (US$ Million), 2017 VS 2021 VS 2028
- Figure 9. Global Activated Bleaching Earth Market Size (2017-2028) & (US$ Million)
- Figure 10. Global Activated Bleaching Earth Sales (2017-2028) & (K MT)
- Figure 11. Activated Bleaching Earth Sales Share by Manufacturers in 2021
- Figure 12. Global Activated Bleaching Earth Revenue Share by Manufacturers in 2021
- Figure 13. Global 5 Largest Activated Bleaching Earth Players: Market Share by Revenue in Activated Bleaching Earth in 2021
- Figure 14. North America Activated Bleaching Earth Sales Market Share by Country in 2021
- Figure 15. United States Activated Bleaching Earth Revenue Growth Rate (2017-2022) & (US$ Million)
- Figure 16. Canada Activated Bleaching Earth Revenue Growth Rate (2017-2022) & (US$ Million)
- Figure 17. Mexico Activated Bleaching Earth Revenue Growth Rate (2017-2022) & (US$ Million)
- Figure 18. Europe Activated Bleaching Earth Sales Market Share by Country in 2021
- Figure 19. Germany Activated Bleaching Earth Revenue Growth Rate (2017-2022) & (US$ Million)
- Figure 20. France Activated Bleaching Earth Revenue Growth Rate (2017-2022) & (US$ Million)
- Figure 21. U.K. Activated Bleaching Earth Revenue Growth Rate (2017-2022) & (US$ Million)
- Figure 22. Italy Activated Bleaching Earth Revenue Growth Rate (2017-2022) & (US$ Million)
- Figure 23. Spain Activated Bleaching Earth Revenue Growth Rate (2017-2022) & (US$ Million)
- Figure 24. Asia Pacific Activated Bleaching Earth Sales Market Share by Country in 2021
- Figure 25. China Activated Bleaching Earth Revenue Growth Rate (2017-2022) & (US$ Million)
- Figure 26. Japan Activated Bleaching Earth Revenue Growth Rate (2017-2022) & (US$ Million)
- Figure 27. South Korea Activated Bleaching Earth Revenue Growth Rate (2017-2022) & (US$ Million)
- Figure 28. India Activated Bleaching Earth Revenue Growth Rate (2017-2022) & (US$ Million)
- Figure 29. Australia Activated Bleaching Earth Revenue Growth Rate (2017-2022) & (US$ Million)
- Figure 30. Indonesia Activated Bleaching Earth Revenue Growth Rate (2017-2022) & (US$ Million)
- Figure 31. Thailand Activated Bleaching Earth Revenue Growth Rate (2017-2022) & (US$ Million)
- Figure 32. Malaysia Activated Bleaching Earth Revenue Growth Rate (2017-2022) & (US$ Million)
- Figure 33. South America Activated Bleaching Earth Sales Market Share by Country in 2021
- Figure 34. Brazil Activated Bleaching Earth Revenue Growth Rate (2017-2022) & (US$ Million)
- Figure 35. Argentina Activated Bleaching Earth Revenue Growth Rate (2017-2022) & (US$ Million)
- Figure 36. Middle East and Africa Activated Bleaching Earth Sales Market Share by Country in 2021
- Figure 37. Turkey Activated Bleaching Earth Revenue Growth Rate (2017-2022) & (US$ Million)
- Figure 38. GCC Countries Activated Bleaching Earth Revenue Growth Rate (2017-2022) & (US$ Million)
- Figure 39. Egypt Activated Bleaching Earth Revenue Growth Rate (2017-2022) & (US$ Million)
- Figure 40. Sales Market Share of Activated Bleaching Earth by Type (2017-2022)
- Figure 41. World Clays Mine Production and Reserves
- Figure 42. Manufacturing Cost Structure of Activated Bleaching Earth
- Figure 43. The All-wet Technology of Activated Bleaching Earth
- Figure 44. The Fully Dry Technology of Activated Bleaching Earth
- Figure 45. Activated Bleaching Earth Industrial Chain Analysis
- Figure 46. Channels of Distribution
- Figure 47. Distributors Profiles
- Figure 48. Production of Major Vegetable Oils Worldwide from 2012/13 to 2021/2022, by type (in million metric tons)
- Figure 49. Daily Vegetable Oil Prices, Current USD
- Figure 50. Bottom-up and Top-down Approaches for This Report
- Figure 51. Data Triangulation
- Figure 52. Key Executives Interviewed 108
Due to the COVID-19 pandemic, the global Activated Bleaching Earth market size is estimated to be worth US$ 870.71 million in 2022 and is forecast to a readjusted size of US$ 976.52 million by 2028 with a CAGR of 1.93% during the forecast period 2022-2028. Fully considering the economic change by this health crisis, Wet Technology accounting for 67.63% of the Activated Bleaching Earth global market in 2021, is projected to value US$ 696.12 million by 2028, growing at a revised 2.83% CAGR from 2022 to 2028. While Edible Oils segment is altered to an 1.93% CAGR throughout this forecast period.
The global major manufacturers of Activated Bleaching Earth include Clariant, Taiko Group, Ashapura Perfoclay Limited, The W Clay Industries Sdn. Bhd, Musim Mas, Guangxi Longan Ruifeng Industrial, Oil-Dri Corporation of America, EP Engineered Clays, and Huangshan Baiyue Activated Clay, etc. In terms of revenue, the global three largest players hold a 39.03% market share of Activated Bleaching Earth in 2021.
Segment Analysis:
The research report includes specific segments by region (country), by company, by Type and by Application. This study provides information about the sales and revenue during the historic and forecasted period of 2017 to 2028. Understanding the segments helps in identifying the importance of different factors that aid the market growth.
Segment Analysis:
The research report includes specific segments by region (country), by manufacturers, by Type and by Application. Each type provides information about the production during the forecast period of 2017 to 2028. by Application segment also provides consumption during the forecast period of 2017 to 2028. Understanding the segments helps in identifying the importance of different factors that aid the market growth.
By Company
- Clariant
- Taiko Group
- The W Clay Industries Sdn. Bhd
- Ashapura Perfoclay Limited
- Musim Mas
- Hangzhou Yongsheng
- Huangshan Baiyue Activated Clay
- Tianyu Group
- Guangxi Longan Ruifeng Industrial
- EP Engineered Clays
- Oil-Dri Corporation of America
- Milestone Catalyst Corporation
- SB Patil Minerals Private Limited
Segment by Type
- Wet Technology
- Dry Technology
- Others
Segment by Application
- Edible Oils
- Mineral Oils
- Others
Consumption by Region
- North America
- U.S.
- Canada
- Mexico
- Asia-Pacific
- China
- Japan
- Korea
- India
- Indonesia
- Thailand
- Malaysia
- Australia
- Europe
- Germany
- France
- U.K.
- Italy
- Spain
- Rest of Europe
- South America
- Brazil
- Argentina
- Rest of South America
TABLE OF CONTENTS
1 Activated Bleaching Earth Market Overview
- 1.1 Product Overview and Scope of Activated Bleaching Earth
- 1.2 Activated Bleaching Earth Segment by Type
- 1.2.1 Global Activated Bleaching Earth Sales Growth Rate Comparison by Type (2022-2028)
- 1.2.2 Wet Technology
- 1.2.3 Dry Technology
- 1.3 Activated Bleaching Earth Segment by Application
- 1.3.1 Global Activated Bleaching Earth Sales Comparison by Application (2022-2028)
- 1.3.2 Edible Oils
- 1.3.3 Mineral Oils
- 1.4 Global Activated Bleaching Earth Market Size Estimates and Forecasts
- 1.4.1 Global Activated Bleaching Earth Revenue 2017-2028
- 1.4.2 Global Activated Bleaching Earth Sales 2017-2028
- 1.4.3 Activated Bleaching Earth Market Size by Region: 2017 Versus 2022 Versus 2028
2 Activated Bleaching Earth Market Competition by Manufacturers
- 2.1 Global Activated Bleaching Earth Sales Market Share by Manufacturers (2017-2022)
- 2.2 Global Activated Bleaching Earth Revenue Market Share by Manufacturers (2017-2022)
- 2.3 Global Activated Bleaching Earth Average Price by Manufacturers (2017-2022)
- 2.4 Manufacturers Activated Bleaching Earth Manufacturing Sites, Area Served, Product Type
- 2.5 Activated Bleaching Earth Market Competitive Situation and Trends
- 2.5.1 Activated Bleaching Earth Market Concentration Rate
- 2.5.2 The Global 5 Largest Activated Bleaching Earth Players Market Share by Revenue
- 2.5.3 Global Activated Bleaching Earth Market Share by Company Type (Tier 1, Tier 2, and Tier 3)
- 2.6 Manufacturers Mergers & Acquisitions, Expansion Plans
3 Activated Bleaching Earth Retrospective Market Scenario by Region
- 3.1 Global Activated Bleaching Earth Retrospective Market Scenario in Sales by Region: 2017-2022
- 3.2 Global Activated Bleaching Earth Retrospective Market Scenario in Revenue by Region: 2017-2022
- 3.3 North America Activated Bleaching Earth Market Facts & Figures by Country
- 3.3.1 North America Activated Bleaching Earth Sales by Country
- 3.3.2 North America Activated Bleaching Earth Revenue by Country
- 3.3.3 United States
- 3.3.4 Canada
- 3.3.5 Mexico
- 3.4 Europe Activated Bleaching Earth Market Facts & Figures by Country
- 3.4.1 Europe Activated Bleaching Earth Sales by Country
- 3.4.2 Europe Activated Bleaching Earth Revenue by Country
- 3.4.3 Germany
- 3.4.4 France
- 3.4.5 U.K.
- 3.4.6 Italy
- 3.4.7 Spain
- 3.5 Asia Pacific Activated Bleaching Earth Market Facts & Figures by Region
- 3.5.1 Asia Pacific Activated Bleaching Earth Sales by Region
- 3.5.2 Asia Pacific Activated Bleaching Earth Revenue by Region
- 3.5.3 China
- 3.5.4 Japan
- 3.5.5 South Korea
- 3.5.6 India
- 3.5.7 Australia
- 3.5.8 Indonesia
- 3.5.9 Thailand
- 3.5.10 Malaysia
- 3.6 South America Activated Bleaching Earth Market Facts & Figures by Country
- 3.6.1 South America Activated Bleaching Earth Sales by Country
- 3.6.2 South America Activated Bleaching Earth Revenue by Country
- 3.6.3 Brazil
- 3.6.4 Argentina
- 3.7 Middle East and Africa Activated Bleaching Earth Market Facts & Figures by Country
- 3.7.1 Middle East and Africa Activated Bleaching Earth Sales by Country
- 3.7.2 Middle East and Africa Activated Bleaching Earth Revenue by Country
- 3.7.3 Turkey
- 3.7.4 GCC Countries
- 3.7.5 Egypt
4 Activated Bleaching Earth Historic Market Analysis by Type
- 4.1 Global Activated Bleaching Earth Sales Market Share by Type (2017-2022)
- 4.2 Global Activated Bleaching Earth Revenue Market Share by Type (2017-2022)
- 4.3 Global Activated Bleaching Earth Price by Type (2017-2022)
5 Activated Bleaching Earth Historic Market Analysis by Application
- 5.1 Global Activated Bleaching Earth Sales Market Share by Application (2017-2022)
- 5.2 Global Activated Bleaching Earth Revenue Market Share by Application (2017-2022)
- 5.3 Global Activated Bleaching Earth Price by Application (2017-2022)
6 Key Companies Profiled
- 6.1 Clariant
- 6.1.1 Clariant Corporation Information
- 6.1.2 Clariant Description and Business Overview
- 6.1.3 Clariant Activated Bleaching Earth Sales, Revenue and Gross Margin (2017-2022)
- 6.1.4 Clariant Activated Bleaching Earth Product Portfolio
- 6.2 Taiko Group
- 6.2.1 Taiko Group Corporation Information
- 6.2.2 Taiko Group Description and Business Overview
- 6.2.3 Taiko Group Activated Bleaching Earth Sales, Revenue and Gross Margin (2017-2022)
- 6.2.4 Taiko Group Activated Bleaching Earth Product Portfolio
- 6.3 The W Clay Industries Sdn. Bhd
- 6.3.1 The W Clay Industries Sdn. Bhd Corporation Information
- 6.3.2 The W Clay Industries Sdn. Bhd Description and Business Overview
- 6.3.3 The W Clay Industries Sdn. Bhd Activated Bleaching Earth Sales, Revenue and Gross Margin (2017-2022)
- 6.3.4 The W Clay Industries Sdn. Bhd Activated Bleaching Earth Product Portfolio
- 6.4 Ashapura Perfoclay Limited
- 6.4.1 Ashapura Perfoclay Limited Corporation Information
- 6.4.2 Ashapura Perfoclay Limited Description and Business Overview
- 6.4.3 Ashapura Perfoclay Limited Activated Bleaching Earth Sales, Revenue and Gross Margin (2017-2022)
- 6.4.4 Ashapura Perfoclay Limited Activated Bleaching Earth Product Portfolio
- 6.5 Musim Mas
- 6.5.1 Musim Mas Corporation Information
- 6.5.2 Musim Mas Description and Business Overview
- 6.5.3 Musim Mas Activated Bleaching Earth Sales, Revenue and Gross Margin (2017-2022)
- 6.5.4 Musim Mas Activated Bleaching Earth Product Portfolio
- 6.6 Hangzhou Yongsheng
- 6.6.1 Hangzhou Yongsheng Corporation Information
- 6.6.2 Hangzhou Yongsheng Description and Business Overview
- 6.6.3 Hangzhou Yongsheng Activated Bleaching Earth Sales, Revenue and Gross Margin (2017-2022)
- 6.6.4 Hangzhou Yongsheng Activated Bleaching Earth Product Portfolio
- 6.7 Huangshan Baiyue Activated Clay
- 6.7.1 Huangshan Baiyue Activated Clay Corporation Information
- 6.7.2 Huangshan Baiyue Activated Clay Description and Business Overview
- 6.7.3 Huangshan Baiyue Activated Clay Activated Bleaching Earth Sales, Revenue and Gross Margin (2017-2022)
- 6.7.4 Huangshan Baiyue Activated Clay Activated Bleaching Earth Product Portfolio
- 6.8 Tianyu Group
- 6.8.1 Tianyu Group Corporation Information
- 6.8.2 Tianyu Group Description and Business Overview
- 6.8.3 Tianyu Group Activated Bleaching Earth Sales, Revenue and Gross Margin (2017-2022)
- 6.8.4 Tianyu Group Activated Bleaching Earth Product Portfolio
- 6.9 Guangxi Longan Ruifeng Industrial
- 6.9.1 Guangxi Longan Ruifeng Industrial Corporation Information
- 6.9.2 Guangxi Longan Ruifeng Industrial Description and Business Overview
- 6.9.3 Guangxi Longan Ruifeng Industrial Activated Bleaching Earth Sales, Revenue and Gross Margin (2017-2022)
- 6.9.4 Guangxi Longan Ruifeng Industrial Activated Bleaching Earth Product Portfolio
- 6.10 EP Engineered Clays
- 6.10.1 EP Engineered Clays Corporation Information
- 6.10.2 EP Engineered Clays Description and Business Overview
- 6.10.3 EP Engineered Clays Activated Bleaching Earth Sales, Revenue and Gross Margin (2017-2022)
- 6.10.4 EP Engineered Clays Activated Bleaching Earth Product Portfolio
- 6.11 Oil-Dri Corporation of America
- 6.11.1 Oil-Dri Corporation of America Corporation Information
- 6.11.2 Oil-Dri Corporation of America Description and Business Overview
- 6.11.3 Oil-Dri Corporation of America Activated Bleaching Earth Sales, Revenue and Gross Margin (2017-2022)
- 6.11.4 Oil-Dri Corporation of America Activated Bleaching Earth Product Portfolio
- 6.12 Milestone Catalyst Corporation
- 6.12.1 Milestone Catalyst Corporation Corporation Information
- 6.12.2 Milestone Catalyst Corporation Description and Business Overview
- 6.12.3 Milestone Catalyst Corporation Activated Bleaching Earth Sales, Revenue and Gross Margin (2017-2022)
- 6.12.4 Milestone Catalyst Corporation Activated Bleaching Earth Product Portfolio
- 6.13 SB Patil Minerals Private Limited
- 6.13.1 SB Patil Minerals Private Limited Corporation Information
- 6.13.2 SB Patil Minerals Private Limited Description and Business Overview
- 6.13.3 SB Patil Minerals Private Limited Activated Bleaching Earth Sales, Revenue and Gross Margin (2017-2022)
- 6.13.4 SB Patil Minerals Private Limited Activated Bleaching Earth Product Portfolio
7 Activated Bleaching Earth Manufacturing Cost Analysis
- 7.1 Activated Bleaching Earth Key Raw Materials Analysis
- 7.1.1 Key Raw Materials
- 7.1.2 Key Suppliers of Raw Materials
- 7.2 Proportion of Manufacturing Cost Structure
- 7.3 Manufacturing Process Analysis of Activated Bleaching Earth
- 7.4 Activated Bleaching Earth Industrial Chain Analysis
8 Marketing Channel, Distributors and Customers
- 8.1 Marketing Channel
- 8.2 Activated Bleaching Earth Distributors List
- 8.3 Activated Bleaching Earth Customers
9 Activated Bleaching Earth Market Dynamics
- 9.1 Activated Bleaching Earth Industry Trends
- 9.2 Activated Bleaching Earth Market Drivers
- 9.3 Activated Bleaching Earth Market Challenges
- 9.4 Activated Bleaching Earth Market Restraints
10 Global Market Forecast
- 10.1 Activated Bleaching Earth Market Estimates and Projections by Type
- 10.1.1 Global Forecasted Sales of Activated Bleaching Earth by Type (2023-2028)
- 10.1.2 Global Forecasted Revenue of Activated Bleaching Earth by Type (2023-2028)
- 10.2 Activated Bleaching Earth Market Estimates and Projections by Application
- 10.2.1 Global Forecasted Sales of Activated Bleaching Earth by Application (2023-2028)
- 10.2.2 Global Forecasted Revenue of Activated Bleaching Earth by Application (2023-2028)
- 10.3 Activated Bleaching Earth Market Estimates and Projections by Region
- 10.3.1 Global Forecasted Sales of Activated Bleaching Earth by Region (2023-2028)
- 10.3.2 Global Forecasted Revenue of Activated Bleaching Earth by Region (2023-2028)
11 Research Findings and Conclusion
12 Methodology and Data Source
- 12.1 Methodology/Research Approach
- 12.1.1 Research Programs/Design
- 12.1.2 Market Size Estimation
- 12.1.3 Market Breakdown and Data Triangulation
- 12.2 Data Source
- 12.2.1 Secondary Sources
- 12.2.2 Primary Sources
- 12.3 Author List
- 12.4 Disclaimer