
|
市場調査レポート
商品コード
1689898
活性漂白土:市場シェア分析、産業動向・統計、成長予測(2025~2030年)Activated Bleaching Earth - Market Share Analysis, Industry Trends & Statistics, Growth Forecasts (2025 - 2030) |
||||||
カスタマイズ可能
適宜更新あり
|
|||||||
| 活性漂白土:市場シェア分析、産業動向・統計、成長予測(2025~2030年) |
|
出版日: 2025年03月18日
発行: Mordor Intelligence
ページ情報: 英文 120 Pages
納期: 2~3営業日
|

全表示
- 概要
- 目次
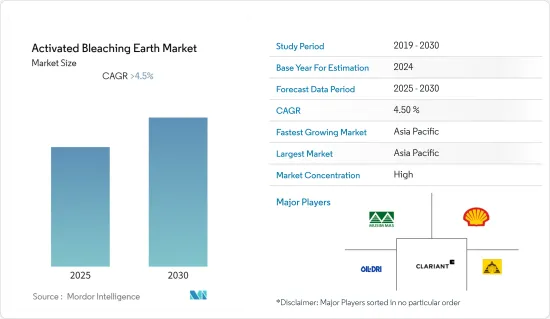
活性漂白土市場は予測期間中に4.5%以上のCAGRで推移する見込みです。
COVID-19は活性漂白土市場にマイナスの影響を与えました。世界のロックダウンと政府による厳しい規則により、ほとんどの生産拠点が閉鎖され、壊滅的な後退を余儀なくされました。それにもかかわらず、2021年以降事業は回復しており、今後数年間で大幅に増加すると予想されます。
主なハイライト
- 市場成長の主な要因は食用油脂需要の拡大です。
- しかし、代替製品や代替技術の存在が市場成長の妨げとなっています。
- バイオディーゼルの生産増加は、今後数年間、市場プレーヤーに有利な成長機会を提供すると予想されます。
- アジア太平洋地域が世界市場を独占しており、中国、インド、日本などの国による消費が最も大きいです。
活性漂白土市場の動向
食用油脂の需要増加
- 活性漂白土は、食用油、使用済み食用油(UCO)、スラッジ油、酸性油、バイオディーゼルや再生可能ディーゼルの製造に利用されるその他の廃油の精製に使用されます。食用油脂の精製、脱色、漂白に広く使用されています。
- 活性漂白土は、天然漂白土に比べて不純物を吸着する能力が高いです。
- 大豆油、綿実油、パーム油、菜種油、ヒマワリ油、紅花油、米ぬか油、コーン油、キャノーラ油、オリーブオイル、ごま油など、さまざまな食用油脂の精製に使用されます。
- 2022/23年のパーム油の世界生産量は7,722万トンとなり、2021/22年の7,383万トンから増加しました。
- 2022/23年の大豆油の世界生産量は6,149万4,000トンとなり、2021/22年の5,925万9,000トンから3.0%増加しました。
- 菜種油の世界全体での生産量は、2021/22年の2,907万トンから2022/23年には3,180万トンに増加しました。
- 2022/23年のヒマワリ油の世界生産量は2,036万トンとなり、2021/22年の1,984万トンから増加しました。
- 綿実油の世界生産量は2022/23年には502万トンとなり、2021/22年の497万トンから増加しました。
- しかし、欧州や南米の主要生産国を含むいくつかの国々で干ばつが増加したため、オリーブオイルの生産量は減少しました。2022/23年のオリーブオイルの世界生産量は282万トンで、2021/22年の327万トンと比較すると減少しています。
- したがって、食用油脂における生産量の増加と活性漂白土の需要の急増は、世界市場に成長機会をもたらすと予想されます。
アジア太平洋地域が市場を独占
- アジア太平洋地域は、活性化漂白土市場で最大のシェアを占めると予想されます。アジア太平洋地域における植物油の消費量と生産量は、中国が最大のシェアを占めています。生産量は多いものの、消費量が生産量を上回っているため、輸出量に比べて輸入量が多くなっています。
- Oils &Fats Internationalによると、2021-22年の中国の食用油生産量は2,800万トンで、前年の2,815万トンから15万トン減少しました。生産量の減少は、油糧種子の輸入が減少し、食用植物油の生産量が減少したためです。
- 中国政府の報告によると、2022年7月の同国へのパーム油と大豆油の輸入量は、それぞれ前年度の370万トン、63万トンに比べて30万トン、17万トン減少しました。
- インド植物油生産者協会(IVPA)によると、今年度(2022年10月~2023年9月)、インドは約1,437万トンの植物油を輸入しました。これは前年の輸入量1,407万トンと比較すると大幅に増加しました。
- 国際エネルギー機関(IEA)によると、韓国では総エネルギー供給量において石油が最も重要なエネルギー源であり続けています。韓国には非常に重要な精製産業があり、石油化学原料以外のほとんどの製品で自給自足が可能です。
- さらに、カナダ農業・農業・食品省(AAFC)の報告書によると、同国における食用油の小売総売上高は2021年に4億7,870万米ドルとなりました。食用油の売上高は、2026年までに5,223億米ドルに達すると予測されています。一方、食用油の消費量は2026年までに100万トン近くに達すると予想されています。
- 総務省によると、植物油の小売価格は2021年3月~2023年1月にかけて67%上昇し、他のほとんどの主食の価格上昇をはるかに上回っています。
- さらに、国内の大豆輸入額は2023年6月の1億9,005万米ドルから2023年7月には2億1,398万米ドルに達しました。大豆油の輸出額は1,700万米ドルであるのに対し、輸入額は243万米ドルであり、貿易収支はマイナスとなりました。
- したがって、上記の理由により、予測期間中はアジア太平洋地域が市場を独占すると予想されます。
活性漂白土産業の概要
活性漂白土市場は、その性質上断片化されています。市場の主要企業(順不同)には、Clariant、Musim Mas、Shell、Oil-Dri Corporation of America、Ashapura Perfoclay Limitedなどがあります。
その他の特典
- エクセル形式の市場予測(ME)シート
- 3ヶ月間のアナリストサポート
目次
第1章 イントロダクション
- 調査の前提条件
- 調査範囲
第2章 調査手法
第3章 エグゼクティブサマリー
第4章 市場力学
- 促進要因
- 食用油の需要拡大
- 抑制要因
- 代替製品と代替技術の存在
- 産業バリューチェーン分析
- ポーターのファイブフォース分析
- 供給企業の交渉力
- 消費者の交渉力
- 新規参入業者の脅威
- 代替品の脅威
- 競合の程度
第5章 市場セグメンテーション
- 用途別
- 食用油脂
- 鉱物油・潤滑油
- その他(化学、バイオディーゼルなど)
- 地域別
- アジア太平洋
- 中国
- インド
- 日本
- 韓国
- その他アジア太平洋地域
- 北米
- 米国
- カナダ
- メキシコ
- 欧州
- ドイツ
- 英国
- イタリア
- フランス
- その他欧州
- 南米
- ブラジル
- アルゼンチン
- その他南米
- 中東・アフリカ
- サウジアラビア
- 南アフリカ
- その他中東とアフリカ
- アジア太平洋
第6章 競合情勢
- M&A、合弁事業、提携、協定
- 市場ランキング分析
- 主要企業の戦略
- 企業プロファイル
- Ashapura Perfoclay Limited(APL)
- Clariant
- Global Bleach Chem Pvt. Ltd
- Hrp Industries
- Indian Clay And Mineral Co.
- Musim Mas Holdings Pte Ltd
- Oil-dri Corporation of America
- Phoenix Chemicals(Pvt.)Ltd
- Refoil Earth Pvt. Ltd
- Shell Plc(ecooils Limited)
- Taiko Group of Companies(Taiko Bleaching Earth Sdn. Bhd.)
- The W Clay Industries Sdn Bhd
第7章 市場機会と今後の動向
- バイオディーゼル生産の増加
The Activated Bleaching Earth Market is expected to register a CAGR of greater than 4.5% during the forecast period.
COVID-19 had a negative impact on the activated bleaching earth sector. Global lockdowns and severe rules enforced by governments resulted in a catastrophic setback as most production hubs were shut down. Nonetheless, the business has been recovering since 2021 and is expected to rise significantly in the coming years.
Key Highlights
- The major factor driving the market growth is the growing demand for edible oils.
- However, the presence of alternative products and technologies is hindering the market growth.
- Increasing production of bio-diesel is expected to provide lucrative growth opportunities to the market players in the coming years.
- The Asia-Pacific region dominates the global market, with the largest consumption from countries such as China, India, and Japan.
Activated Bleaching Earth Market Trends
Increasing Demand for Edible Oil & Fats
- Activated bleaching earth is used to purify edible oils, used cooking oil (UCO), sludge oils, acid oils, and other waste oils that are utilized in the manufacture of biodiesel and renewable diesel. It is widely used in the refining, decolorizing, and bleaching of edible oil and fats.
- Activated bleaching earths have a higher ability to absorb impurities in comparison to natural bleaching earths.
- It is used for the purification of various edible oils and fats, including soya bean oil, cotton seed oil, palm oil, rapeseed oil, sunflower oil, safflower oil, rice bran oil, corn oil, canola oil, olive oil, and sesame oil.
- In 2022/23, the global production volume of palm oil stood at 77.22 million metric tons, up from 73.83 million metric tons in 2021/22.
- In 2022/23, the global production volume of soybean oil increased by 3.0% to 61,494 thousand metric tons, up from 59,259 thousand metric tons in 2021/22.
- The global production of rapeseed oil across the world increased to 31.8 million metric tons in 2022/23, up from 29.07 million metric tons in 2021/22.
- In 2022/23, the global production of sunflower seed oil stood at 20.36 million metric tons, up from 19.84 million metric tons in 2021/22.
- The global production of cottonseed oil stood at 5.02 million metric tons in 2022/23, up from 4.97 million metric tons in 2021/22.
- However, the world witnessed a decline in the production of olive oil owing to the rising drought conditions in several countries, including major producers in Europe and South America. In 2022/23, the global production of olive oil stood at 2.82 million metric tons, which is lower in comparison to 3.27 million metric tons in 2021/22
- Thus, the increase in production and surge in demand for activated bleaching earth in edible fats and oils are expected to provide growth opportunities in the global market.
Asia-Pacific Region to Dominate the Market
- The Asia-Pacific region is expected to account for the largest share of the activated bleaching earth market. China holds the largest share of vegetable oil consumption and production in Asia-Pacific. Though the production volume is high, consumption exceeds production, resulting in higher import volumes when compared to export volumes.
- According to Oils & Fats International, during the crop year 2021-22, China produced 28 million tonnes of edible oil, a 150,000 tonnes decrease from the previous year's volume of 28.15 million tonnes. The decrease in the production volume is due to the drop in the oilseed imports, leading to a downgrade in edible vegetable oil production.
- As per the reports by the Government of China, in July 2022, the palm oil and soyabean oil imports to the country declined by 300,000 tonnes and 170,000 tonnes as compared to their previous year's volume of 3.7 million tonnes and 630,000 tonnes, respectively.
- According to the Indian Vegetable Oil Producers' Association (IVPA), during the current oil year (October 2022-September 2023), India imported around 14.37 million tonnes of vegetable oil, as compared to 14.07 million tonnes imported in the previous year.
- According to the International Energy Agency (IEA), oil continues to be the most important energy source in South Korea in terms of total energy supply. South Korea has a very important refining industry and is self-sufficient in most products other than petrochemical feedstocks.
- Furthermore, according to a report by Agriculture and Agri-Food Canada (AAFC), the total retail sales of cooking oils in the country were valued at USD 478.7 million in 2021. The sales of cooking oil are projected to reach USD 522.3 billion by the year 2026. While edible oil consumption is expected to reach nearly one million metric tons by 2026.
- According to the Ministry of Internal Affairs and Communications, the retail price for vegetable oil grew by 67% from March 2021 to January 2023, far above the price increase for most other staple foods.
- Additionally, the import value of soybeans in the country reached USD 213.98 million in July 2023 from USD 190.05 million in June 2023. The soybean oil exports in the country accounted for USD 0.17 million, whereas imports accounted for USD 2.43 million, resulting in a negative trade balance.
- Hence, due to the above-mentioned reasons, Asia-Pacific is anticipated to dominate the market during the forecast period.
Activated Bleaching Earth Industry Overview
The activated bleaching earth market is fragmented in nature. Some of the major players in the market (not in any particular order) include Clariant, Musim Mas, Shell, Oil-Dri Corporation of America, and Ashapura Perfoclay Limited, among other companies.
Additional Benefits:
- The market estimate (ME) sheet in Excel format
- 3 months of analyst support
TABLE OF CONTENTS
1 INTRODUCTION
- 1.1 Study Assumptions
- 1.2 Scope of the Study
2 RESEARCH METHODOLOGY
3 EXECUTIVE SUMMARY
4 MARKET DYNAMICS
- 4.1 Drivers
- 4.1.1 Growing Demand for Edible Oils
- 4.2 Restraints
- 4.2.1 Presence of Alternative Products and Technologies
- 4.3 Industry Value Chain Analysis
- 4.4 Porter's Five Forces Analysis
- 4.4.1 Bargaining Power of Suppliers
- 4.4.2 Bargaining Power of Consumers
- 4.4.3 Threat of New Entrants
- 4.4.4 Threat of Substitute Products and Services
- 4.4.5 Degree of Competition
5 MARKET SEGMENTATION (Market Size in Value)
- 5.1 Application
- 5.1.1 Edible Oil and Fats
- 5.1.2 Mineral Oil and Lubricants
- 5.1.3 Other Applications (Chemical, Biodiesel, etc.)
- 5.2 Geography
- 5.2.1 Asia-Pacific
- 5.2.1.1 China
- 5.2.1.2 India
- 5.2.1.3 Japan
- 5.2.1.4 South Korea
- 5.2.1.5 Rest of Asia-Pacific
- 5.2.2 North America
- 5.2.2.1 United States
- 5.2.2.2 Canada
- 5.2.2.3 Mexico
- 5.2.3 Europe
- 5.2.3.1 Germany
- 5.2.3.2 United Kingdom
- 5.2.3.3 Italy
- 5.2.3.4 France
- 5.2.3.5 Rest of Europe
- 5.2.4 South America
- 5.2.4.1 Brazil
- 5.2.4.2 Argentina
- 5.2.4.3 Rest of South America
- 5.2.5 Middle East and Africa
- 5.2.5.1 Saudi Arabia
- 5.2.5.2 South Africa
- 5.2.5.3 Rest of Middle East and Africa
- 5.2.1 Asia-Pacific
6 COMPETITIVE LANDSCAPE
- 6.1 Mergers and Acquisitions, Joint Ventures, Collaborations, and Agreements
- 6.2 Market Ranking Analysis
- 6.3 Strategies Adopted by Leading Players
- 6.4 Company Profiles
- 6.4.1 Ashapura Perfoclay Limited (APL)
- 6.4.2 Clariant
- 6.4.3 Global Bleach Chem Pvt. Ltd
- 6.4.4 Hrp Industries
- 6.4.5 Indian Clay And Mineral Co.
- 6.4.6 Musim Mas Holdings Pte Ltd
- 6.4.7 Oil-dri Corporation of America
- 6.4.8 Phoenix Chemicals (Pvt.) Ltd
- 6.4.9 Refoil Earth Pvt. Ltd
- 6.4.10 Shell Plc (ecooils Limited)
- 6.4.11 Taiko Group of Companies (Taiko Bleaching Earth Sdn. Bhd.)
- 6.4.12 The W Clay Industries Sdn Bhd
7 MARKET OPPORTUNITIES AND FUTURE TRENDS
- 7.1 Increasing Production of Bio-diesel

