|
|
市場調査レポート
商品コード
1080307
pH・ORPセンサーの世界市場:考察と予測 (2028年まで)Global pH & ORP Sensors Market Insights, Forecast to 2028 |
||||||
|
|
|||||||
|
● お客様のご希望に応じて、既存データの加工や未掲載情報(例:国別セグメント)の追加などの対応が可能です。 詳細はお問い合わせください。 |
|||||||


| pH・ORPセンサーの世界市場:考察と予測 (2028年まで) |
|
出版日: 2022年08月01日
発行: QYResearch
ページ情報: 英文 173 Pages
納期: 2~3営業日
|
- 全表示
- 概要
- 図表
- 目次
世界のpH・ORPセンサーの市場規模は、新型コロナウイルス感染症 (COVID-19) による再調整を経て、2022年には5億7,612万米ドル、2028年までに8億4,742万米ドルに達すると予測されています。
また、予測期間中 (2022年~2028年) に6.64%のCAGRで成長する見通しです。
種類別では、アナログセンサーが2021年に世界市場の54.88%を占め、2022年から2028年までの間に5.20%のCAGRで成長すると予測されています。用途別では、廃水セグメントが予測期間中に7.25%のCAGRで成長する見通しです。
地域別に見ると、米国が2021年に世界市場の26.19%、中国が10.41%、欧州が29.74%を占めています。
当レポートでは、世界のpH・ORPセンサーの市場について分析し、種類別・用途別の市場動向の見通し (2017年~2028年)、主要企業のプロファイルなどについて調査しております。
目次
第1章 調査範囲
- pH・ORPセンサー:製品概略
- 種類別の市場
- 市場規模:種類別 (2017年・2021年・2028年)
- デジタルセンサー
- アナログセンサー
- 用途別の市場
- 市場規模:用途別 (2017年・2021年・2028年)
- 廃水
- 純水
- 飲料水
- その他
- 分析対象
- 分析期間
第2章 世界のpH・ORPセンサーの生産
- 世界のpH・ORPセンサーの生産:地域別 (2017年・2021年・2028年)
- 世界のpH・ORPセンサーの生産:地域別
- 過去の生産:地域別 (2017年~2022年)
- 生産の予測:地域別 (2023年~2028年)
- 北米
- 欧州
- 中国
- 日本
第3章 世界のpH・ORPセンサーの販売量・販売額:推定・予測
- 世界のpH・ORPセンサーの販売:推定・予測 (2017年~2028年)
- 世界のpH・ORPセンサーの収益:推定・予測 (2017年~2028年)
- 世界のpH・ORPセンサーの収益:地域別 (2017年・2021年・2028年)
- 世界のpH・ORPセンサーの販売:地域別
- 世界のpH・ORPセンサーの収益:地域別
- 北米
- 欧州
- アジア太平洋
- ラテンアメリカ
- 中東・アフリカ
第4章 メーカー別の競合
- 世界のpH・ORPセンサーの販売:メーカー別
- 世界のpH・ORPセンサーの収益:メーカー別
- 世界のpH・ORPセンサーの販売価格:メーカー別 (2017年~2022年)
- 競合情勢の分析
- 企業合併・買収 (M&A)、拡張計画
第5章 種類別の市場規模
- 世界のpH・ORPセンサーの販売:種類別
- 世界のpH・ORPセンサーの収益:種類別
- 世界のpH・ORPセンサーの価格:種類別
第6章 用途別の市場規模
- 世界のpH・ORPセンサーの販売:用途別
- 世界のpH・ORPセンサーの収益:用途別
- 世界のpH・ORPセンサーの価格:用途別
第7章 北米
- pH・ORPセンサーの市場規模:種類別
- pH・ORPセンサーの市場規模:用途別
- pH・ORPセンサーの販売:国別
- 米国
- カナダ
第8章 欧州
- pH・ORPセンサーの市場規模:種類別
- pH・ORPセンサーの市場規模:用途別
- pH・ORPセンサーの市場規模:国別
- ドイツ
- フランス
- 英国
- イタリア
- ロシア
第9章 アジア太平洋
- pH・ORPセンサーの市場規模:種類別
- pH・ORPセンサーの市場規模:用途別
- pH・ORPセンサーの市場規模:地域別
- 中国
- 日本
- 韓国
- インド
- オーストラリア
- 台湾
- インドネシア
- タイ
- マレーシア
第10章 ラテンアメリカ
- pH・ORPセンサーの市場規模:種類別
- pH・ORPセンサーの市場規模:用途別
- pH・ORPセンサーの市場規模:国別
- メキシコ
- ブラジル
- アルゼンチン
第11章 中東・アフリカ
- pH・ORPセンサーの市場規模:種類別
- pH・ORPセンサーの市場規模:用途別
- pH・ORPセンサーの市場規模:国別
- トルコ
- サウジアラビア
- アラブ首長国連邦
第12章 企業プロファイル
- ABB
- Mettler Toledo
- GF Piping Systems
- Endress+Hauser
- Emerson
- Honeywell
- Yokogawa
- Schneider Electric
- Thermo Fisher Scientific
- Xylem
- Hamilton
- Hach
- Burkert
- AMETEK(Barben Analytical)
- Sensorex
- GMM Pfaudler
- Walchem
- Turtle Tough
- Analytical Technology
第13章 産業チェーンと販売チャネルの分析
- pH・ORPセンサーの産業チェーンの分析
- pH・ORPセンサーの主要原材料
- pH・ORPセンサーの製造モードとプロセス
- pH・ORPセンサーの販売とマーケティング
- pH・ORPセンサーの顧客
第14章 pH・ORPセンサーの市場力学
- pH・ORPセンサー業界の動向
- pH・ORPセンサー市場の促進要因
- pH・ORPセンサー市場の課題
- ポーターのファイブフォース分析
第15章 世界のpH・ORPセンサー市場:主な調査結果
第16章 付録
LIST OF TABLES
- Table 1. Global pH & ORP Sensors Market Size Growth Rate by Type, 2017 VS 2021 VS 2028 (US$ Million)
- Table 2. Global pH & ORP Sensors Market Size Growth Rate by Application, 2017 VS 2021 VS 2028 (US$ Million)
- Table 3. Global pH & ORP Sensors Production by Region: 2017 VS 2021 VS 2028 (K Units)
- Table 4. Global pH & ORP Sensors Production by Region (2017-2022) & (K Units)
- Table 5. Global pH & ORP Sensors Production Market Share by Region (2017-2022)
- Table 6. Global pH & ORP Sensors Production by Region (2023-2028) & (K Units)
- Table 7. Global pH & ORP Sensors Production Market Share by Region (2023-2028)
- Table 8. Global pH & ORP Sensors Revenue by Region: 2017 VS 2021 VS 2028 (US$ Million)
- Table 9. Global pH & ORP Sensors Sales by Region (2017-2022) & (K Units)
- Table 10. Global pH & ORP Sensors Sales Market Share by Region (2017-2022)
- Table 11. Global pH & ORP Sensors Sales by Region (2023-2028) & (K Units)
- Table 12. Global pH & ORP Sensors Sales Market Share by Region (2023-2028)
- Table 13. Global pH & ORP Sensors Revenue by Region (2017-2022) & (US$ Million)
- Table 14. Global pH & ORP Sensors Revenue Market Share by Region (2017-2022)
- Table 15. Global pH & ORP Sensors Revenue by Region (2023-2028) & (US$ Million)
- Table 16. Global pH & ORP Sensors Revenue Market Share by Region (2023-2028)
- Table 17. Global pH & ORP Sensors Sales by Manufacturers (2017-2022) & (K Unit)
- Table 18. Global pH & ORP Sensors Sales Share by Manufacturers (2017-2022)
- Table 19. Global pH & ORP Sensors Revenue by Manufacturers (2017-2022) & (US$ Million)
- Table 20. Global pH & ORP Sensors Revenue Market Share by Manufacturers (2017-2022)
- Table 21. pH & ORP Sensors Price by Manufacturers (2017-2022) & (USD/Unit)
- Table 22. Global pH & ORP Sensors Manufacturers Market Concentration Ratio (CR5)
- Table 23. Global pH & ORP Sensors by Company Type (Tier 1, Tier 2, and Tier 3) & (based on the Revenue in pH & ORP Sensors as of 2020)
- Table 24. pH & ORP Sensors Manufacturing Base Distribution and Area Served
- Table 25. Established Date of pH & ORP Sensors Manufacturers
- Table 26. Global pH & ORP Sensors Sales by Type (2017-2022) & (K Unit)
- Table 27. Global pH & ORP Sensors Sales by Type (2023-2028) & (K Unit)
- Table 28. Global pH & ORP Sensors Sales Share by Type (2017-2022)
- Table 29. Global pH & ORP Sensors Sales Share by Type (2023-2028)
- Table 30. Global pH & ORP Sensors Revenue by Type (2017-2022) & (US$ Million)
- Table 31. Global pH & ORP Sensors Revenue by Type (2023-2028) & (US$ Million)
- Table 32. Global pH & ORP Sensors Revenue Share by Type (2017-2022)
- Table 33. Global pH & ORP Sensors Revenue Share by Type (2023-2028)
- Table 34. pH & ORP Sensors Price by Type (2017-2022) & (USD/Unit)
- Table 35. Global pH & ORP Sensors Price Forecast by Type (2023-2028) & (USD/Unit)
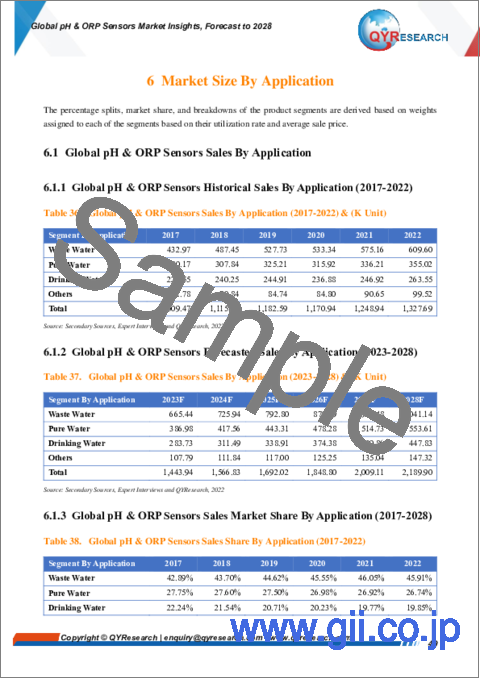
- Table 36. Global pH & ORP Sensors Sales By Application (2017-2022) & (K Unit)
- Table 37. Global pH & ORP Sensors Sales By Application (2023-2028) & (K Unit)
- Table 38. Global pH & ORP Sensors Sales Share By Application (2017-2022)
- Table 39. Global pH & ORP Sensors Sales Share By Application (2023-2028)
- Table 40. Global pH & ORP Sensors Revenue By Application (2017-2022) & (US$ Million)
- Table 41. Global pH & ORP Sensors Revenue By Application (2023-2028) & (US$ Million)
- Table 42. Global pH & ORP Sensors Revenue Share By Application (2017-2022)
- Table 43. Global pH & ORP Sensors Revenue Share By Application (2023-2028)
- Table 44. pH & ORP Sensors Price By Application (2017-2022) & (USD/Unit)
- Table 45. Global pH & ORP Sensors Price Forecast By Application (2023-2028) & (USD/Unit)
- Table 46. North America pH & ORP Sensors Sales by Type (2017-2022) & (K Unit)
- Table 47. North America pH & ORP Sensors Sales by Application (2017-2022) & (K Unit)
- Table 48. North America pH & ORP Sensors Sales by Country (2017-2022) & (K Unit)
- Table 49. North America pH & ORP Sensors Sales by Country (2023-2028) & (K Unit)
- Table 50. North America pH & ORP Sensors Revenue by Country (2017-2022) & (US$ Million)
- Table 51. North America pH & ORP Sensors Revenue by Country (2023-2028) & (US$ Million)
- Table 52. Europe pH & ORP Sensors Sales by Type (2017-2022) & (K Unit)
- Table 53. Europe pH & ORP Sensors Sales by Application (2017-2022) & (K Unit)
- Table 54. Europe pH & ORP Sensors Sales by Country (2017-2022) & (K Unit)
- Table 55. Europe pH & ORP Sensors Sales by Country (2023-2028) & (K Unit)
- Table 56. Europe pH & ORP Sensors Revenue by Country (2017-2022) & (US$ Million)
- Table 57. Europe pH & ORP Sensors Revenue by Country (2023-2028) & (US$ Million)
- Table 58. Asia Pacific pH & ORP Sensors Sales by Type (2017-2022) & (K Unit)
- Table 59. Asia Pacific pH & ORP Sensors Sales by Application (2017-2022) & (K Unit)
- Table 60. Asia Pacific pH & ORP Sensors Sales by Region (2017-2022) & (K Unit)
- Table 61. Asia Pacific pH & ORP Sensors Sales by Region (2023-2028) & (K Unit)
- Table 62. Asia Pacific pH & ORP Sensors Revenue by Region (2017-2022) & (US$ Million)
- Table 63. Asia Pacific pH & ORP Sensors Revenue by Region (2023-2028) & (US$ Million)
- Table 64. Latin America pH & ORP Sensors Sales by Type (2017-2022) & (K Unit)
- Table 65. Latin America pH & ORP Sensors Sales by Application (2017-2022) & (K Unit)
- Table 66. Latin America pH & ORP Sensors Sales by Country (2017-2022) & (K Unit)
- Table 67. Latin America pH & ORP Sensors Sales by Country (2023-2028) & (K Unit)
- Table 68. Latin America pH & ORP Sensors Revenue by Country (2017-2022) & (US$ Million)
- Table 69. Latin America pH & ORP Sensors Revenue by Country (2023-2028) & (US$ Million)
- Table 70. Middle East and Africa pH & ORP Sensors Sales by Type (2017-2022) & (K Unit)
- Table 71. Middle East and Africa pH & ORP Sensors Sales by Application (2017-2022) & (K Unit)
- Table 72. Middle East and Africa pH & ORP Sensors Sales by Country (2017-2022) & (K Unit)
- Table 73. Middle East and Africa pH & ORP Sensors Sales by Country (2023-2028) & (K Unit)
- Table 74. Middle East and Africa pH & ORP Sensors Revenue by Country (2017-2022) & (US$ Million)
- Table 75. Middle East and Africa pH & ORP Sensors Revenue by Country (2023-2028) & (US$ Million)
- Table 76. ABB Basic Information, Manufacturing Base, Sales Area and Its Competitors
- Table 77. ABB pH & ORP Sensors Sales (K Units), Revenue (Million USD), Price (USD/Unit) and Gross Margin (%) (2017-2022)
- Table 78. Mettler Toledo Basic Information, Manufacturing Base, Sales Area and Its Competitors
- Table 79. Mettler Toledo pH & ORP Sensors Sales (K Units), Revenue (Million USD), Price (USD/Unit) and Gross Margin (%) (2017-2022)
- Table 80. GF Piping Systems Basic Information, Manufacturing Base, Sales Area and Its Competitors
- Table 81. GF Piping Systems pH & ORP Sensors Sales (K Units), Revenue (Million USD), Price (USD/Unit) and Gross Margin (%) (2017-2022)
- Table 82. Endress+Hauser Basic Information, Manufacturing Base, Sales Area and Its Competitors
- Table 83. Endress+Hauser pH & ORP Sensors Sales (K Units), Revenue (Million USD), Price (USD/Unit) and Gross Margin (%) (2017-2022)
- Table 84. Emerson Basic Information, Manufacturing Base, Sales Area and Its Competitors
- Table 85. Emerson pH & ORP Sensors Sales (K Units), Revenue (Million USD), Price (USD/Unit) and Gross Margin (%) (2017-2022)
- Table 86. Honeywell Basic Information, Manufacturing Base, Sales Area and Its Competitors
- Table 87. Honeywell pH & ORP Sensors Sales (K Units), Revenue (Million USD), Price (USD/Unit) and Gross Margin (%) (2017-2022)
- Table 88. Yokogawa Basic Information, Manufacturing Base, Sales Area and Its Competitors
- Table 89. Yokogawa pH & ORP Sensors Sales (K Units), Revenue (Million USD), Price (USD/Unit) and Gross Margin (%) (2017-2022)
- Table 90. Schneider Electric Basic Information, Manufacturing Base, Sales Area and Its Competitors
- Table 91. Schneider Electric pH & ORP Sensors Sales (K Units), Revenue (Million USD), Price (USD/Unit) and Gross Margin (%) (2017-2022)
- Table 92. Thermo Fisher Scientific Basic Information, Manufacturing Base, Sales Area and Its Competitors
- Table 93. Thermo Fisher Scientific pH & ORP Sensors Sales (K Units), Revenue (Million USD), Price (USD/Unit) and Gross Margin (%) (2017-2022)
- Table 94. Xylem Basic Information, Manufacturing Base, Sales Area and Its Competitors
- Table 95. Xylem pH & ORP Sensors Sales (K Units), Revenue (Million USD), Price (USD/Unit) and Gross Margin (%) (2017-2022)
- Table 96. Hamilton Basic Information, Manufacturing Base, Sales Area and Its Competitors
- Table 97. Hamilton pH & ORP Sensors Sales (K Units), Revenue (Million USD), Price (USD/Unit) and Gross Margin (%) (2017-2022)
- Table 98. Hach Basic Information, Manufacturing Base, Sales Area and Its Competitors
- Table 99. Hach pH & ORP Sensors Sales (K Units), Revenue (Million USD), Price (USD/Unit) and Gross Margin (%) (2017-2022)
- Table 100. Burkert Basic Information, Manufacturing Base, Sales Area and Its Competitors
- Table 101. Burkert pH & ORP Sensors Sales (K Units), Revenue (Million USD), Price (USD/Unit) and Gross Margin (%) (2017-2022)
- Table 102. AMETEK (Barben Analytical) Basic Information, Manufacturing Base, Sales Area and Its Competitors
- Table 103. AMETEK (Barben Analytical) pH & ORP Sensors Sales (K Units), Revenue (Million USD), Price (USD/Unit) and Gross Margin (%) (2017-2022)
- Table 104. Sensorex Basic Information, Manufacturing Base, Sales Area and Its Competitors
- Table 105. Sensorex pH & ORP Sensors Sales (K Units), Revenue (Million USD), Price (USD/Unit) and Gross Margin (%) (2017-2022)
- Table 106. GMM Pfaudler Basic Information, Manufacturing Base, Sales Area and Its Competitors
- Table 107. GMM Pfaudler pH & ORP Sensors Sales (K Units), Revenue (Million USD), Price (USD/Unit) and Gross Margin (%) (2017-2022)
- Table 108. Walchem Basic Information, Manufacturing Base, Sales Area and Its Competitors
- Table 109. Walchem pH & ORP Sensors Sales (K Units), Revenue (Million USD), Price (USD/Unit) and Gross Margin (%) (2017-2022)
- Table 110. Turtle Tough Basic Information, Manufacturing Base, Sales Area and Its Competitors
- Table 111. Turtle Tough pH & ORP Sensors Sales (K Units), Revenue (Million USD), Price (USD/Unit) and Gross Margin (%) (2017-2022)
- Table 112. Analytical Technology Basic Information, Manufacturing Base, Sales Area and Its Competitors
- Table 113. Analytical Technology pH & ORP Sensors Sales (K Units), Revenue (Million USD), Price (USD/Unit) and Gross Margin (%) (2017-2022)
- Table 114. Raw Materials Key Suppliers Lists
- Table 115. pH & ORP Sensors Distributors Examples List
- Table 116. pH & ORP Sensors Customers Example List
- Table 117. pH & ORP Sensors Market Trends
- Table 118. pH & ORP Sensors Market Drivers
- Table 119. pH & ORP Sensors Market Challenges
- Table 120. Research Programs/Design for This Report
- Table 121. Key Data Information from Secondary Sources
- Table 122. Key Data Information from Primary Sources
List of Figures
- Figure 1. pH & ORP Sensors Product Picture
- Figure 2. Global pH & ORP Sensors Market Size Growth Rate by Type, 2017 VS 2021 VS 2028 (US$ Million)
- Figure 3. Global pH & ORP Sensors Market Share by Type: 2021 & 2028
- Figure 4. Digital Sensors ABB 100GP-D Product Picture
- Figure 5. Analog Sensors ABB 100 GP Product Picture
- Figure 6. Global pH & ORP Sensors Market Size Growth Rate by Application, 2017 VS 2021 VS 2028 (US$ Million)
- Figure 7. Global pH & ORP Sensors Market Share by Application in 2021 & 2028
- Figure 8. Waste Water
- Figure 9. Pure Water
- Figure 10. Drinking Water
- Figure 11. Others
- Figure 12. pH & ORP Sensors Report Years Considered
- Figure 13. Global pH & ORP Sensors Production Market Share by Region in Percentage: 2021 Versus 2028
- Figure 14. Global pH & ORP Sensors Production Market Share by Region (2017-2022)
- Figure 15. Global pH & ORP Sensors Production Market Share by Region (2023-2028)
- Figure 16. pH & ORP Sensors Production Growth Rate in North America (2017-2028) & (K Units)
- Figure 17. pH & ORP Sensors Production Growth Rate in Europe (2017-2028) & (K Units)
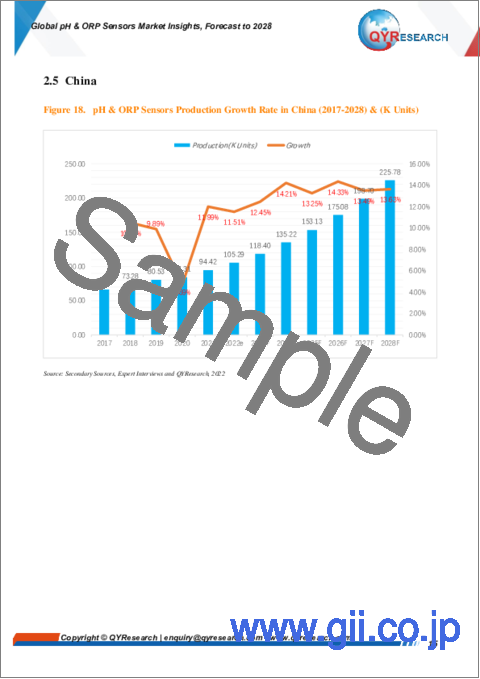
- Figure 18. pH & ORP Sensors Production Growth Rate in China (2017-2028) & (K Units)
- Figure 19. pH & ORP Sensors Production Growth Rate in Japan (2017-2028) & (K Units)
- Figure 20. Global pH & ORP Sensors Sales 2017-2028 (K Units)
- Figure 21. Global pH & ORP Sensors Revenue, (US$ Million), 2017 VS 2021 VS 2028
- Figure 22. Global pH & ORP Sensors Revenue 2017-2028 (US$ Million)
- Figure 23. Global pH & ORP Sensors Revenue Market Share by Region in Percentage: 2021 Versus 2028
- Figure 24. Global pH & ORP Sensors Sales Market Share by Region (2017-2022)
- Figure 25. Global pH & ORP Sensors Sales Market Share by Region (2023-2028)
- Figure 26. North America pH & ORP Sensors Sales YoY (2017-2028) & (K Units)
- Figure 27. North America pH & ORP Sensors Revenue YoY (2017-2028) & (US$ Million)
- Figure 28. Europe pH & ORP Sensors Sales YoY (2017-2028) & (K Units)
- Figure 29. Europe pH & ORP Sensors Revenue YoY (2017-2028) & (US$ Million)
- Figure 30. Asia-Pacific pH & ORP Sensors Sales YoY (2017-2028) & (K Units)
- Figure 31. Asia-Pacific pH & ORP Sensors Revenue YoY (2017-2028) & (US$ Million)
- Figure 32. Latin America pH & ORP Sensors Sales YoY (2017-2028) & (K Units)
- Figure 33. Latin America pH & ORP Sensors Revenue YoY (2017-2028) & (US$ Million)
- Figure 34. Middle East & Africa pH & ORP Sensors Sales YoY (2017-2028) & (K Units)
- Figure 35. Middle East & Africa pH & ORP Sensors Revenue YoY (2017-2028) & (US$ Million)
- Figure 36. The pH & ORP Sensors Market Share of Top 10 and Top 5 Largest Manufacturers Around the World in 2021
- Figure 37. The Top 5 and 10 Largest Manufacturers of pH & ORP Sensors in the World: Market Share by pH & ORP Sensors Revenue in 2021
- Figure 38. Global pH & ORP Sensors Market Share by Company Type (Tier 1, Tier 2, and Tier 3): 2021
- Figure 39. Global pH & ORP Sensors Sales Market Share by Type (2017-2028)
- Figure 40. Global pH & ORP Sensors Revenue Market Share by Type (2017-2028)
- Figure 41. Global pH & ORP Sensors Sales Market Share By Application (2017-2028)
- Figure 42. Global pH & ORP Sensors Revenue Market Share By Application (2017-2028)
- Figure 43. North America pH & ORP Sensors Sales Market Share by Type (2017-2022)
- Figure 44. North America pH & ORP Sensors Sales Market Share by Application (2017-2022)
- Figure 45. North America pH & ORP Sensors Sales Share by Country (2017-2028)
- Figure 46. North America pH & ORP Sensors Revenue Share by Country (2017-2028)
- Figure 47. U.S. pH & ORP Sensors Revenue (2017-2028) & (US$ Million)
- Figure 48. Canada pH & ORP Sensors Revenue (2017-2028) & (US$ Million)
- Figure 49. Europe pH & ORP Sensors Sales Market Share by Type (2017-2022)
- Figure 50. Europe pH & ORP Sensors Sales Market Share by Application (2017-2022)
- Figure 51. Europe pH & ORP Sensors Sales Share by Country (2017-2028)
- Figure 52. Europe pH & ORP Sensors Revenue Share by Country (2017-2028)
- Figure 53. Germany pH & ORP Sensors Revenue (2017-2028) & (US$ Million)
- Figure 54. France pH & ORP Sensors Revenue (2017-2028) & (US$ Million)
- Figure 55. U.K. pH & ORP Sensors Revenue (2017-2028) & (US$ Million)
- Figure 56. Italy pH & ORP Sensors Revenue (2017-2028) & (US$ Million)
- Figure 57. Russia pH & ORP Sensors Revenue (2017-2028) & (US$ Million)
- Figure 58. Asia Pacific pH & ORP Sensors Sales Market Share by Type (2017-2022)
- Figure 59. Asia Pacific pH & ORP Sensors Sales Market Share by Application (2017-2022)
- Figure 60. Asia Pacific pH & ORP Sensors Sales Share by Region (2017-2028)
- Figure 61. Asia Pacific pH & ORP Sensors Revenue Share by Region (2017-2028)
- Figure 62. China pH & ORP Sensors Revenue (2017-2028) & (US$ Million)
- Figure 63. Japan pH & ORP Sensors Revenue (2017-2028) & (US$ Million)
- Figure 64. South Korea pH & ORP Sensors Revenue (2017-2028) & (US$ Million)
- Figure 65. India pH & ORP Sensors Revenue (2017-2028) & (US$ Million)
- Figure 66. Australia pH & ORP Sensors Revenue (2017-2028) & (US$ Million)
- Figure 67. Taiwan pH & ORP Sensors Revenue (2017-2028) & (US$ Million)
- Figure 68. Indonesia pH & ORP Sensors Revenue (2017-2028) & (US$ Million)
- Figure 69. Thailand pH & ORP Sensors Revenue (2017-2028) & (US$ Million)
- Figure 70. Malaysia pH & ORP Sensors Revenue (2017-2028) & (US$ Million)
- Figure 71. Latin America pH & ORP Sensors Sales Market Share by Type (2017-2022)
- Figure 72. Latin America pH & ORP Sensors Sales Market Share by Application (2017-2022)
- Figure 73. Latin America pH & ORP Sensors Sales Share by Country (2017-2028)
- Figure 74. Latin America pH & ORP Sensors Revenue Share by Country (2017-2028)
- Figure 75. Mexico pH & ORP Sensors Revenue (2017-2028) & (US$ Million)
- Figure 76. Brazil pH & ORP Sensors Revenue (2017-2028) & (US$ Million)
- Figure 77. Argentina pH & ORP Sensors Revenue (2017-2028) & (US$ Million)
- Figure 78. Middle East and Africa pH & ORP Sensors Sales Market Share by Type (2017-2022)
- Figure 79. Middle East and Africa pH & ORP Sensors Sales Market Share by Application (2017-2022)
- Figure 80. Middle East and Africa pH & ORP Sensors Sales Share by Country (2017-2028)
- Figure 81. Middle East and Africa pH & ORP Sensors Revenue Share by Country (2017-2028)
- Figure 82. Turkey pH & ORP Sensors Revenue (2017-2028) & (US$ Million)
- Figure 83. Saudi Arabia pH & ORP Sensors Revenue (2017-2028) & (US$ Million)
- Figure 84. UAE pH & ORP Sensors Revenue (2017-2028) & (US$ Million)
- Figure 85. pH & ORP Sensors Product Picture Examples of ABB
- Figure 86. pH & ORP Sensors Product Picture Examples of Mettler Toledo
- Figure 87. pH & ORP Sensors Product Picture Examples of GF Piping Systems
- Figure 88. pH & ORP Sensors Product Picture Examples of Endress+Hauser
- Figure 89. pH & ORP Sensors Rosemount Product Picture Examples of Emerson
- Figure 90. pH & ORP Sensors Product Picture Examples of Honeywell
- Figure 91. pH & ORP Sensors Product Picture Examples of Yokogawa
- Figure 92. pH & ORP Sensors Product Picture Examples of Schneider Electric
- Figure 93. pH & ORP Sensors Product Picture Examples of Thermo Fisher Scientific
- Figure 94. pH & ORP Sensors SensoLyt Product Picture Examples of Xylem
- Figure 95. pH & ORP Sensors Product Picture Examples of Hamilton
- Figure 96. pH & ORP Sensors Product Picture Examples of Hach
- Figure 97. pH & ORP Sensors 8203 Product Picture Examples of Burkert
- Figure 98. pH & ORP Sensors Axial Ion Path Product Picture Examples of AMETEK (Barben Analytical)
- Figure 99. pH & ORP Sensors Product Picture Examples of Sensorex
- Figure 100. pH & ORP Sensors Product Picture Examples of GMM Pfaudler
- Figure 101. pH & ORP Sensors Product Picture Examples of Walchem
- Figure 102. pH & ORP Sensors UltraTough Product Picture Examples of Turtle Tough
- Figure 103. pH & ORP Sensors Q22 PX Product Picture Examples of Analytical Technology
- Figure 104. pH & ORP Sensors Value Chain
- Figure 105. pH & ORP Sensors Production Process
- Figure 106. Distributors Profiles
- Figure 107. Porter's Five Forces Analysis
- Figure 108. Bottom-up and Top-down Approaches for This Report
- Figure 109. Data Triangulation
- Figure 110. Key Executives Interviewed 150
Market Analysis and Insights:
Due to the COVID-19 pandemic, the global pH & ORP Sensors market size is estimated to be worth US$ 576.12 million in 2022 and is forecast to a readjusted size of US$ 847.42 million by 2028 with a CAGR of 6.64% during the forecast period 2022-2028. Fully considering the economic change by this health crisis, Analog Sensors accounting for 54.88% of the pH & ORP Sensors global market in 2021, is projected to value US$ 424.94 million by 2028, growing at a revised 5.20% CAGR from 2022 to 2028. While Waste Water segment is altered to an 7.25% CAGR throughout this forecast period.
China pH & ORP Sensors market size was US$ 57.00 million in 2021, while the US and Europe pH & ORP Sensors were US$ 143.48 million and US$ 162.90 million, severally. The proportion of the US was 26.19% in 2021, while China and Europe are 10.41% and 29.74% respectively, and it is predicted that China proportion will reach 14.34% in 2028, trailing a CAGR of 11.86% through the analysis period. Japan and South Korea are noteworthy markets in Asia, with CAGR 5.46%, and 5.18% respectively for the next 6-year period. As for the Europe pH & ORP Sensors landscape, Germany is projected to reach US$ 47.27 million by 2028 trailing a CAGR of 5.90% over the forecast period.
The global key manufacturers of pH & ORP Sensors include ABB, Mettler Toledo, GF Piping Systems, Endress+Hauser, Emerson, Honeywell and Yokogawa, etc. In 2021, the global top five players hold a share approximately 54.18% in terms of revenue.
In terms of production side, this report researches the pH & ORP Sensors production, growth rate, market share by manufacturers and by region (region level and country level), from 2017 to 2022, and forecast to 2028.
In terms of sales side, this report focuses on the sales of pH & ORP Sensors by region (region level and country level), by company, by Type and by Application. from 2017 to 2022 and forecast to 2028.
Scope and Segment:
pH & ORP Sensors market is segmented by Type, and By Application. Players, stakeholders, and other participants in the global pH & ORP Sensors market will be able to gain the upper hand as they use the report as a powerful resource. The segmental analysis focuses on production capacity, revenue and forecast by Type, and By Application for the period 2017-2028.
By Company
- ABB
- Mettler Toledo
- GF Piping Systems
- Endress+Hauser
- Emerson
- Honeywell
- Yokogawa
- Schneider Electric
- Thermo Fisher Scientific
- Xylem
- Hamilton
- Hach
- Burkert
- AMETEK (Barben Analytical)
- Sensorex
- GMM Pfaudler
- Walchem
- Turtle Tough
- Analytical Technology
Segment by Type
- Digital Sensors
- Analog Sensors
Segment By Application
- Waste Water
- Pure Water
- Drinking Water
- Others
Production by Region
- North America
- Europe
- China
- Japan
Sales by Region
- North America
- U.S.
- Canada
- Asia-Pacific
- China
- Japan
- South Korea
- India
- Australia
- China Taiwan
- Indonesia
- Thailand
- Malaysia
- Europe
- Germany
- France
- U.K.
- Italy
- Russia
- Latin America
- Mexico
- Brazil
- Argentina
- Middle East & Africa
- Turkey
- Saudi Arabia
- UAE
TABLE OF CONTENTS
1 Study Coverage
- 1.1 pH & ORP Sensors Product Introduction
- 1.2 Market by Type
- 1.2.1 Global pH & ORP Sensors Market Size by Type, 2017 VS 2021 VS 2028
- 1.2.2 Digital Sensors
- 1.2.3 Analog Sensors
- 1.3 Market by Application
- 1.3.1 Global pH & ORP Sensors Market Size by Application, 2017 VS 2021 VS 2028
- 1.3.2 Waste Water
- 1.3.3 Pure Water
- 1.3.4 Drinking Water
- 1.3.5 Others
- 1.4 Study Objectives
- 1.5 Years Considered
2 Global pH & ORP Sensors Production
- 2.1 Global pH & ORP Sensors Production by Region: 2017 VS 2021 VS 2028
- 2.2 Global pH & ORP Sensors Production by Region
- 2.2.1 Global pH & ORP Sensors Historic Production by Region (2017-2022)
- 2.2.2 Global pH & ORP Sensors Forecasted Production by Region (2023-2028)
- 2.3 North America
- 2.4 Europe
- 2.5 China
- 2.6 Japan
3 Global pH & ORP Sensors Sales in Volume & Value Estimates and Forecasts
- 3.1 Global pH & ORP Sensors Sales Estimates and Forecasts 2017-2028
- 3.2 Global pH & ORP Sensors Revenue Estimates and Forecasts 2017-2028
- 3.3 Global pH & ORP Sensors Revenue by Region: 2017 VS 2021 VS 2028
- 3.4 Global pH & ORP Sensors Sales by Region
- 3.4.1 Global pH & ORP Sensors Sales by Region (2017-2022)
- 3.4.2 Global Sales pH & ORP Sensors by Region (2023-2028)
- 3.5 Global pH & ORP Sensors Revenue by Region
- 3.5.1 Global pH & ORP Sensors Revenue by Region (2017-2022)
- 3.5.2 Global pH & ORP Sensors Revenue by Region (2023-2028)
- 3.6 North America
- 3.7 Europe
- 3.8 Asia-Pacific
- 3.9 Latin America
- 3.10 Middle East & Africa
4 Competition by Manufacturers
- 4.1 Global pH & ORP Sensors Sales by Manufacturers
- 4.1.1 Global pH & ORP Sensors Sales by Manufacturers (2017-2022)
- 4.1.2 Global pH & ORP Sensors Sales Market Share by Manufacturers (2017-2022)
- 4.1.3 Global Top 10 and Top 5 Largest Manufacturers of pH & ORP Sensors in 2021
- 4.2 Global pH & ORP Sensors Revenue by Manufacturers
- 4.2.1 Global pH & ORP Sensors Revenue by Manufacturers (2017-2022)
- 4.2.2 Global pH & ORP Sensors Revenue Market Share by Manufacturers (2017-2022)
- 4.2.3 Global Top 10 and Top 5 Companies by pH & ORP Sensors Revenue in 2021
- 4.3 Global pH & ORP Sensors Sales Price by Manufacturers (2017-2022)
- 4.4 Analysis of Competitive Landscape
- 4.4.1 Manufacturers Market Concentration Ratio (CR5)
- 4.4.2 Global pH & ORP Sensors Market Share by Company Type (Tier 1, Tier 2, and Tier 3)
- 4.4.3 Global pH & ORP Sensors Manufacturers Geographical Distribution
- 4.5 Mergers & Acquisitions, Expansion Plans
5 Market Size by Type
- 5.1 Global pH & ORP Sensors Sales by Type
- 5.1.1 Global pH & ORP Sensors Historical Sales by Type (2017-2022)
- 5.1.2 Global pH & ORP Sensors Forecasted Sales by Type (2023-2028)
- 5.1.3 Global pH & ORP Sensors Sales Market Share by Type (2017-2028)
- 5.2 Global pH & ORP Sensors Revenue by Type
- 5.2.1 Global pH & ORP Sensors Historical Revenue by Type (2017-2022)
- 5.2.2 Global pH & ORP Sensors Forecasted Revenue by Type (2023-2028)
- 5.2.3 Global pH & ORP Sensors Revenue Market Share by Type (2017-2028)
- 5.3 Global pH & ORP Sensors Price by Type
- 5.3.1 Global pH & ORP Sensors Price by Type (2017-2022)
- 5.3.2 Global pH & ORP Sensors Price Forecast by Type (2023-2028)
6 Market Size By Application
- 6.1 Global pH & ORP Sensors Sales By Application
- 6.1.1 Global pH & ORP Sensors Historical Sales By Application (2017-2022)
- 6.1.2 Global pH & ORP Sensors Forecasted Sales By Application (2023-2028)
- 6.1.3 Global pH & ORP Sensors Sales Market Share By Application (2017-2028)
- 6.2 Global pH & ORP Sensors Revenue By Application
- 6.2.1 Global pH & ORP Sensors Historical Revenue By Application (2017-2022)
- 6.2.2 Global pH & ORP Sensors Forecasted Revenue By Application (2023-2028)
- 6.2.3 Global pH & ORP Sensors Revenue Market Share By Application (2017-2028)
- 6.3 Global pH & ORP Sensors Price By Application
- 6.3.1 Global pH & ORP Sensors Price By Application (2017-2022)
- 6.3.2 Global pH & ORP Sensors Price Forecast By Application (2023-2028)
7 North America
- 7.1 North America pH & ORP Sensors Market Size by Type
- 7.2 North America pH & ORP Sensors Market Size by Application
- 7.3 North America pH & ORP Sensors Sales by Country
- 7.3.1 North America pH & ORP Sensors Sales by Country (2017-2028)
- 7.3.2 North America pH & ORP Sensors Revenue by Country (2017-2028)
- 7.3.3 U.S.
- 7.3.4 Canada
8 Europe
- 8.1 Europe pH & ORP Sensors Market Size by Type
- 8.2 Europe pH & ORP Sensors Market Size by Application
- 8.3 Europe pH & ORP Sensors Market Size by Country
- 8.3.1 Europe pH & ORP Sensors Sales by Country (2017-2028)
- 8.3.2 Europe pH & ORP Sensors Revenue by Country (2017-2028)
- 8.3.3 Germany
- 8.3.4 France
- 8.3.5 U.K.
- 8.3.6 Italy
- 8.3.7 Russia
9 Asia Pacific
- 9.1 Asia Pacific pH & ORP Sensors Market Size by Type
- 9.2 Asia Pacific pH & ORP Sensors Market Size by Application
- 9.3 Asia Pacific pH & ORP Sensors Market Size by Region
- 9.3.1 Asia Pacific pH & ORP Sensors Sales by Region (2017-2028)
- 9.3.2 Asia Pacific pH & ORP Sensors Revenue by Region (2017-2028)
- 9.3.3 China
- 9.3.4 Japan
- 9.3.5 South Korea
- 9.3.6 India
- 9.3.7 Australia
- 9.3.8 Taiwan
- 9.3.9 Indonesia
- 9.3.10 Thailand
- 9.3.11 Malaysia
10 Latin America
- 10.1 Latin America pH & ORP Sensors Market Size by Type
- 10.2 Latin America pH & ORP Sensors Market Size by Application
- 10.3 Latin America pH & ORP Sensors Market Size by Country
- 10.3.1 Latin America pH & ORP Sensors Sales by Country (2017-2028)
- 10.3.2 Latin America pH & ORP Sensors Revenue by Country (2017-2028)
- 10.3.3 Mexico
- 10.3.4 Brazil
- 10.3.5 Argentina
11 Middle East and Africa
- 11.1 Middle East and Africa pH & ORP Sensors Market Size by Type
- 11.2 Middle East and Africa pH & ORP Sensors Market Size by Application
- 11.3 Middle East and Africa pH & ORP Sensors Market Size by Country
- 11.3.1 Middle East and Africa pH & ORP Sensors Sales by Country (2017-2028)
- 11.3.2 Middle East and Africa pH & ORP Sensors Revenue by Country (2017-2028)
- 11.3.3 Turkey
- 11.3.4 Saudi Arabia
- 11.3.5 UAE
12 Corporate Profile
- 12.1 ABB
- 12.1.1 Company Basic Information, Manufacturing Base, Sales Area and Its Competitors
- 12.1.2 pH & ORP Sensors Product Overview
- 12.1.3 ABB pH & ORP Sensors Sales (K Units), Revenue (Million USD), Price (USD/Unit) and Gross Margin (%) (2017-2022)
- 12.1.4 Main Business/Business Overview
- 12.2 Mettler Toledo
- 12.2.1 Company Basic Information, Manufacturing Base, Sales Area and Its Competitors
- 12.2.2 pH & ORP Sensors Product Overview
- 12.2.3 Mettler Toledo pH & ORP Sensors Sales (K Units), Revenue (Million USD), Price (USD/Unit) and Gross Margin (%) (2017-2022)
- 12.2.4 Main Business/Business Overview
- 12.3 GF Piping Systems
- 12.3.1 Company Basic Information, Manufacturing Base, Sales Area and Its Competitors
- 12.3.2 pH & ORP Sensors Product Overview
- 12.3.3 GF Piping Systems pH & ORP Sensors Sales (K Units), Revenue (Million USD), Price (USD/Unit) and Gross Margin (%) (2017-2022)
- 12.3.4 Main Business/Business Overview
- 12.4 Endress+Hauser
- 12.4.1 Company Basic Information, Manufacturing Base, Sales Area and Its Competitors
- 12.4.2 pH & ORP Sensors Product Overview
- 12.4.3 Endress+Hauser pH & ORP Sensors Sales (K Units), Revenue (Million USD), Price (USD/Unit) and Gross Margin (%) (2017-2022)
- 12.4.4 Main Business/Business Overview
- 12.5 Emerson
- 12.5.1 Company Basic Information, Manufacturing Base, Sales Area and Its Competitors
- 12.5.2 pH & ORP Sensors Product Overview
- 12.5.3 Emerson pH & ORP Sensors Sales (K Units), Revenue (Million USD), Price (USD/Unit) and Gross Margin (%) (2017-2022)
- 12.5.4 Main Business/Business Overview
- 12.6 Honeywell
- 12.6.1 Company Basic Information, Manufacturing Base, Sales Area and Its Competitors
- 12.6.2 pH & ORP Sensors Product Overview
- 12.6.3 Honeywell pH & ORP Sensors Sales (K Units), Revenue (Million USD), Price (USD/Unit) and Gross Margin (%) (2017-2022)
- 12.6.4 Main Business/Business Overview
- 12.7 Yokogawa
- 12.7.1 Company Basic Information, Manufacturing Base, Sales Area and Its Competitors
- 12.7.2 pH & ORP Sensors Product Overview
- 12.7.3 Yokogawa pH & ORP Sensors Sales (K Units), Revenue (Million USD), Price (USD/Unit) and Gross Margin (%) (2017-2022)
- 12.7.4 Main Business/Business Overview
- 12.8 Schneider Electric
- 12.8.1 Company Basic Information, Manufacturing Base, Sales Area and Its Competitors
- 12.8.2 pH & ORP Sensors Product Overview
- 12.8.3 Schneider Electric pH & ORP Sensors Sales (K Units), Revenue (Million USD), Price (USD/Unit) and Gross Margin (%) (2017-2022)
- 12.8.4 Main Business/Business Overview
- 12.9 Thermo Fisher Scientific
- 12.9.1 Company Basic Information, Manufacturing Base, Sales Area and Its Competitors
- 12.9.2 pH & ORP Sensors Product Overview
- 12.9.3 Thermo Fisher Scientific pH & ORP Sensors Sales (K Units), Revenue (Million USD), Price (USD/Unit) and Gross Margin (%) (2017-2022)
- 12.9.4 Main Business/Business Overview
- 12.10 Xylem
- 12.10.1 Company Basic Information, Manufacturing Base, Sales Area and Its Competitors
- 12.10.2 pH & ORP Sensors Product Overview
- 12.10.3 Xylem pH & ORP Sensors Sales (K Units), Revenue (Million USD), Price (USD/Unit) and Gross Margin (%) (2017-2022)
- 12.10.4 Main Business/Business Overview
- 12.11 Hamilton
- 12.11.1 Company Basic Information, Manufacturing Base, Sales Area and Its Competitors
- 12.11.2 pH & ORP Sensors Product Overview
- 12.11.3 Hamilton pH & ORP Sensors Sales (K Units), Revenue (Million USD), Price (USD/Unit) and Gross Margin (%) (2017-2022)
- 12.11.4 Main Business/Business Overview
- 12.12 Hach
- 12.12.1 Company Basic Information, Manufacturing Base, Sales Area and Its Competitors
- 12.12.2 pH & ORP Sensors Product Overview
- 12.12.3 Hach pH & ORP Sensors Sales (K Units), Revenue (Million USD), Price (USD/Unit) and Gross Margin (%) (2017-2022)
- 12.12.4 Main Business/Business Overview
- 12.13 Burkert
- 12.13.1 Company Basic Information, Manufacturing Base, Sales Area and Its Competitors
- 12.13.2 pH & ORP Sensors Product Overview
- 12.13.3 Burkert pH & ORP Sensors Sales (K Units), Revenue (Million USD), Price (USD/Unit) and Gross Margin (%) (2017-2022)
- 12.13.4 Main Business/Business Overview
- 12.14 AMETEK (Barben Analytical)
- 12.14.1 Company Basic Information, Manufacturing Base, Sales Area and Its Competitors
- 12.14.2 pH & ORP Sensors Product Overview
- 12.14.3 AMETEK (Barben Analytical) pH & ORP Sensors Sales (K Units), Revenue (Million USD), Price (USD/Unit) and Gross Margin (%) (2017-2022)
- 12.14.4 Main Business/Business Overview
- 12.15 Sensorex
- 12.15.1 Company Basic Information, Manufacturing Base, Sales Area and Its Competitors
- 12.15.2 pH & ORP Sensors Product Overview
- 12.15.3 Sensorex pH & ORP Sensors Sales (K Units), Revenue (Million USD), Price (USD/Unit) and Gross Margin (%) (2017-2022)
- 12.15.4 Main Business/Business Overview
- 12.16 GMM Pfaudler
- 12.16.1 Company Basic Information, Manufacturing Base, Sales Area and Its Competitors
- 12.16.2 pH & ORP Sensors Product Overview
- 12.16.3 GMM Pfaudler pH & ORP Sensors Sales (K Units), Revenue (Million USD), Price (USD/Unit) and Gross Margin (%) (2017-2022)
- 12.16.4 Main Business/Business Overview
- 12.17 Walchem
- 12.17.1 Company Basic Information, Manufacturing Base, Sales Area and Its Competitors
- 12.17.2 pH & ORP Sensors Product Overview
- 12.17.3 Walchem pH & ORP Sensors Sales (K Units), Revenue (Million USD), Price (USD/Unit) and Gross Margin (%) (2017-2022)
- 12.17.4 Main Business/Business Overview
- 12.18 Turtle Tough
- 12.18.1 Company Basic Information, Manufacturing Base, Sales Area and Its Competitors
- 12.18.2 pH & ORP Sensors Product Overview
- 12.18.3 Turtle Tough pH & ORP Sensors Sales (K Units), Revenue (Million USD), Price (USD/Unit) and Gross Margin (%) (2017-2022)
- 12.18.4 Main Business/Business Overview
- 12.19 Analytical Technology
- 12.19.1 Company Basic Information, Manufacturing Base, Sales Area and Its Competitors
- 12.19.2 pH & ORP Sensors Product Overview
- 12.19.3 Analytical Technology pH & ORP Sensors Sales (K Units), Revenue (Million USD), Price (USD/Unit) and Gross Margin (%) (2017-2022)
- 12.19.4 Main Business/Business Overview
13 Industry Chain and Sales Channels Analysis
- 13.1 pH & ORP Sensors Industry Chain Analysis
- 13.2 pH & ORP Sensors Key Raw Materials
- 13.2.1 Key Raw Materials
- 13.2.2 Raw Materials Key Suppliers
- 13.3 pH & ORP Sensors Production Mode & Process
- 13.4 pH & ORP Sensors Sales and Marketing
- 13.4.1 pH & ORP Sensors Distributors
- 13.5 pH & ORP Sensors Customers
14 pH & ORP Sensors Market Dynamics
- 14.1.1 pH & ORP Sensors Industry Trends
- 14.1.2 pH & ORP Sensors Market Drivers
- 14.1.3 pH & ORP Sensors Market Challenges
- 14.1.4 Porter's Five Forces Analysis
15 Key Findings in the Global pH & ORP Sensors Study
16 Appendix
- 16.1 Research Methodology
- 16.1.1 Methodology/Research Approach
- 16.1.2 Data Source
- 16.2 Author Details
- 16.3 Disclaimer