|
|
市場調査レポート
商品コード
1076189
シングルエンドコードの世界市場 (2022年)Global Single End Cord Market Research Report 2022 |
||||||
|
|
|||||||
|
● お客様のご希望に応じて、既存データの加工や未掲載情報(例:国別セグメント)の追加などの対応が可能です。 詳細はお問い合わせください。 |
|||||||


価格
| シングルエンドコードの世界市場 (2022年) |
|
出版日: 2022年05月17日
発行: QYResearch
ページ情報: 英文 124 Pages
納期: 2~3営業日
|
ご注意事項 :
本レポートは最新情報反映のため適宜更新し、内容構成変更を行う場合があります。ご検討の際はお問い合わせください。
- 全表示
- 概要
- 図表
- 目次
概要
当レポートでは、世界のシングルエンドコードの市場について分析し、種類別・用途別・地域別 (国別) の市場動向の見通し (2017年~2028年)、主要企業のプロファイルなどについて調査しております。
目次
第1章 シングルエンドコード:市場概要
- シングルエンドコード:製品の概要と範囲
- 種類別のセグメント
- 市場規模の比較:種類別 (2022年~2028年)
- 販売・市場シェア:種類別
- シングルエンドコードの内訳:種類別
- 用途別のセグメント
- 市場規模の比較:用途別 (2022年~2028年)
- 販売・市場シェア:用途別
- 世界市場の成長見通し
- 世界のシングルエンドコードの収益:推定・予測 (2017年~2028年)
- 世界のシングルエンドコードの生産:推定・予測 (2017年~2028年)
- 地域別の市場規模
- 世界のシングルエンドコードの市場規模:推定・予測、地域別 (2017年・2022年・2028年)
- 欧州:推定・予測 (2017年~2028年)
- 北米:推定・予測 (2017年~2028年)
- アジア太平洋:推定・予測 (2017年~2028年)
- 南米:推定・予測 (2017年~2028年)
- 中東・アフリカ:推定・予測 (2017年~2028年)
第2章 メーカー別の市場競争
- 世界のシングルエンドコードの生産能力・市場シェア:メーカー別 (2017年~2022年)
- 世界のシングルエンドコードの収益・市場シェア:メーカー別 (2017年~2022年)
- 市場シェア:企業の種類別 (ティア1、ティア2、ティア3)
- 世界のシングルエンドコードの平均価格:メーカー別 (2017年~2022年)
- シングルエンドコードメーカーの本社
- シングルエンドコード市場の競争状況と動向
第3章 地域別の生産能力
- 世界のシングルエンドコードの生産能力・市場シェア:地域別 (2017年~2022年)
- 世界のシングルエンドコードの生産・市場シェア:地域別 (2017年~2022年)
- 北米のシングルエンドコードの生産 (2017年~2022年)
- 欧州のシングルエンドコードの生産 (2017年~2022年)
- 中国のシングルエンドコードの生産 (2017年~2022年)
- 他のアジア太平洋諸国のシングルエンドコードの生産 (2017年~2022年)
第4章 シングルエンドコード:地域別の消費
- 世界のシングルエンドコードの消費:地域別
- 消費:地域別
- 消費・市場シェア:地域別
- 収益:地域別
- 収益・市場シェア:地域別
- 北米
- 米国
- カナダ
- メキシコ
- 欧州
- ドイツ
- フランス
- 英国
- イタリア
- ロシア
- アジア太平洋
- 中国
- 日本
- 韓国
- 東南アジア
- インド
- 南米
- ブラジル
- 中東・アフリカ
- 中東
- アフリカ
第5章 種類別のセグメント
- シングルエンドコードの生産・市場シェア:種類別 (2017年~2022年)
- シングルエンドコードの収益・市場シェア:種類別 (2017年~2022年)
- シングルエンドコードの価格:種類別 (2017年~2022年)
第6章 用途別のセグメント
- シングルエンドコードの生産・市場シェア:用途別 (2017年~2022年)
- シングルエンドコードの収益・市場シェア:用途別 (2017年~2022年)
- シングルエンドコードの価格:用途別 (2017年~2022年)
第7章 主要企業のプロファイル
- Mehler
- 企業情報
- 企業・事業の概要
- 製品概略
- 収益・販売・価格・粗利益 (2017年~2022年)
- Glanzstoff
- Kordsa Global
- SKS Textile
- Tejin
- Qingdao Tipont Cord Co., Ltd
- Zhejiang Unifull
- SANWU TEXTILE CO.,LTD.
- Sanlux
- CORDUS
- SHAKTI CORDS
- Wujiang Hongda
- Nantong Heming
- Shandong Helon Polytex
- Shenyang Chenyu
第8章 シングルエンドコードの製造コストの分析
- シングルエンドコードの主要原材料の分析
- 製造コストの構造比率
- シングルエンドコードの産業チェーンの分析
第9章 マーケティングチャネル・流通業者・顧客
- シングルエンドコードのマーケティングチャネルの現状
- 市場でのポジショニング
- 価格戦略
- ブランド戦略
- 顧客の一覧
第10章 市場力学
- 市場動向
- 課題
- 市場促進要因と影響
- 市場リスク
- 業界が直面している主な障壁
- ポーターのファイブフォース分析
第11章 生産・供給予測
- 世界のシングルエンドコードの生産予測:地域別 (2023年~2028年)
- 北米:生産予測 (2023年~2028年)
- 欧州:生産予測 (2023年~2028年)
- 中国:生産予測 (2023年~2028年)
- 他のアジア太平洋諸国:生産予測 (2023年~2028年)
第12章 消費・需要予測
- 世界のシングルエンドコードの予測・需要分析
- 北米:消費予測、国別
- 欧州:消費予測、国別
- アジア太平洋:消費予測、地域別
- 南米:消費予測、国別
- 中東・アフリカ:消費予測、国別
第13章 種類別・用途別の予測
- 世界の生産・収益・価格予測:種類別 (2023年~2028年)
- 世界の生産・収益・価格予測:用途別 (2023年~2028年)
第14章 調査結果と結論
第15章 調査手法とデータソース
図表
LIST OF TABLES
- Table 1. Global Single End Cord Market Size Comparison by Type (2022-2028) (MT) &(US$ Million)
- Table 2. Single End Cord Segment by Type
- Table 3. Global Single End Cord Market Size Comparison by Application (2022-2028) (MT)
- Table 4. Single End Cord Market Size Comparison by Region: 2017 VS 2022 VS 2028
- Table 5. Global Single End Cord Production by Manufacturers (2017-2022) & (MT)
- Table 6. Global Single End Cord Production Market Share by Manufacturers (2017-2022)
- Table 7. Global Single End Cord Revenue by Manufacturers (2017-2022) & (US$ Million)
- Table 8. Global Single End Cord Revenue Share by Manufacturers (2017-2022)
- Table 9. Company Type (Tier 1, Tier 2, and Tier 3) & (based on the Revenue in Single End Cord as of 2021)
- Table 10. Global Market Single End Cord Average Price (US$/MT) of Key Manufacturers (2017-2022)
- Table 11. Single End Cord Manufacturers Headquarters
- Table 12. Global Single End Cord Manufacturers Market Concentration Ratio (CR5 and HHI)
- Table 13. Global Single End Cord Capacity (MT) by Region (2017-2022)
- Table 14. Global Single End Cord Production (MT) by Region (2017-2022)
- Table 15. Global Single End Cord Consumption by Region (2017-2022) & (MT)
- Table 16. Global Single End Cord Consumption Market Share by Region (2017-2022)
- Table 17. Global Single End Cord Revenue by Region (2017-2022) & (MT)
- Table 18. Global Single End Cord Revenue Market Share by Region (2017-2022)
- Table 19. North America Single End Cord Consumption by Country (2017-2022) & (MT)
- Table 20. Europe Single End Cord Consumption by Country (2017-2022) & (MT)
- Table 21. Europe Single End Cord Revenue by Country (2017-2022) & (Million USD)
- Table 22. Asia Pacific Single End Cord Consumption by Region (2017-2022) & (MT)
- Table 23. South America Single End Cord Consumption by Country (2017-2022) & (MT)
- Table 24. Middle East & Africa Single End Cord Consumption by Country (2017-2022) & (MT)
- Table 25. Global Single End Cord Production (MT) by Type (2017-2022)
- Table 26. Global Single End Cord Production Market Share by Type (2017-2022)
- Table 27. Global Single End Cord Revenue (US$ Million) by Type (2017-2022)
- Table 28. Global Single End Cord Revenue Share by Type (2017-2022)
- Table 29. Global Single End Cord Price (US$/MT) by Type (2017-2022)
- Table 30. Global Single End Cord Production (MT) by Application (2017-2022)
- Table 31. Global Single End Cord Production Market Share by Application (2017-2022)
- Table 32. Global Single End Cord Revenue (US$ Million) by Application (2017-2022)
- Table 33. Global Single End Cord Revenue Share by Application (2017-2022)
- Table 34. Global Single End Cord Price (US$/MT) by Application (2017-2022)
- Table 35. Mehler Company Details
- Table 36. Company and Business Overview
- Table 37. Mehler Single End Cord Introduction
- Table 38. Mehler Revenue, Sales, Price and Gross Margin in Single End Cord Business (2017-2022)
- Table 39. Glanzstoff Company Details
- Table 40. Company and Business Overview
- Table 41. Glanzstoff Single End Cord Introduction
- Table 42. Glanzstoff Revenue, Sales, Price and Gross Margin in Single End Cord Business (2017-2022)
- Table 43. Kordsa Global Company Details
- Table 44. Company and Business Overview
- Table 45. Kordsa Global Single End Cord Introduction
- Table 46. Kordsa Global Revenue, Sales, Price and Gross Margin in Single End Cord Business (2017-2022)
- Table 47. SKS Textile Company Details
- Table 48. Company and Business Overview
- Table 49. SKS TEXTILE Single End Cord Introduction
- Table 50. SKS TEXTILE Revenue, Sales, Price and Gross Margin in Single End Cord Business (2017-2022)
- Table 51. Tejin Company Details
- Table 52. Company and Business Overview
- Table 53. Tejin Single End Cord Introduction
- Table 54. Tejin Revenue, Sales, Price and Gross Margin in Single End Cord Business (2017-2022)
- Table 55. Qingdao Tipont Cord Co., Ltd Company Details
- Table 56. Company and Business Overview
- Table 57. Qingdao Tipont Cord Co., Ltd Single End Cord Introduction
- Table 58. Qingdao Tipont Cord Co., Ltd Revenue, Sales, Price and Gross Margin in Single End Cord Business (2017-2022)
- Table 59. Zhejiang Unifull Company Details
- Table 60. Company and Business Overview
- Table 61. Zhejiang Unifull Single End Cord Introduction
- Table 62. Zhejiang Unifull Revenue, Sales, Price and Gross Margin in Single End Cord Business (2017-2022)
- Table 63. SANWU TEXTILE CO.,LTD. Company Details
- Table 64. Company and Business Overview
- Table 65. SANWU TEXTILE CO.,LTD. Single End Cord Introduction
- Table 66. SANWU TEXTILE CO.,LTD. Revenue, Sales, Price and Gross Margin in Single End Cord Business (2017-2022)
- Table 67. Sanlux Company Details
- Table 68. Company and Business Overview
- Table 69. Sanlux Single End Cord Introduction
- Table 70. Sanlux Revenue, Sales, Price and Gross Margin in Single End Cord Business (2017-2022)
- Table 71. CORDUS Company Details
- Table 72. Company and Business Overview
- Table 73. CORDUS Single End Cord Introduction
- Table 74. CORDUS Revenue, Sales, Price and Gross Margin in Single End Cord Business (2017-2022)
- Table 75. SHAKTI CORDS Company Details
- Table 76. Company and Business Overview
- Table 77. SHAKTI CORDS Single End Cord Introduction
- Table 78. SHAKTI CORDS Revenue, Sales, Price and Gross Margin in Single End Cord Business (2017-2022)
- Table 79. Wujiang Hongda Company Details
- Table 80. Company and Business Overview
- Table 81. Wujiang Hongda Single End Cord Introduction
- Table 82. Wujiang Hongda Revenue, Sales, Price and Gross Margin in Single End Cord Business (2017-2022)
- Table 83. Nantong Heming Company Details
- Table 84. Company and Business Overview
- Table 85. Nantong Heming Single End Cord Introduction
- Table 86. Nantong Heming Revenue, Sales, Price and Gross Margin in Single End Cord Business (2017-2022)
- Table 87. Shandong Helon Polytex Company Details
- Table 88. Company and Business Overview
- Table 89. Shandong Helon Polytex Single End Cord Introduction
- Table 90. Shandong Helon Polytex Revenue, Sales, Price and Gross Margin in Single End Cord Business (2017-2022)
- Table 91. Shenyang Chenyu Company Details
- Table 92. Company and Business Overview
- Table 93. Shenyang Chenyu Single End Cord Introduction
- Table 94. Shenyang Chenyu Revenue, Sales, Price and Gross Margin in Single End Cord Business (2017-2022)
- Table 95. Key Raw Materials
- Table 96. Customers List of Single End Cord
- Table 97. Market Key Trends
- Table 98. Key Challenges
- Table 99. Key and Potential Regions of Single End Cord
- Table 100. Market Risks
- Table 101. Industry Enters Major Barriers
- Table 102. Global Single End Cord Production (MT) Forecast by Region (2023-2028)
- Table 103. North America Single End Cord Consumption Forecast by Country (2023-2028) & (MT)
- Table 104. Europe Single End Cord Consumption Forecast by Country (2023-2028) & (MT)
- Table 105. Asia Pacific Single End Cord Consumption Forecast by Region (2023-2028) & (MT)
- Table 106. South America Single End Cord Consumption Forecast by Country (2023-2028) & (MT)
- Table 107. Middle East& Africa Single End Cord Consumption Forecast by Country (2023-2028) & (MT)
- Table 108. Global Single End Cord Production Forecast by Type (2023-2028) & (MT)
- Table 109. Global Single End Cord Production Market Share Forecast by Type (2023-2028)
- Table 110. Global Single End Cord Revenue Forecast by Type (2023-2028) & (US$ Million)
- Table 111. Global Single End Cord Price Forecast by Type (2023-2028) & (US$/MT)
- Table 112. Global Single End Cord Production Forecast by Application (2023-2028) & (MT)
- Table 113. Global Single End Cord Production Market Share Forecast by Application (2023-2028)
- Table 114. Global Single End Cord Revenue Forecast by Application (2023-2028) & (US$ Million)
- Table 115. Global Single End Cord Revenue Market Share Forecast by Application (2023-2028)
- Table 116. Global Single End Cord Price Forecast by Application (2023-2028) & (US$/MT)
- Table 117. Research Programs/Design for This Report
- Table 118. Key Data Information from Secondary Sources
- Table 119. Key Data Information from Primary Sources
List of Figures
- Figure 1. Product Picture of Single End Cord
- Figure 2. Global Single End Cord Market Sales Share by Type in 2021
- Figure 3. Global Single End Cord Market Sales Share by Application in 2021
- Figure 4. Global Single End Cord Market Size 2017-2028 (US$ Million)
- Figure 5. Global Single End Cord Sales 2017-2028 (MT)
- Figure 6. Europe Single End Cord Revenue (US$ Million) Growth Rate (2017-2028)
- Figure 7. North America Single End Cord Revenue (US$ Million) Growth Rate (2017-2028)
- Figure 8. Asia Pacific Single End Cord Revenue (US$ Million) Growth Rate (2017-2028)
- Figure 9. South America Single End Cord Revenue (US$ Million) Growth Rate (2017-2028)
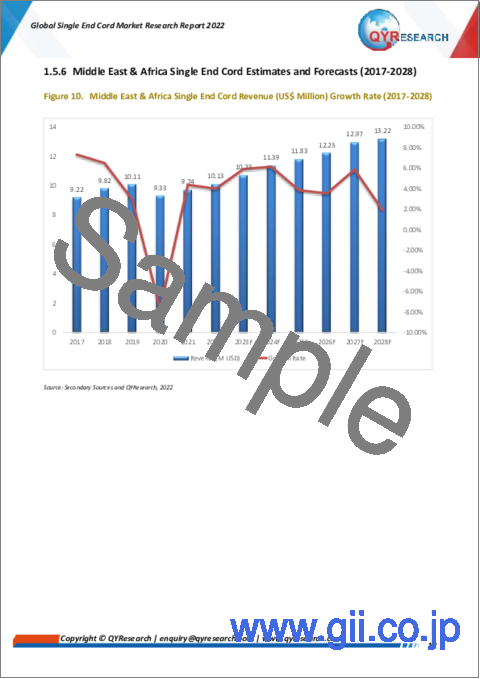
- Figure 10. Middle East & Africa Single End Cord Revenue (US$ Million) Growth Rate (2017-2028)
- Figure 11. Single End Cord Production Share by Manufacturers in 2021
- Figure 12. Global Single End Cord Revenue Share by Manufacturers in 2021
- Figure 13. The Global 3 Largest Players: Market Share by Single End Cord Revenue in 2021
- Figure 14. The Global 5 Largest Players: Market Share by Single End Cord Revenue in 2021
- Figure 15. Global Single End Cord Capacity Market Share by Region (2017-2022)
- Figure 16. Global Single End Cord Production Market Share by Region (2017-2022)
- Figure 17. North America Single End Cord Production (MT) Growth Rate (2017-2022)
- Figure 18. Europe Single End Cord Production (MT) Growth Rate (2017-2022)
- Figure 19. China Single End Cord Production (MT) Growth Rate (2017-2022)
- Figure 20. Asia Other Single End Cord Production (MT) Growth Rate (2017-2022)
- Figure 21. Global Single End Cord Consumption Market Share by Region in 2021
- Figure 22. Global Single End Cord Revenue Market Share by Region in 2021
- Figure 23. North America Single End Cord Revenue by Country (2017-2022) & (Million USD)
- Figure 24. U.S. Single End Cord Consumption and Growth Rate (2017-2022) & (MT)
- Figure 25. Canada Single End Cord Consumption (MT) and Growth Rate (2017-2022)
- Figure 26. Mexico Single End Cord Consumption (MT) and Growth Rate (2017-2022)
- Figure 27. Germany Single End Cord Consumption and Growth Rate (2017-2022) & (MT)
- Figure 28. France Single End Cord Consumption and Growth Rate (2017-2022) & (MT)
- Figure 29. U.K. Single End Cord Consumption and Growth Rate (2017-2022) & (MT)
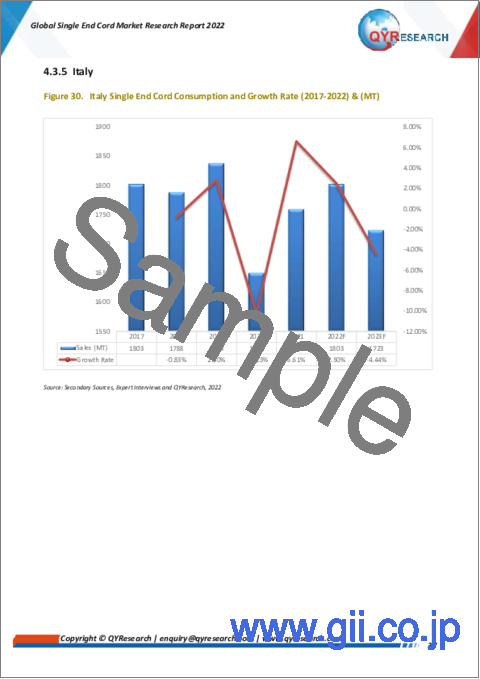
- Figure 30. Italy Single End Cord Consumption and Growth Rate (2017-2022) & (MT)
- Figure 31. Russia Single End Cord Consumption and Growth Rate (2017-2022) & (MT)
- Figure 32. Asia Pacific Single End Cord Revenue by Region(2017-2022) & (Million USD)
- Figure 33. China Single End Cord Consumption and Growth Rate (2017-2022) & (MT)
- Figure 34. Japan Single End Cord Consumption and Growth Rate (2017-2022) & (MT)
- Figure 35. South Korea Single End Cord Consumption and Growth Rate (2017-2022) & (MT)
- Figure 36. Southeast Asia Single End Cord Consumption and Growth Rate (2017-2022) & (MT)
- Figure 37. India Single End Cord Consumption and Growth Rate (2017-2022) & (MT)
- Figure 38. South America Single End Cord Revenue by Country (2017-2022) & (Million USD)
- Figure 39. Brazil Single End Cord Consumption and Growth Rate (2017-2022) & (MT)
- Figure 40. Middle East & Africa Single End Cord Revenue by Country (2017-2022) & (Million USD)
- Figure 41. Middle East Single End Cord Consumption and Growth Rate (2017-2022) & (MT)
- Figure 42. Africa Single End Cord Consumption and Growth Rate (2017-2022) & (MT)
- Figure 43. Production Market Share of Single End Cord by Type in 2021
- Figure 44. Revenue Market Share of Single End Cord by Type in 2021
- Figure 45. Production Market Share of Single End Cord by Application in 2021
- Figure 46. Revenue Market Share of Single End Cord by Application in 2021
- Figure 47. Manufacturing Cost Structure of Single End Cord
- Figure 48. Manufacturing Process Analysis of Single End Cord
- Figure 49. Marketing Channels of Single End Cord by Method
- Figure 50. Porter's Five Forces Analysis
- Figure 51. Global Single End Cord Production Market Share Forecast by Region (2023-2028)
- Figure 52. North America Single End Cord Production (MT) Growth Rate Forecast (2023-2028)
- Figure 53. Europe Single End Cord Production (MT) Growth Rate Forecast (2023-2028)
- Figure 54. China Single End Cord Production (MT) Growth Rate Forecast (2023-2028)
- Figure 55. Asia Other Single End Cord Production (MT) Growth Rate Forecast (2023-2028)
- Figure 56. Global Forecasted Demand Analysis of Single End Cord (2017-2028) & (MT)
- Figure 57. Global Single End Cord Revenue Market Share Forecast by Type (2023-2028)
- Figure 58. Bottom-up and Top-down Approaches for This Report
- Figure 59. Data Triangulation
目次
Segment Analysis:
The research report includes specific segments by region (country), by manufacturers, by Type and by Application. Each type provides information about the production during the forecast period of 2017 to 2028. by Application segment also provides consumption during the forecast period of 2017 to 2028. Understanding the segments helps in identifying the importance of different factors that aid the market growth.
By Company
- Mehler
- Glanzstoff
- Kordsa
- SKS Textiles
- Tejin
- Qingdao Tipont Cord Co., Ltd
- Zhejiang Unifull
- SANWU TEXTILE CO.,LTD.
- Sanlux
- Cordus
- Shakti Cords
- Wujiang Hongda
- Nantong Heming
- Shandong Helon Polytex
- Shenyang Chenyu
Segment by Type
- Polyester Cord
- Nylon Cord
- Others
Segment by Application
- Conveyor Belts
- Hose
- Tire
- Others
Production by Region
- North America
- Europe
- China
- Asia Other
Consumption by Region
- North America
- U.S.
- Canada
- Mexico
- Asia-Pacific
- China
- Japan
- South Korea
- China Taiwan
- Southeast Asia
- India
- Europe
- Germany
- France
- U.K.
- Italy
- Russia
- Rest of Europe
- South America
- Middle East & Africa
TABLE OF CONTENTS
1 SINGLE END CORD MARKET OVERVIEW
- 1.1 Product Overview and Scope of Single End Cord
- 1.2 Single End Cord Segment by Type
- 1.2.1 Global Single End Cord Market Size Comparison by Type (2022-2028)
- 1.2.2 Global Single End Cord Market Sales Share by Type
- 1.2.3 Single End Cord Segment by Type
- 1.3 Single End Cord Segment by Application
- 1.3.1 Global Single End Cord Market Size Comparison by Application (2022-2028)
- 1.3.2 Global Single End Cord Sales Market Share by Application
- 1.4 Global Single End Cord Market Size Estimates and Forecasts.
- 1.4.1 Global Single End Cord Revenue 2017-2028
- 1.4.2 Global Single End Cord Sales 2017-2028
- 1.5 Global Market Size by Region
- 1.5.1 Global Single End Cord Market Size Estimates and Forecasts by Region: 2017 VS 2022 VS 2028
- 1.5.2 Europe Single End Cord Estimates and Forecasts (2017-2028)
- 1.5.3 North America Single End Cord Estimates and Forecasts (2017-2028)
- 1.5.4 Asia Pacific Single End Cord Estimates and Forecasts (2017-2028)
- 1.5.5 South America Single End Cord Estimates and Forecasts (2017-2028)
- 1.5.6 Middle East & Africa Single End Cord Estimates and Forecasts (2017-2028)
2 MARKET COMPETITION BY MANUFACTURERS
- 2.1 Global Single End Cord Production Capacity Market Share by Manufacturers (2017-2022)
- 2.2 Global Single End Cord Revenue Market Share by Manufacturers (2017-2022)
- 2.3 Single End Cord Market Share by Company Type (Tier 1, Tier 2, and Tier 3)
- 2.4 Global Single End Cord Average Price by Manufacturers (2017-2022)
- 2.5 Single End Cord Manufacturers Headquarters
- 2.6 Single End Cord Market Competitive Situation and Trends
- 2.6.1 Single End Cord Market Concentration Rate
- 2.6.2 Global 3 and 5 Largest Single End Cord Players Market Share by Revenue
3 PRODUCTION CAPACITY BY REGION
- 3.1 Global Production Capacity of Single End Cord Market Share by Region (2017-2022)
- 3.2 Global Production of Single End Cord Market Share by Region (2017-2022)
- 3.3 North America Single End Cord Production (2017-2022)
- 3.4 Europe Single End Cord Production (2017-2022)
- 3.5 China Single End Cord Production (2017-2022)
- 3.6 Asia Other Single End Cord Production (2017-2022)
4 SINGLE END CORD CONSUMPTION BY REGION
- 4.1 Global Single End Cord Consumption by Region
- 4.1.1 Global Single End Cord Consumption by Region
- 4.1.2 Global Single End Cord Consumption Market Share by Region
- 4.1.3 Global Single End Cord Revenue by Region
- 4.1.4 Global Single End Cord Revenue Market Share by Region
- 4.2 North America
- 4.2.1 North America Single End Cord Consumption by Country
- 4.2.2 U.S.
- 4.2.3 Canada
- 4.2.4 Mexico
- 4.3 Europe
- 4.3.1 Europe Single End Cord Consumption by Country
- 4.3.2 Germany
- 4.3.3 France
- 4.3.4 U.K.
- 4.3.5 Italy
- 4.3.6 Russia
- 4.4 Asia Pacific
- 4.4.1 Asia Pacific Single End Cord Consumption by Region
- 4.4.2 China
- 4.4.3 Japan
- 4.4.4 South Korea
- 4.4.5 Southeast Asia
- 4.4.6 India
- 4.5 South America
- 4.5.1 South America Single End Cord Consumption by Country
- 4.5.2 Brazil
- 4.6 Middle East & Africa
- 4.6.1 Middle East & Africa Single End Cord Consumption by Country
- 4.6.2 Middle East
- 4.6.3 Africa
5 SEGMENT BY TYPE
- 5.1 Global Single End Cord Production Market Share by Type (2017-2022)
- 5.2 Global Single End Cord Revenue Market Share by Type (2017-2022)
- 5.3 Global Single End Cord Price by Type (2017-2022)
6 SEGMENT BY APPLICATION
- 6.1 Global Single End Cord Production Market Share by Application (2017-2022)
- 6.2 Global Single End Cord Revenue Market Share by Application (2017-2022)
- 6.3 Global Single End Cord Price by Application (2017-2022)
7 KEY COMPANIES PROFILED
- 7.1 Mehler
- 7.1.1 Mehler Company Details
- 7.1.2 Company and Business Overview
- 7.1.3 Single End Cord Introduction
- 7.1.4 Mehler Revenue, Sales, Price and Gross Margin in Single End Cord Business (2017-2022)
- 7.2 Glanzstoff
- 7.2.1 Glanzstoff Company Details
- 7.2.2 Company and Business Overview
- 7.2.3 Single End Cord Introduction
- 7.2.4 Glanzstoff Revenue, Sales, Price and Gross Margin in Single End Cord Business (2017-2022)
- 7.3 Kordsa Global
- 7.3.1 Kordsa Global Company Details
- 7.3.2 Company and Business Overview
- 7.3.3 Single End Cord Introduction
- 7.3.4 Kordsa Global Revenue, Sales, Price and Gross Margin in Single End Cord Business (2017-2022)
- 7.4 SKS Textile
- 7.4.1 SKS Textile Company Details
- 7.4.2 Company and Business Overview
- 7.4.3 Single End Cord Introduction
- 7.4.4 SKS TEXTILE Revenue, Sales, Price and Gross Margin in Single End Cord Business (2017-2022)
- 7.5 Tejin
- 7.5.1 Tejin Company Details
- 7.5.2 Company and Business Overview
- 7.5.3 Single End Cord Introduction
- 7.5.4 Tejin Revenue, Sales, Price and Gross Margin in Single End Cord Business (2017-2022)
- 7.6 Qingdao Tipont Cord Co., Ltd
- 7.6.1 Qingdao Tipont Cord Co., Ltd Company Details
- 7.6.2 Company and Business Overview
- 7.6.3 Single End Cord Introduction
- 7.6.4 Qingdao Tipont Cord Co., Ltd Revenue, Sales, Price and Gross Margin in Single End Cord Business (2017-2022)
- 7.7 Zhejiang Unifull
- 7.7.1 Zhejiang Unifull Company Details
- 7.7.2 Company and Business Overview
- 7.7.3 Single End Cord Introduction
- 7.7.4 Zhejiang Unifull Revenue, Sales, Price and Gross Margin in Single End Cord Business (2017-2022)
- 7.8 SANWU TEXTILE CO.,LTD.
- 7.8.1 SANWU TEXTILE CO.,LTD. Company Details
- 7.8.2 Company and Business Overview
- 7.8.3 Single End Cord Introduction
- 7.8.4 SANWU TEXTILE CO.,LTD. Revenue, Sales, Price and Gross Margin in Single End Cord Business (2017-2022)
- 7.9 Sanlux
- 7.9.1 Sanlux Company Details
- 7.9.2 Company and Business Overview
- 7.9.3 Single End Cord Introduction
- 7.9.4 Sanlux Revenue, Sales, Price and Gross Margin in Single End Cord Business (2017-2022)
- 7.10 CORDUS
- 7.10.1 CORDUS Company Details
- 7.10.2 Company and Business Overview
- 7.10.3 Single End Cord Introduction
- 7.10.4 CORDUS Revenue, Sales, Price and Gross Margin in Single End Cord Business (2017-2022)
- 7.11 SHAKTI CORDS
- 7.11.1 SHAKTI CORDS Company Details
- 7.11.2 Company and Business Overview
- 7.11.3 Single End Cord Introduction
- 7.11.4 SHAKTI CORDS Revenue, Sales, Price and Gross Margin in Single End Cord Business (2017-2022)
- 7.12 Wujiang Hongda
- 7.12.1 Wujiang Hongda Company Details
- 7.12.2 Company and Business Overview
- 7.12.3 Single End Cord Introduction
- 7.12.4 Wujiang Hongda Revenue, Sales, Price and Gross Margin in Single End Cord Business (2017-2022)
- 7.13 Nantong Heming
- 7.13.1 Nantong Heming Company Details
- 7.13.2 Company and Business Overview
- 7.13.3 Single End Cord Introduction
- 7.13.4 Nantong Heming Revenue, Sales, Price and Gross Margin in Single End Cord Business (2017-2022)
- 7.14 Shandong Helon Polytex
- 7.14.1 Shandong Helon Polytex Company Details
- 7.14.2 Company and Business Overview
- 7.14.3 Single End Cord Introduction
- 7.14.4 Shandong Helon Polytex Revenue, Sales, Price and Gross Margin in Single End Cord Business (2017-2022)
- 7.15 Shenyang Chenyu
- 7.15.1 Shenyang Chenyu Company Details
- 7.15.2 Company and Business Overview
- 7.15.3 Single End Cord Introduction
- 7.15.4 Shenyang Chenyu Revenue, Sales, Price and Gross Margin in Single End Cord Business (2017-2022)
8 SINGLE END CORD MANUFACTURING COST ANALYSIS
- 8.1 Single End Cord Key Raw Materials Analysis
- 8.2 Proportion of Manufacturing Cost Structure
- 8.3 Manufacturing Process Analysis of Single End Cord
9 MARKETING CHANNEL, DISTRIBUTORS AND CUSTOMERS
- 9.1 Marketing Channels Status of Single End Cord
- 9.2 Market Positioning
- 9.2.1 Pricing Strategy
- 9.2.2 Brand Strategy
- 9.3 Customers List
10 MARKET DYNAMICS
- 10.1 Market Trends
- 10.2 Challenges
- 10.3 Market Drivers and Impact
- 10.4 Market Risks
- 10.5 Industry Enters Major Barriers
- 10.6 Porter's Five Forces Analysis
11 PRODUCTION AND SUPPLY FORECAST
- 11.1 Global Forecasted Production of Single End Cord by Region (2023-2028)
- 11.2 North America Single End Cord Production Forecast (2023-2028)
- 11.3 Europe Single End Cord Production Forecast (2023-2028)
- 11.4 China Single End Cord Production Forecast (2023-2028)
- 11.5 Asia Other Single End Cord Production Forecast (2023-2028)
12 CONSUMPTION AND DEMAND FORECAST
- 12.1 Global Forecasted Demand Analysis of Single End Cord
- 12.2 North America Forecasted Consumption of Single End Cord by Country
- 12.3 Europe Market Forecasted Consumption of Single End Cord by Country
- 12.4 Asia Pacific Market Forecasted Consumption of Single End Cord by Region
- 12.5 South America Forecasted Consumption of Single End Cord by Country
- 12.6 Middle East& Africa Forecasted Consumption of Single End Cord by Country
13 FORECAST BY TYPE AND BY APPLICATION
- 13.1 Global Production, Revenue and Price Forecast by Type (2023-2028)
- 13.1.1 Global Forecasted Production of Single End Cord by Type (2023-2028)
- 13.1.2 Global Forecasted Revenue of Single End Cord by Type (2023-2028)
- 13.1.3 Global Forecasted Price of Single End Cord by Type (2023-2028)
- 13.2 Global Production, Revenue and Price Forecast by Application (2023-2028)
- 13.2.1 Global Forecasted Production of Single End Cord by Application (2023-2028)
- 13.2.2 Global Forecasted Revenue of Single End Cord by Application (2023-2028)
- 13.2.3 Global Forecasted Price of Single End Cord by Application (2023-2028)
14 RESEARCH FINDINGS AND CONCLUSION
15 METHODOLOGY AND DATA SOURCE
- 15.1 Methodology/Research Approach
- 15.1.1 Research Programs/Design
- 15.1.2 Market Size Estimation
- 15.1.3 Market Breakdown and Data Triangulation
- 15.2 Data Source
- 15.2.1 Secondary Sources
- 15.2.2 Primary Sources
- 15.3 Author List
- 15.4 Disclaimer 110