|
|
市場調査レポート
商品コード
1167456
自動車用ケーブルの世界市場 (2022年):ケーブルの種類別 (トランスミッション、ブレーキ、トレーラー、クラッチ、その他)・エンドユーザー別・流通チャネル別・地域別・国別の分析 (2018年~2028年)Global Automotive Cables Market (2022 Edition) - Analysis by Cable Type (Transmission, Brake, Trailer, Clutch, Others), End Users, Distribution Channel, By Region, By Country (2018-2028) |
||||||
|
|
|||||||


| 自動車用ケーブルの世界市場 (2022年):ケーブルの種類別 (トランスミッション、ブレーキ、トレーラー、クラッチ、その他)・エンドユーザー別・流通チャネル別・地域別・国別の分析 (2018年~2028年) |
|
出版日: 2022年11月30日
発行: Azoth Analytics
ページ情報: 英文 260 Pages
納期: 即納可能
|
- 全表示
- 概要
- 図表
- 目次
世界の自動車用ケーブルの市場規模は、2021年に23億4,000万米ドルに達しました。ダッシュボード用アプリケーションやエアコン、シートウォーマー、照明、ブレーキ、エンジンにおける主要な技術進歩を背景に、市場は今後数年間で成長すると予想されます。
エンドユーザー別に見ると、2028年には乗用車セグメントが最大シェアを占めると予想されます。市場拡大の主な要因は、中所得者層の人口急増と新興国の生活水準の向上がもたらす乗用車の需要増です。また、手頃な価格のオプションが用意されていることも、消費者の嗜好に影響を与える要因となっています。
地域別の市場シェアは、アジア太平洋が最も高く、次いで欧州、南北アメリカとなっています。特にアジア太平洋地域は、中国やインドなど人口の多い国々が存在するため、予測期間中に最も速い成長率を記録すると予想されます。
当レポートでは、世界の自動車用ケーブルの市場について分析し、市場の概略や基本構造、主な市場促進・抑制要因、市場規模の実績値 (2018年~2021年) と予測値 (2023年~2028年)、エンドユーザー別・チャネル別・ケーブルの種類別の詳細動向、地域別・主要国の市場構造・動向、市場の競合情勢と魅力、主要企業のプロファイル・戦略展開状況などを調査しております。
目次
第1章 イントロダクション
第2章 エグゼクティブサマリー
第3章 調査手法
第4章 市場力学
- 促進要因
- 抑制要因
- 機会
- 動向
- 市場力学の影響評価
第5章 新型コロナウイルス感染症 (COVID-19) の影響評価
- COVID-19:自動車用ケーブル市場への影響度の評価
- COVID-19の影響分析:地域別
第6章 ポーターのファイブフォース分析
第7章 マクロ経済指標の見通し
- 世界のGDP成長率:地域別
- 自動車生産
- EV (電気自動車) 販売
- 自動車分野への研究開発投資
- 都市人口
第8章 競争上のポジショニング
- 企業の製品ポジショニング
- 市場ポジション・マトリックス
- 市場シェア分析
- Suprajit Engineering Ltd.
- Thai steel cable public company ltd
- Kongsberg Automotive
- Ficosa International
- Dura Automotive Systems
- Lear Corporation
- Minda Corporation
- Grand Rapids Controls Company LLC.
- HI-LEX Corporation
- LEONI AG
第9章 世界の自動車用ケーブル市場の動向と予測分析 (100万米ドル・CAGR、2018年~2028年)
- マクロ経済要因の影響指数
- 世界の自動車用ケーブル市場:ダッシュボード
- 世界の自動車用ケーブルの市場規模 (単位:100万米ドル、2018年~2021年)
- 世界の自動車用ケーブルの市場規模 (単位:100万米ドル、2022年~2028年)
- 世界の自動車用ケーブル市場:概要
第10章 世界の自動車用ケーブル市場の動向と予測分析:エンドユーザー別 (2018年~2028年)
- 市場概況:エンドユーザー別
- 乗用車
- 商用車
第11章 世界の自動車用ケーブル市場の動向と予測分析:チャネル別 (2018年~2028年)
- 市場概況:チャネル別
- OEM (直接)
- アフターマーケット (間接)
第12章 世界の自動車用ケーブル市場の動向と予測分析:ケーブルの種類別 (2018年~2028年)
- 市場概況:ケーブルの種類別
- トランスミッションケーブル
- ブレーキケーブル
- トレーラーケーブル
- クラッチケーブル
- その他のケーブル
第13章 世界の自動車用ケーブル市場の動向と予測分析:地域別 (2018年~2028年)
- 分析対象地域
第14章 南北アメリカの自動車用ケーブル市場の動向と予測分析 (100万米ドル・CAGR、2018年~2028年)
- マクロ経済要因影響指数
- 自動車用ケーブル市場に対する市場力学の影響分析
- 南北アメリカの自動車用ケーブル市場:ダッシュボード
- 南北アメリカの自動車用ケーブルの市場規模 (単位:100万米ドル、2018年~2021年)
- 南北アメリカの自動車用ケーブルの市場規模 (単位:100万米ドル、2022年~2028年)
- 市場区分
- エンドユーザー別
- チャンネル別
- ケーブルの種類別
- 国別
- 米国
- メキシコ
- ブラジル
- 他の南北アメリカ諸国
第15章 欧州の自動車用ケーブル市場の動向と予測分析 (100万米ドル・CAGR、2018年~2028年)
- マクロ経済要因影響指数
- 自動車用ケーブル市場に対する市場力学の影響分析
- 欧州の自動車用ケーブル市場:ダッシュボード
- 欧州の自動車用ケーブルの市場規模 (単位:100万米ドル、2018年~2021年)
- 欧州の自動車用ケーブルの市場規模 (単位:100万米ドル、2022年~2028年)
- 市場区分
- エンドユーザー別
- チャンネル別
- ケーブルの種類別
- 国別
- ドイツ
- フランス
- スペイン
- 他の欧州諸国
第16章 アジア太平洋の自動車用ケーブル市場の動向と予測分析 (100万米ドル・CAGR、2018年~2028年)
第17章 中東の自動車用ケーブル市場の動向と予測分析 (100万米ドル・CAGR、2018年~2028年)
List of Figures
List of Figures
- Figure 1: Automotive Cables Market for next 7 years (in USD Billions)
- Figure 2: Automotive Cables Market Size, By Channel, 2018 & 2028 (USD Million)
- Figure 3: Automotive Cables Market Size, By Cable Type, 2021 (%)
- Figure 4: Market Share of Prominent Companies of Automotive Cables, 2021 (%)
- Figure 5: Suprajit Engineering Ltd. Revenues, 2019-2021 (USD Million)
- Figure 6: Suprajit Engineering Ltd. Revenue, By Business Segments, 2021 (%)
- Figure 7: Suprajit Engineering Ltd. Revenue, By Geographical Segments, 2021 (%)
- Figure 8: Thai steel Cable Revenues, 2019-2021 (USD Million
- Figure 9: Thai steel Revenue, By Operating Segments, 2020 (%)
- Figure 10: Thai Steel Revenue, By Operating Segments, 2021 (%)
- Figure 11: Kongsberg Automotive Revenues, 2019-2021 (USD Million)
- Figure 12: Kongsberg Automotive Revenue, By Business Segments, 2021 (%)
- Figure 13: Kongsberg Automotive Revenue, By Geographical Segments, 2020 (%)
- Figure 14: Lear Corporation. Revenues, 2018-2020 (USD Million)
- Figure 15: Lear Corporation. Revenue, By Business Segments-, 2020 (%)
- Figure 16: Lear Corporation. Revenue, By Geographical Segments, 2020 (%)
- Figure 17: Minda Corporation Limited Revenues, 2019-2021 (USD Million)
- Figure 18: Minda Corporation Limited Revenue, By Geographical Segments, 2021 (%)
- Figure 19: Minda Corporation Limited Revenue, By Geographical Segments, 2020 (%)
- Figure 20: LEONI AG. Revenues, 2019-2021 (USD Million)
- Figure 21: LEONI AG., Revenue, By Business Segments, 2021 (%)
- Figure 22: LEONI AG., By Geographical Segments, 2021 (%)
- Figure 23: At a CAGR of 9.47% during 2023-2028, the global market value is expected to reach USD 4.27 Billion in2028
- Figure 24: Market Value by Channel, USD Million, 2021
- Figure 25: Basis Point Analysis of Global Automotive Cables Market, By Region (2022,2028)
- Figure 26: Market Opportunity Analysis of Global Automotive Cables Market, By Region (2023-2028)
- Figure 27: Global Automotive Cables Market Size, By Value, 2018-2021(USD Billion)
- Figure 28: Global Automotive Cables Market Size, By Value, 2022-2028 (USD Billion)
- Figure 29: Global Automotive Cables Market Share, By Channel, 2021 (%)
- Figure 30: Global Automotive Cables Market CAGR, By End Users, By Value, 2018-2021, 2023-2028 (%)
- Figure 31: Basis Point Analysis of Global Automotive Cables Market, By End Users (2022,2028)
- Figure 32: Market Opportunity Analysis of Global Automotive Cables Market, By End Users (2023-2028)
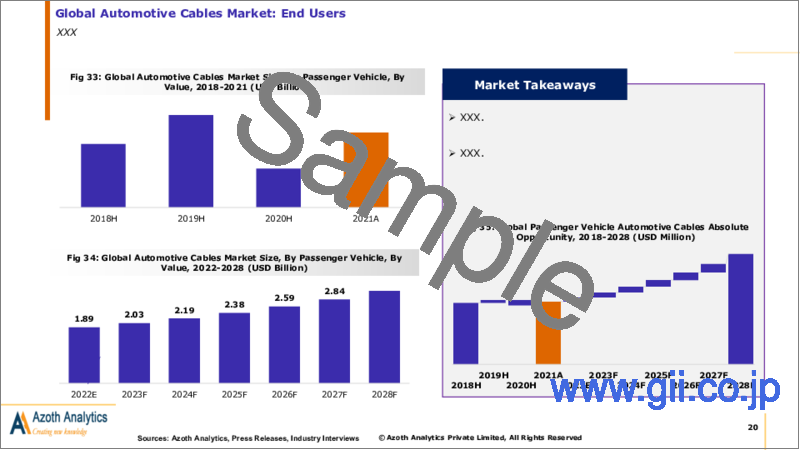
- Figure 33: Global Automotive Cables Market Size, By Passenger Vehicle, By Value, 2018-2021 (USD Billion)
- Figure 34: Global Automotive Cables Market Size, By Passenger Vehicle, By Value, 2022-2028 (USD Billion)
- Figure 35: Global Passenger Vehicle Automotive Cables Absolute Opportunity, 2018-2028 (USD Million)
- Figure 36: Global Automotive Cables Market Size, By Commercial Vehicle, By Value, 2018-2021 (USD Billion)
- Figure 37: Global Automotive Cables Market Size, By Commercial Vehicle, By Value, 2022-2028 (USD Billion)
- Figure 38: Global Commercial Vehicle Automotive Cables Absolute Opportunity, 2018-2028 (USD Million)
- Figure 39: Global Automotive Cables Market CAGR, By Channel, By Value, 2018-2021, 2023-2028 (%)
- Figure 40: Basis Point Analysis of Global Automotive Cables Market, By Channel (2022,2028)
- Figure 41: Market Opportunity Analysis of Global Automotive Cables Market, By Channel (2023-2028)
- Figure 42: Global Automotive Cables Market Size, By OEM (Direct), By Value, 2018-2021 (USD Billion)
- Figure 43: Global Automotive Cables Market Size, By OEM (Direct), By Value, 2022-2028 (USD Billion)
- Figure 44: Global Automotive Cables Market, By OEM (Direct), Absolute Opportunity, By Value, 2018-2028 (USD Million)
- Figure 45: Global Automotive Cables Market Size, By Aftermarket (Indirect), By Value, 2018-2021 (USD Billion)
- Figure 46: Global Automotive Cables Market Size, By Aftermarket (Indirect), By Value, 2022-2028 (USD Billion)
- Figure 47: Global Automotive Cables Market, By Aftermarket (Indirect), Absolute Opportunity, By Value, 2018-2028 (USD Million)
- Figure 48: Global Automotive Cables Market CAGR, By Cable Type, By Value, 2018-2021, 2023-2028 (%)
- Figure 49: Basis Point Analysis of Global Automotive Cables Market, By Cable Type(2022,2028)
- Figure 50: Market Opportunity Analysis of Global Automotive Cables Market, By Cable Type(2023-2028)
- Figure 51: Global Automotive Cables Market Size, By Transmission Cable, By Value, 2018-2021 (USD Billion)
- Figure 52: Global Automotive Cables Market Size, By Transmission Cable, By Value, 2022-2028 (USD Billion)
- Figure 53: Global Automotive Cables Market, By Transmission Cable, Absolute Opportunity, By Value, 2018-2028 (USD Million)
- Figure 54: Global Automotive Cables Market Size, By Brake Cable, By Value, 2018-2021 (USD Billion)
- Figure 55: Global Automotive Cables Market Size, By Brake Cable, By Value, 2022-2028 (USD Billion)
- Figure 56: Global Automotive Cables Market, By Brake Cable, Absolute Opportunity, By Value, 2018-2028 (USD Million)
- Figure 57: Global Automotive Cables Market Size, By Trailer Cable, By Value, 2018-2021 (USD Billion)
- Figure 58: Global Automotive Cables Market Size, By Trailer Cable, By Value, 2022-2028 (USD Billion)
- Figure 59: Global Automotive Cables Market, By Trailer Cable, Absolute Opportunity, By Value, 2018-2028 (USD Million)
- Figure 60: Global Automotive Cables Market Size, By Clutch Cable, By Value, 2018-2021 (USD Billion)
- Figure 61: Global Automotive Cables Market Size, By Clutch Cable, By Value, 2022-2028 (USD Billion)
- Figure 62: Global Automotive Cables Market, By Clutch Cable, Absolute Opportunity, By Value, 2018-2028 (USD Billion)
- Figure 63: Global Automotive Cables Market Size, By Other Cable, By Value, 2018-2021 (USD Billion)
- Figure 64: Global Automotive Cables Market Size, By Other Cable, By Value, 2022-2028 (USD Billion)
- Figure 65: Global Automotive Cables Market, By Other Cable, Absolute Opportunity, By Value, 2018-2028 (USD Billion)
- Figure 66: Market Value of the Americas is expected to grow from USD 0.58 Bn in 2021 to USD 1.06 Billion in 2028
- Figure 67: Global Automotive Cables Market Size, By Other Cable, By Value, 2022-2028 (USD Billion)
- Figure 68: Global Automotive Cables Market, By Other Cable, Absolute Opportunity, By Value, 2018-2028 (USD Billion)
- Figure 66: Market Value of the Americas is expected to grow from USD 0.58 Bn in 2021 to USD 1.06 Billion in 2028
- Figure 67: Market Value by Cable Type
- Figure 68: Market Value by Channel
- Figure 69: Market Value by End Users
- Figure 70a: Basis Point Analysis of Americas Automotive Cables Market, By Country (2022,2028)
- Figure 70b: Market Opportunity Analysis of Americas Automotive Cables Market, By Country (2023-2028)
- Figure 71: Americas Automotive Cables Market Size, By Value, 2018-2021(USD Billion)
- Figure 72: Americas Automotive Cables Market Size, By Value, 2022-2028 (USD Billion)
- Figure 73: Americas Automotive Cables Market Share, By Channel, 2021 (%)
- Figure 74: Americas Automotive Cables Market CAGR, By Value, 2018-2022, 2023-2028 (%)
- Figure 75: Basis Point Analysis of Americas Automotive Cables Market, By Channel (2022,2028)
- Figure 76: Market Opportunity Analysis of Americas Automotive Cables Market, By Channel (2023-2028)
- Figure 77: Americas Automotive Cables Market Size, By Passenger Vehicle, By Value, 2018-2021 (USD Billion)
- Figure 78: Americas Automotive Cables Market Size, By Passenger Vehicle, By Value, 2022-2028 (USD Billion)
- Figure 79: Americas Passenger Vehicle Automotive Cables Footprint in Global Market, 2021 (% of Global Market)
- Figure 80: Americas Automotive Cables Market Size, By Commercial Vehicle, By Value, 2018-2021 (USD Billion)
- Figure 81: Americas Automotive Cables Market Size, By Commercial Vehicle, By Value, 2022-2028 (USD Billion)
- Figure 82: Americas Commercial Vehicle Automotive Cables Footprint in Global Market, 2021 (% of Global Market)
- Figure 83: Americas Automotive Cables Market Size, By OEM (Direct), By Value, 2018-2021 (USD Billion)
- Figure 84: Americas Automotive Cables Market Size, By OEM (Direct), By Value, 2022-2028 (USD Billion)
- Figure 85: Americas OEM (Direct) Automotive Cables Footprint in Global Market, 2021 (% of Global Market)
- Figure 86: Americas Automotive Cables Market Size, By Aftermarket (Indirect), By Value, 2018-2021 (USD Billion)
- Figure 87: Americas Automotive Cables Market Size, By Aftermarket (Indirect), By Value, 2022-2028 (USD Billion)
- Figure 88: Americas Aftermarket (Indirect) Automotive Cables Footprint in Global Market, 2021 (% of Global Market)
- Figure 89: Americas Automotive Cables Market CAGR, By Cable Type, By Value, 2018-2021, 2023-2028 (%)
- Figure 90: Basis Point Analysis of Americas Automotive Cables Market, By Cable Type(2022,2028)
- Figure 91: Market Opportunity Analysis of Americas Automotive Cables Market, By Cable Type(2023-2028)
- Figure 92: Americas Automotive Cables Market Size, By Transmission Cable, By Value, 2018-2021 (USD Billion)
- Figure 93: Americas Automotive Cables Market Size, By Transmission Cable, By Value, 2022-2028 (USD Billion)
- Figure 94: Americas Transmission Cable Automotive Cables Footprint in Global Market, 2021 (% of Global Market)
- Figure 95: Americas Automotive Cables Market Size, By Brake Cable, By Value, 2018-2021 (USD Billion)
- Figure 96: Americas Automotive Cables Market Size, By Brake Cable, By Value, 2022-2028 (USD Billion)
- Figure 97: Americas Brake Cable Automotive Cables Footprint in Global Market, 2021 (% of Global Market)
- Figure 98: Americas Automotive Cables Market Size, By Trailer Cable, By Value, 2018-2021 (USD Billion)
- Figure 99: Americas Automotive Cables Market Size, By Trailer Cable, By Value, 2022-2028 (USD Billion)
- Figure 100: Americas Trailer Cable Automotive Cables Footprint in Global Market, 2021 (% of Global Market)
- Figure 101: Americas Automotive Cables Market Size, By Clutch Cable, By Value, 2018-2021 (USD Billion)
- Figure 102: Americas Automotive Cables Market Size, By Clutch Cable, By Value, 2022-2028 (USD Billion)
- Figure 103: Americas Automotive Cables Market Size, By Clutch Cable, By Value, 2022-2028 (USD Billion)
- Figure 104: Americas Clutch Cable Automotive Cables Footprint in Global Market, 2021 (% of Global Market)
- Figure 105: Americas Automotive Cables Market Size, By Other Cable, By Value, 2018-2021 (USD Billion)
- Figure 106: Americas Automotive Cables Market Size, By Other Cable, By Value, 2022-2028 (USD Billion)
- Figure 107: Americas Other Cable Automotive Cables Footprint in Global Market, 2021 (% of Global Market)
- Figure 108: United States Automotive Cables Market, By Value, 2018-2028 (USD Billion)
- Figure 109: United States Automotive Cables Market, CAGR, By Value, 2018-2021, 2023-2028 (%)
- Figure 110: United States Automotive Cables Footprint in the Americas Market, 2021 (% of Region Market)
- Figure 111: United States Automotive Cables Market Share, By End Users, By Value, 2021 (%)
- Figure 112: United States Automotive Cables Market Share, By Channel, By Value, 2021 (%)
- Figure 113: United States Automotive Cables Market Share, By Cable Type, By Value, 2021 (%)
- Figure 114: Mexico Automotive Cables Market, By Value, 2018-2028 (USD Billion)
- Figure 115: Mexico Automotive Cables Market, CAGR, By Value, 2018-2021, 2023-2028 (%)
- Figure 116: Mexico Automotive Cables Footprint in the Americas Market, 2021 (% of Region Market)
- Figure 117: Mexico Automotive Cables Market Share, By End Users, By Value, 2021 (%)
- Figure 118: Mexico Automotive Cables Market Share, By Channel, By Value, 2021 (%)
- Figure 119: Mexico Automotive Cables Market Share, By Cable Type, By Value, 2021 (%)
- Figure 120: Brazil Automotive Cables Market, By Value, 2018-2028 (USD Billion)
- Figure 121: Brazil Automotive Cables Market, CAGR, By Value, 2018-2021, 2023-2028 (%)
- Figure 122: Brazil Automotive Cables Footprint in the Americas Market, 2021 (% of Region Market)
- Figure 123: Brazil Automotive Cables Market Share, By End Users, By Value, 2021 (%)
- Figure 124: Brazil Automotive Cables Market Share, By Channel, By Value, 2021 (%)
- Figure 125: Brazil Automotive Cables Market Share, By Cable Type, By Value, 2021 (%)
- Figure 126: Rest of Americas Automotive Cables Market, By Value, 2018-2028 (USD Billion)
- Figure 127: Rest of Americas Automotive Cables Market, CAGR, By Value, 2018-2021, 2023-2028 (%)
- Figure 128: Rest of Americas Automotive Cables Footprint in the Americas Market, 2021 (% of Region Market)
- Figure 129: Rest of Americas Automotive Cables Market Share, By End Users, By Value, 2021 (%)
- Figure 130: Rest of Americas Automotive Cables Market Share, By Channel, By Value, 2021 (%)
- Figure 131: Rest of Americas Automotive Cables Market Share, By Cable Type, By Value, 2021 (%)
- Figure 132: Market Value of the Europe is expected to grow from USD 0.72 Bn in 2021 to USD 1.26 Billion in 2028
- Figure 133: Market Value by Cable Type
- Figure 134: Market Value by Channel
- Figure 135: Market Value by End Users
- Figure 136: Basis Point Analysis of Europe Automotive Cables Market, By Country (2022,2028)
- Figure 137: Market Opportunity Analysis of Europe Automotive Cables Market, By Country (2023-2028)
- Figure 138: Europe Automotive Cables Market Size, By Value, 2018-2021(USD Billion)
- Figure 139: Europe Automotive Cables Market Size, By Value, 2022-2028 (USD Billion)
- Figure 140: Europe Automotive Cables Market Share, By Channel, 2021 (%)
- Figure 141: Europe Automotive Cables Market CAGR, By Value, 2018-2022, 2023-2028 (%)
- Figure 142: Basis Point Analysis of Europe Automotive Cables Market, By Channel (2022,2028)
- Figure 143: Market Opportunity Analysis of Europe Automotive Cables Market, By Channel (2023-2028)
- Figure 144: Europe Automotive Cables Market Size, By Passenger Vehicle, By Value, 2018-2021 (USD Billion)
- Figure 145: Europe Automotive Cables Market Size, By Passenger Vehicle, By Value, 2022-2028 (USD Billion)
- Figure 146: Europe Passenger Vehicle Automotive Cables Footprint in Global Market, 2021 (% of Global Market)
- Figure 147: Europe Automotive Cables Market Size, By Commercial Vehicle, By Value, 2018-2021 (USD Billion)
- Figure 148: Europe Automotive Cables Market Size, By Commercial Vehicle, By Value, 2022-2028 (USD Billion)
- Figure 149: Europe Commercial Vehicle Automotive Cables Footprint in Global Market, 2021 (% of Global Market)
- Figure 150: Europe Automotive Cables Market Size, By OEM (Direct), By Value, 2018-2021 (USD Billion)
- Figure 151: Europe Automotive Cables Market Size, By OEM (Direct), By Value, 2022-2028 (USD Billion)
- Figure 152: Europe OEM (Direct) Automotive Cables Footprint in Global Market, 2021 (% of Global Market)
- Figure 153: Europe Automotive Cables Market Size, By Aftermarket (Indirect), By Value, 2018-2021 (USD Billion)
- Figure 154: Europe Automotive Cables Market Size, By Aftermarket (Indirect), By Value, 2022-2028 (USD Billion)
- Figure 155: Europe Aftermarket (Indirect) Automotive Cables Footprint in Global Market, 2021 (% of Global Market)
- Figure 156: Europe Automotive Cables Market CAGR, By Cable Type, By Value, 2018-2021, 2023-2028 (%)
- Figure 157: Basis Point Analysis of Europe Automotive Cables Market, By Cable Type(2022,2028)
- Figure 158: Market Opportunity Analysis of Europe Automotive Cables Market, By Cable Type(2023-2028)
- Figure 159: Europe Automotive Cables Market Size, By Transmission Cable, By Value, 2018-2021 (USD Billion)
- Figure 160: Europe Automotive Cables Market Size, By Transmission Cable, By Value, 2022-2028 (USD Billion)
- Figure 161: Europe Transmission Cable Automotive Cables Footprint in Global Market, 2021 (% of Global Market)
- Figure 162: Europe Automotive Cables Market Size, By Brake Cable, By Value, 2018-2021 (USD Billion)
- Figure 163: Europe Automotive Cables Market Size, By Brake Cable, By Value, 2022-2028 (USD Billion)
- Figure 164: Europe Brake Cable Automotive Cables Footprint in Global Market, 2021 (% of Global Market)
- Figure 165: Europe Automotive Cables Market Size, By Trailer Cable, By Value, 2018-2021 (USD Billion)
- Figure 166: Europe Automotive Cables Market Size, By Trailer Cable, By Value, 2022-2028 (USD Billion)
- Figure 167: Europe Trailer Cable Automotive Cables Footprint in Global Market, 2021 (% of Global Market)
- Figure 168: Europe Automotive Cables Market Size, By Clutch Cable, By Value, 2018-2021 (USD Billion)
- Figure 169: Europe Automotive Cables Market Size, By Clutch Cable, By Value, 2022-2028 (USD Billion)
- Figure 170: Europe Clutch Cable Automotive Cables Footprint in Global Market, 2021 (% of Global Market)
- Figure 171: Europe Automotive Cables Market Size, By Other Cable, By Value, 2018-2021 (USD Billion)
- Figure 172: Europe Automotive Cables Market Size, By Other Cable, By Value, 2022-2028 (USD Billion)
- Figure 173: Europe Other Cable Automotive Cables Footprint in Global Market, 2021 (% of Global Market)
- Figure 174: Germany Automotive Cables Market, By Value, 2018-2028 (USD Billion)
- Figure 175: Germany Automotive Cables Market, CAGR, By Value, 2018-2021, 2023-2028 (%)
- Figure 176: Germany Automotive Cables Footprint in the Europe Market, 2021 (% of Region Market)
- Figure 177: Germany Automotive Cables Market Share, By End Users, By Value, 2021 (%)
- Figure 178: Germany Automotive Cables Market Share, By Channel, By Value, 2021 (%)
- Figure 179: Germany Automotive Cables Market Share, By Cable Type, By Value, 2021 (%)
- Figure 180: France Automotive Cables Market, By Value, 2018-2028 (USD Billion)
- Figure 181: France Automotive Cables Market, CAGR, By Value, 2018-2021, 2023-2028 (%)
- Figure 182: France Automotive Cables Footprint in the Europe Market, 2021 (% of Region Market)
- Figure 183: France Automotive Cables Market Share, By End Users, By Value, 2021 (%)
- Figure 184: France Automotive Cables Market Share, By Channel, By Value, 2021 (%)
- Figure 185: France Automotive Cables Market Share, By Cable Type, By Value, 2021 (%)
- Figure 186: Spain Automotive Cables Market, By Value, 2018-2028 (USD Billion)
- Figure 187: Spain Automotive Cables Market, CAGR, By Value, 2018-2021, 2023-2028 (%)
- Figure 188: Spain Automotive Cables Footprint in the Europe Market, 2021 (% of Region Market)
- Figure 189: Spain Automotive Cables Market Share, By End Users, By Value, 2021 (%)
- Figure 190: Spain Automotive Cables Market Share, By Channel, By Value, 2021 (%)
- Figure 191: Spain Automotive Cables Market Share, By Cable Type, By Value, 2021 (%)
- Figure 192: Rest of Europe Automotive Cables Market, By Value, 2018-2028 (USD Billion)
- Figure 193: Rest of Europe Automotive Cables Market, CAGR, By Value, 2018-2021, 2023-2028 (%)
- Figure 194: Rest of Europe Automotive Cables Footprint in the Europe Market, 2021 (% of Region Market)
- Figure 195: Rest of Europe Automotive Cables Market Share, By End Users, By Value, 2021 (%)
- Figure 196: Rest of Europe Automotive Cables Market Share, By Channel, By Value, 2021 (%)
- Figure 197: Rest of Europe Automotive Cables Market Share, By Cable Type, By Value, 2021 (%)
- Figure 198: Market Value of the Asia Pacific is expected to grow from USD 0.92 Bn in 2021 to USD 1.73 Billion in 2028
- Figure 199: Market Value by Cable Type
- Figure 200: Market Value by Channel
- Figure 201: Market Value by End Users
- Figure 202: Basis Point Analysis of Asia Pacific Automotive Cables Market, By Country (2022,2028)
- Figure 203: Market Opportunity Analysis of Asia Pacific Automotive Cables Market, By Country (2023-2028)
- Figure 204: Asia Pacific Automotive Cables Market Size, By Value, 2018-2021(USD Billion)
- Figure 205: Asia Pacific Automotive Cables Market Size, By Value, 2022-2028 (USD Billion)
- Figure 206: Asia Pacific Automotive Cables Market Share, By Channel, 2021 (%)
- Figure 207: Asia Pacific Automotive Cables Market CAGR, By Value, 2018-2022, 2023-2028 (%)
- Figure 208: Basis Point Analysis of Asia Pacific Automotive Cables Market, By Channel (2022,2028)
- Figure 209: Market Opportunity Analysis of Asia Pacific Automotive Cables Market, By Channel (2023-2028)
- Figure 210: Asia Pacific Automotive Cables Market Size, By Passenger Vehicle, By Value, 2018-2021 (USD Billion)
- Figure 211: Asia Pacific Automotive Cables Market Size, By Passenger Vehicle, By Value, 2022-2028 (USD Billion)
- Figure 212: Asia Pacific Passenger Vehicle Automotive Cables Footprint in Global Market, 2021 (% of Global Market)
- Figure 213: Asia Pacific Automotive Cables Market Size, By Commercial Vehicle, By Value, 2018-2021 (USD Billion)
- Figure 214: Asia Pacific Automotive Cables Market Size, By Commercial Vehicle, By Value, 2022-2028 (USD Billion)
- Figure 215: Asia Pacific Commercial Vehicle Automotive Cables Footprint in Global Market, 2021 (% of Global Market)
- Figure 216: Asia Pacific Automotive Cables Market Size, By OEM (Direct), By Value, 2018-2021 (USD Billion)
- Figure 217: Asia Pacific Automotive Cables Market Size, By OEM (Direct), By Value, 2022-2028 (USD Billion)
- Figure 218: Asia Pacific OEM (Direct) Automotive Cables Footprint in Global Market, 2021 (% of Global Market)
- Figure 219: Asia Pacific Automotive Cables Market Size, By Aftermarket (Indirect), By Value, 2018-2021 (USD Billion)
- Figure 220: Asia Pacific Automotive Cables Market Size, By Aftermarket (Indirect), By Value, 2022-2028 (USD Billion)
- Figure 221: Asia Pacific Aftermarket (Indirect) Automotive Cables Footprint in Global Market, 2021 (% of Global Market)
- Figure 222: Asia Pacific Automotive Cables Market CAGR, By Cable Type, By Value, 2018-2021, 2023-2028 (%)
- Figure 223: Basis Point Analysis of Asia Pacific Automotive Cables Market, By Cable Type(2022,2028)
- Figure 224: Market Opportunity Analysis of Asia Pacific Automotive Cables Market, By Cable Type(2023-2028)
- Figure 225: Asia Pacific Automotive Cables Market Size, By Transmission Cable, By Value, 2018-2021 (USD Billion)
- Figure 226: Asia Pacific Automotive Cables Market Size, By Transmission Cable, By Value, 2022-2028 (USD Billion)
- Figure 227: Asia Pacific Transmission Cable Automotive Cables Footprint in Global Market, 2021 (% of Global Market)
- Figure 228: Asia Pacific Automotive Cables Market Size, By Brake Cable, By Value, 2018-2021 (USD Billion)
- Figure 229: Asia Pacific Automotive Cables Market Size, By Brake Cable, By Value, 2022-2028 (USD Billion)
- Figure 230: Asia Pacific Brake Cable Automotive Cables Footprint in Global Market, 2021 (% of Global Market)
- Figure 231: Asia Pacific Automotive Cables Market Size, By Trailer Cable, By Value, 2018-2021 (USD Billion)
- Figure 232: Asia Pacific Automotive Cables Market Size, By Trailer Cable, By Value, 2022-2028 (USD Billion)
- Figure 233: Asia Pacific Trailer Cable Automotive Cables Footprint in Global Market, 2021 (% of Global Market)
- Figure 234: Asia Pacific Automotive Cables Market Size, By Clutch Cable, By Value, 2018-2021 (USD Billion)
- Figure 235: Asia Pacific Automotive Cables Market Size, By Clutch Cable, By Value, 2022-2028 (USD Billion)
- Figure 236: Asia Pacific Clutch Cable Automotive Cables Footprint in Global Market, 2021 (% of Global Market)
- Figure 237: Asia Pacific Automotive Cables Market Size, By Other Cable, By Value, 2018-2021 (USD Billion)
- Figure 238: Asia Pacific Automotive Cables Market Size, By Other Cable, By Value, 2022-2028 (USD Billion)
- Figure 239: Asia Pacific Other Cable Automotive Cables Footprint in Global Market, 2021 (% of Global Market)
- Figure 240: China Automotive Cables Market, By Value, 2018-2028 (USD Billion)
- Figure 241: China Automotive Cables Market, CAGR, By Value, 2018-2021, 2023-2028 (%)
- Figure 242: China Automotive Cables Footprint in the Asia Pacific Market, 2021 (% of Region Market)
- Figure 243: China Automotive Cables Market Share, By End Users, By Value, 2021 (%)
- Figure 244: China Automotive Cables Market Share, By Channel, By Value, 2021 (%)
- Figure 245: China Automotive Cables Market Share, By Cable Type, By Value, 2021 (%)
- Figure 246: India Automotive Cables Market, By Value, 2018-2028 (USD Billion)
- Figure 247: India Automotive Cables Market, CAGR, By Value, 2018-2021, 2023-2028 (%)
- Figure 248: India Automotive Cables Footprint in the Asia Pacific Market, 2021 (% of Region Market)
- Figure 249: India Automotive Cables Market Share, By End Users, By Value, 2021 (%)
- Figure 250: India Automotive Cables Market Share, By Channel, By Value, 2021 (%)
- Figure 251: India Automotive Cables Market Share, By Cable Type, By Value, 2021 (%)
- Figure 252: Japan Automotive Cables Market, By Value, 2018-2028 (USD Billion)
- Figure 253: Japan Automotive Cables Market, CAGR, By Value, 2018-2021, 2023-2028 (%)
- Figure 254: Japan Automotive Cables Footprint in the Asia Pacific Market, 2021 (% of Region Market)
- Figure 255: Japan Automotive Cables Market Share, By End Users, By Value, 2021 (%)
- Figure 256: Japan Automotive Cables Market Share, By Channel, By Value, 2021 (%)
- Figure 257: Japan Automotive Cables Market Share, By Cable Type, By Value, 2021 (%)
- Figure 258: South Korea Automotive Cables Market, By Value, 2018-2028 (USD Billion)
- Figure 259: South Korea Automotive Cables Market, CAGR, By Value, 2018-2021, 2023-2028 (%)
- Figure 260: South Korea Automotive Cables Footprint in the Asia Pacific Market, 2021 (% of Region Market)
- Figure 261: South Korea Automotive Cables Market Share, By End Users, By Value, 2021 (%)
- Figure 262: South Korea Automotive Cables Market Share, By Channel, By Value, 2021 (%)
- Figure 263: South Korea Automotive Cables Market Share, By Cable Type, By Value, 2021 (%)
- Figure 264: Rest of Asia Pacific Automotive Cables Market, By Value, 2018-2028 (USD Billion)
- Figure 265: Rest of Asia Pacific Automotive Cables Market, CAGR, By Value, 2018-2021, 2023-2028 (%)
- Figure 266: Rest of Asia Pacific Automotive Cables Footprint in the Asia Pacific Market, 2021 (% of Region Market)
- Figure 267: Rest of Asia Pacific Automotive Cables Market Share, By End Users, By Value, 2021 (%)
- Figure 268: Rest of Asia Pacific Automotive Cables Market Share, By Channel, By Value, 2021 (%)
- Figure 269: Rest of Asia Pacific Automotive Cables Market Share, By Cable Type, By Value, 2021 (%)
- Figure 270: Market Value of the Asia Pacific is expected to grow from USD 0.92 Bn in 2021 to USD 0.21 Billion in 2028
- Figure 271: Market Value by Cable Type
- Figure 272: Market Value by Channel
- Figure 273: Market Value by End Users
- Figure 274: Middle East & Africa Automotive Cables Market Size, By Value, 2018-2021(USD Billion)
- Figure 275: Middle East & Africa Automotive Cables Market Size, By Value, 2022-2028 (USD Billion)
- Figure 276: Middle East & Africa Automotive Cables Market Share, By Channel, 2021 (%)
- Figure 277: Middle East & Africa Automotive Cables Market CAGR, By Value, 2018-2022, 2023-2028 (%)
- Figure 278: Basis Point Analysis of Middle East & Africa Automotive Cables Market, By Channel (2022,2028)
- Figure 279: Market Opportunity Analysis of Middle East & Africa Automotive Cables Market, By Channel (2023-2028)
- Figure 280: Middle East & Africa Automotive Cables Market Size, By Passenger Vehicle, By Value, 2018-2021 (USD Billion)
- Figure 281: Middle East & Africa Automotive Cables Market Size, By Passenger Vehicle, By Value, 2022-2028 (USD Billion)
- Figure 282: Middle East & Africa Passenger Vehicle Automotive Cables Footprint in Global Market, 2021 (% of Global Market)
- Figure 283: Middle East & Africa Automotive Cables Market Size, By Commercial Vehicle, By Value, 2018-2021 (USD Billion)
- Figure 284: Middle East & Africa Automotive Cables Market Size, By Commercial Vehicle, By Value, 2022-2028 (USD Billion)
- Figure 285: Middle East & Africa Commercial Vehicle Automotive Cables Footprint in Global Market, 2021 (% of Global Market)
- Figure 286: Middle East & Africa Automotive Cables Market Size, By OEM (Direct), By Value, 2018-2021 (USD Billion)
- Figure 287: Middle East & Africa Automotive Cables Market Size, By OEM (Direct), By Value, 2022-2028 (USD Billion)
- Figure 288: Middle East & Africa OEM (Direct) Automotive Cables Footprint in Global Market, 2021 (% of Global Market)
- Figure 289: Middle East & Africa Automotive Cables Market Size, By Aftermarket (Indirect), By Value, 2018-2021 (USD Billion)
- Figure 290: Middle East & Africa Automotive Cables Market Size, By Aftermarket (Indirect), By Value, 2022-2028 (USD Billion)
- Figure 291: Middle East & Africa Aftermarket (Indirect) Automotive Cables Footprint in Global Market, 2021 (% of Global Market)
- Figure 292: Middle East & Africa Automotive Cables Market CAGR, By Cable Type, By Value, 2018-2021, 2023-2028 (%)
- Figure 293: Basis Point Analysis of Middle East & Africa Automotive Cables Market, By Cable Type(2022,2028)
- Figure 294: Market Opportunity Analysis of Middle East & Africa Automotive Cables Market, By Cable Type(2023-2028)
- Figure 295: Middle East & Africa Automotive Cables Market Size, By Transmission Cable, By Value, 2018-2021 (USD Billion)
- Figure 296: Middle East & Africa Automotive Cables Market Size, By Transmission Cable, By Value, 2022-2028 (USD Billion)
- Figure 297: Middle East & Africa Transmission Cable Automotive Cables Footprint in Global Market, 2021 (% of Global Market)
- Figure 298: Middle East & Africa Automotive Cables Market Size, By Brake Cable, By Value, 2018-2021 (USD Billion)
- Figure 299: Middle East & Africa Automotive Cables Market Size, By Brake Cable, By Value, 2022-2028 (USD Billion)
- Figure 300: Middle East & Africa Brake Cable Automotive Cables Footprint in Global Market, 2021 (% of Global Market)
- Figure 301: Middle East & Africa Automotive Cables Market Size, By Trailer Cable, By Value, 2018-2021 (USD Billion)
- Figure 302: Middle East & Africa Automotive Cables Market Size, By Trailer Cable, By Value, 2022-2028 (USD Billion)
- Figure 303: Middle East & Africa Trailer Cable Automotive Cables Footprint in Global Market, 2021 (% of Global Market)
- Figure 304: Middle East & Africa Automotive Cables Market Size, By Clutch Cable, By Value, 2018-2021 (USD Billion)
- Figure 305: Middle East & Africa Automotive Cables Market Size, By Clutch Cable, By Value, 2022-2028 (USD Billion)
- Figure 306: Middle East & Africa Clutch Cable Automotive Cables Footprint in Global Market, 2021 (% of Global Market)
- Figure 307: Middle East & Africa Automotive Cables Market Size, By Other Cable, By Value, 2018-2021 (USD Billion)
- Figure 308: Middle East & Africa Automotive Cables Market Size, By Other Cable, By Value, 2022-2028 (USD Billion)
- Figure 309: Middle East & Africa Other Cable Automotive Cables Footprint in Global Market, 2021 (% of Global Market)
List of Tables
Table 1: Global Impact of Drivers and Restraints
Table 2: Key Company Financials, 2019-2021
Table 3: Key Company Financials, 2019-2021
Table 4: Key Company Financials, 2019-2021
Table 5: Key Company Financials, 2019-2021
Table 6: Key Company Financials, 2019-2021
Table 7: Key Company Financials, 2019-2021
Table 8: Global Impact of Macro Economic Factors, By Region
Table 9: Americas Impact of Macro Economic Factors, By Country
Table 10: Americas Impact of Drivers and Restraints
Table 11: United States Automotive Cables Market, By End Users, By Value, 2018-2021 (USD Billion)
Table 12: United States Automotive Cables Market, By End Users, By Value, 2022-2028 (USD Billion)
Table 13: United States Automotive Cables Market, By Channel, By Value, 2018-2021 (USD Billion)
Table 14: United States Automotive Cables Market, By Channel, By Value, 2022-2028 (USD Billion)
Table 15: United States Automotive Cables Market, By Cable Type, By Value, 2018-2021 (USD Billion)
Table 15: United States Automotive Cables Market, By Cable Type, By Value, 2018-2021 (USD Billion)
Table 17: Mexico Automotive Cables Market, By End Users, By Value, 2018-2021 (USD Billion)
Table 18: Mexico Automotive Cables Market, By End Users, By Value, 2022-2028 (USD Billion)
Table 19: Mexico Automotive Cables Market, By Channel, By Value, 2018-2021 (USD Billion)
Table 20: Mexico Automotive Cables Market, By Channel, By Value, 2022-2028 (USD Billion)
Table 21: Mexico Automotive Cables Market, By Cable Type, By Value, 2018-2021 (USD Billion)
Table 22: Mexico Automotive Cables Market, By Cable Type, By Value, 2022-2028 (USD Billion)
Table 23: Brazil Automotive Cables Market, By End Users, By Value, 2018-2021 (USD Billion)
Table 24: Brazil Automotive Cables Market, By End Users, By Value, 2022-2028 (USD Billion)
Table 25: Brazil Automotive Cables Market, By Channel, By Value, 2018-2021 (USD Billion)
Table 26: Brazil Automotive Cables Market, By Channel, By Value, 2022-2028 (USD Billion)
Table 27: Brazil Automotive Cables Market, By Cable Type, By Value, 2018-2021 (USD Billion)
Table 28: Brazil Automotive Cables Market, By Cable Type, By Value, 2022-2028 (USD Billion)
Table 29: Rest of Americas Automotive Cables Market, By End Users, By Value, 2018-2021 (USD Billion)
Table 30: Rest of Americas Automotive Cables Market, By End U
Executive Summary
The Global Automotive Cables Market was valued at USD 2.34 Billion in the year 2021. The automotive wire and cable materials market's major players now have new opportunities as a result of the transformation of the automotive industry as a result of advancements in manufacturing and management systems. The market is expected to grow in the upcoming years against the backdrop of major technological advancements in dashboard applications, air conditioners, seat warmers, lighting, brakes, and engines.
Based on the end users' segment, the Passenger vehicle segment is expected to hold the largest share in Automotive Cables in the year 2028. The main factors propelling the market expansion are the rise in demand for passenger cars brought on by the surge in the population of middle-income groups and the rising standard of living in emerging nations. The availability of affordable options in these vehicles is another factor influencing consumer preference for them which will eventually lead towards the healthy growth of the automotive cable market in near future.
APAC region is estimated to hold the maximum share in the global Automotive Cables followed by Europe and the Americas. Also, the Asia Pacific is expected to witness the fastest growth rate during the forecast period due to the presence of most populated countries such as China and India holding potential factors for the market to grow.
The expansion of the automotive cable market will be fueled by the automotive cables' improved performance as a result of technological advancement. Automotive wiring harnesses are built of sturdy materials that are also durable. These bundles are made to perform remarkably well in challenging environments and to carry large power loads. The wire harnesses combine multiple wires into rigid coils that are more stable than loose wires and less likely to cause electrical circuit shorts.
Scope of the Report
- The report presents the analysis of the Automotive Cables market for the historical period of 2018-2021 and the forecast period of 2023-2028.
- The report analyses the Automotive Cables Market by Value (USD Billion).
- The report analyses the Automotive Cables Market by End Users (Passenger Vehicle, Commercial Vehicle).
- The report analyses the Automotive Cables Market by Channel (OEM-Direct, Aftermarket-Indirect).
- The report analyses the Automotive Cables Market by Cable Type- (Transmission Cable, Brake Cable, Trailer Cable, Clutch Cable, Other Cables).
- The Global Automotive Cables Market has been analysed by countries (United States, Mexico, Brazil, Germany, France, Spain, China, Japan, India, South Korea).
- The key insights of the report have been presented through the frameworks of SWOT and Porter's Five Forces Analysis. Also, the attractiveness of the market has been presented by region, by Location and Product.
- Also, the major opportunities, trends, drivers and challenges of the industry has been analysed in the report.
- The report tracks competitive developments, strategies, mergers and acquisitions and new product development. The companies analysed in the report include Suprajit Engineering Ltd., Minda Corporation, Grand Rapids Controls Company LLC, HI-LEX Corporation, Leoni AG, Thai steel cable public company ltd, Kongsberg Automotive, Dura Automotive Systems, Ficosa International, Lear Corporation).
Key Target Audience
- Automotive Industry
- Consulting and Advisory Firms
- Government and Policy Makers
- Regulatory Authorities
Table of Contents
1. Introduction
- 1.1 Automotive Cables Overview
- 1.2 Scope of Research
2. Executive Summary
- 2.1 Market Dashboard
- 2.2 Regional Insights
- 2.3 Market Ecosystem Factors
3. Research Methodology
- 3.1 Data Collection Process
- 3.2 Market Trajectory Estimation
- 3.3 Market Size Calculation
4. Market Dynamics
- 4.1 Drivers
- 4.2 Restraints
- 4.3 Opportunities
- 4.4 Trends
- 4.5 Impact assessment of Market Dynamics
5. Covid-19 Impact Assessment
- 5.1 Assessment of Degree of Impact of Covid-19 on the Automotive Cables Market
- 5.2 Region-Wise Quarterly Covid Impact Analysis
6. Porter's Five Forces Analysis
7. Macro Economic Indicator Outlook
- 7.1 Global, Region-wise GDP Growth
- 7.2 Motor Vehicle Production
- 7.3 EV Sales
- 7.4 R&D Investment in Automotive Sector
- 7.5 Urban Population
8. Competitive Positioning
- 8.1 Companies' Product Positioning
- 8.2 Market Position Matrix
- 8.3 Market Share Analysis
- 8.3.1 Suprajit Engineering Ltd.
- 8.3.2 Thai steel cable public company ltd
- 8.3.3 Kongsberg Automotive
- 8.3.4 Ficosa International
- 8.3.5 Dura Automotive Systems
- 8.3.6 Lear Corporation
- 8.3.7 Minda Corporation
- 8.3.8 Grand Rapids Controls Company LLC.
- 8.3.9 HI-LEX Corporation
- 8.3.10 LEONI AG
9. Global Automotive Cables Market Trends and Forecast Analysis, 2018-2028, USD Million & CAGR
- 9.1 Macro Economic Factor Impact Index
- 9.2 Global Automotive Cables Market: Dashboard
- 9.3 Global Automotive Cables Market Size, By Value, 2018-2021(USD Million)
- 9.4 Global Automotive Cables Market Size, By Value, 2022-2028 (USD Million)
- 9.5 Global Automotive Cables Market: Summary
10. Global Automotive Cables Market Trend And Forecast Analysis, 2018-2028, By End Users
- 10.1 Global Automotive Cables Market Trend And Forecast Analysis, By End Users: Snapshot
- 10.2 Passenger Vehicle
- 10.3 Commercial Vehicle
11. Global Automotive Cables Market Trend And Forecast Analysis, 2018-2028, By Channel
- 11.1 Global Automotive Cables Market Trend And Forecast Analysis, By Channel: Snapshot
- 11.2 OEM (Direct)
- 11.3 Aftermarket (Indirect)
12. Global Automotive Cables Market Trend And Forecast Analysis, 2018-2028, By Cable Type
- 12.1 Global Automotive Cables Market Trend And Forecast Analysis, By Cable Type: Snapshot
- 12.2 Transmission Cable
- 12.3 Brake Cable
- 12.4 Trailer Cable
- 12.5 Clutch Cable
- 12.6 Other Cables
13. Global Automotive Cables Market Trend And Forecast Analysis, 2018-2028, By Region
- 13.1 Regional Coverage of the Study
14. Americas Automotive Cables Market Trends and Forecast Analysis, 2018-2028, USD Million & CAGR
- 14.1 Macro Economic Factor Impact Index
- 14.2 Impact analysis of market dynamics on the Automotive Cables Market
- 14.3 Americas Automotive Cables Market: Dashboard
- 14.4 Americas Automotive Cables Market Size, By Value, 2018-2021(USD Million)
- 14.5 Americas Automotive Cables Market Size, By Value, 2022-2028 (USD Million)
- 14.6 Americas Automotive Cables Market Trend And Forecast Analysis: Segmentation
- 14.6.1 By End Users
- 14.6.2 By Channel
- 14.6.3 By Cable Type
- 14.6.4 By Country
14.6.4.1United States
14.6.4.2Mexico
14.6.4.3Brazil
14.6.4.4Rest of Americas
15. Europe Automotive Cables Market Trends and Forecast Analysis, 2018-2028, USD Million & CAGR
- 15.1 Macro Economic Factor Impact Index
- 15.2 Impact analysis of market dynamics on Automotive Cables Market
- 15.3 Europe Automotive Cables Market: Dashboard
- 15.4 Europe Automotive Cables Market Size, By Value, 2018-2021(USD Million)
- 15.5 Europe Automotive Cables Market Size, By Value, 2022-2028 (USD Million)
- 15.6 Europe Automotive Cables Market Trend And Forecast Analysis: Segmentation
- 15.6.1 By End Users
- 15.6.2 By Channel
- 15.6.3 By Cable Type
- 15.6.4 By Country
15.6.4.1Germany
15.6.4.2France
15.6.4.3Spain
15.6.4.4Rest of Europe
16. Asia Pacific Automotive Cables Market Trends and Forecast Analysis, 2018-2028, USD Million & CAGR
- 16.1 Macro Economic Factor Impact Index
- 16.2 Impact analysis of market dynamics on Automotive Cables Market
- 16.3 Asia Pacific Automotive Cables Market: Dashboard
- 16.4 Asia Pacific Automotive Cables Market Size, By Value, 2018-2021(USD Million)
- 16.5 Asia Pacific Automotive Cables Market Size, By Value, 2022-2028 (USD Million)
- 16.6 Asia Pacific Automotive Cables Market Trend And Forecast Analysis: Segmentation
- 16.6.1 By End Users
- 16.6.2 By Channel
- 16.6.3 By Cable Type
- 16.6.4 By Country
- 16.6.4.1 China
- 16.6.4.2 India
- 16.6.4.3 Japan
- 16.6.4.4 South Korea
- 16.6.4.5 Rest of APAC
17. Middle East Automotive Cables Market Trends and Forecast Analysis, 2018-2028, USD Million & CAGR
- 17.2 Impact analysis of market dynamics on Automotive Cables Market
- 17.3 Middle East Automotive Cables Market: Dashboard
- 17.4 Middle EastAutomotive Cables Market Size, By Value, 2018-2021(USD Million)
- 17.5 Middle East Automotive Cables Market Size, By Value, 2022-2028 (USD Million)
- 17.6 Middle East Automotive Cables Market Trend And Forecast Analysis: Segmentation
- 17.6.1 By End Users
- 17.6.2 By Channel
- 17.6.3 By Cable Type