|
|
市場調査レポート
商品コード
1264182
リングメインユニット (RMU) の市場規模・シェア分析・需要予測 (~2030年):絶縁タイプ・設置・電圧定格・用途別Ring Main Unit Market Size and Share Analysis by Insulation Type, Installation, Voltage Rating, Application - Global Industry Demand Forecast to 2030 |
||||||
|
|
|||||||


| リングメインユニット (RMU) の市場規模・シェア分析・需要予測 (~2030年):絶縁タイプ・設置・電圧定格・用途別 |
|
出版日: 2023年02月01日
発行: Prescient & Strategic Intelligence
ページ情報: 英文 220 Pages
納期: 2~3営業日
|
- 全表示
- 概要
- 図表
- 目次
世界のリングメインユニット (RMU) の市場規模は、2022年の22億2,000万米ドルから、予測期間中はCAGR6.5%で推移し、2030年には36億7,400万米ドルの規模に成長すると予測されています。
この背景には、現在のトランスミッションに改良を加えたサブシステムを導入する需要が高まっていることが挙げられます。また、交換が容易なRMUの設置に注目が集まっていることも、需要を押し上げる主な理由です。さらに、再生可能エネルギーや二次配電網の利用が増加していることも、促進要因として重要です。電力需要の高まりがRMUなどの送電デバイスの売上を急増させています。
当レポートでは、世界のリングメインユニット (RMU) の市場を調査し、市場の定義と概要、市場影響因子の分析、市場規模の推移・予測、各種区分・地域別の詳細分析、競合環境、主要企業のプロファイルなどをまとめています。
目次
第1章 調査範囲
第2章 調査手法
第3章 エグゼクティブサマリー
第4章 産業の専門家/KOLの見解
第5章 市場指標
第6章 産業の見通し
- 市場力学
- 動向
- 促進要因
- 抑制要因・課題
- 促進要因/抑制要因の影響分析
- COVID-19の影響
- ポーターのファイブフォース分析
第7章 世界市場
- 概要
- 市場収益の推移・予測:絶縁タイプ別
- 市場収益の推移・予測:設置別
- 市場収益の推移・予測:電圧定格別
- 市場収益の推移・予測:用途別
- 市場収益の推移・予測:地域別
第8章 北米市場
第9章 欧州市場
第10章 アジア太平洋市場
第11章 ラテンアメリカ市場
第12章 中東・アフリカ市場
第13章 米国市場
第14章 カナダ市場
第15章 ドイツ市場
第16章 フランス市場
第17章 英国市場
第18章 イタリア市場
第19章 スペイン市場
第20章 日本市場
第21章 中国市場
第22章 インド市場
第23章 オーストラリア市場
第24章 韓国市場
第25章 ブラジル市場
第26章 メキシコ市場
第27章 サウジアラビア市場
第28章 南アフリカ市場
第29章 UAE市場
第30章 競合情勢
- 主要企業・製品のリスト
- 主要企業の競合ベンチマーキング
- 主要企業の製品ベンチマーク
- 最近の戦略的展開
第31章 企業プロファイル
- ABB Ltd.
- Siemens AG
- Eaton Corporation plc
- Schneider Electric SE
- Toshiba Corporation
- NATUS GmbH & Co. KG
- China Transpowers Electric Co. Limited
- BVM Technologies Private Limited
- Wenzhou Rockwill Electric Co. Ltd.
- LS ELECTRIC Co. Ltd.
- Lucy Group Ltd.
- C&S Electric limited
- The International Electrical Products Company
- ENTEC Electric & Electronic Co. Ltd.
- Orecco electric
第32章 付録
LIST OF FIGURES
- FIG 1 MARKET SIZE BREAKDOWN BY SEGMENT
- FIG 2 RESEARCH METHODOLOGY
- FIG 3 BREAKDOWN OF PRIMARY RESEARCH, BY REGION
- FIG 4 BREAKDOWN OF PRIMARY RESEARCH, BY DESIGNATION
- FIG 5 BREAKDOWN OF PRIMARY RESEARCH, BY COMPANY TYPE
- FIG 6 DATA TRIANGULATION APPROACH
- FIG 7 CURRENCY CONVERSION RATES FOR USD (2022)
- FIG 8 GLOBAL RING MAIN UNIT MARKET SUMMARY
- FIG 9 BARGAINING POWER OF BUYERS
- FIG 10 BARGAINING POWER OF SUPPLIERS
- FIG 11 THREAT OF NEW ENTRANTS
- FIG 12 INTENSITY OF RIVALRY
- FIG 13 THREAT OF SUBSTITUTES
- FIG 14 GLOBAL RING MAIN UNIT MARKET SNAPSHOT
- FIG 15 GLOBAL RING MAIN UNIT MARKET, BY INSULATION TYPE, $M (2017-2030)
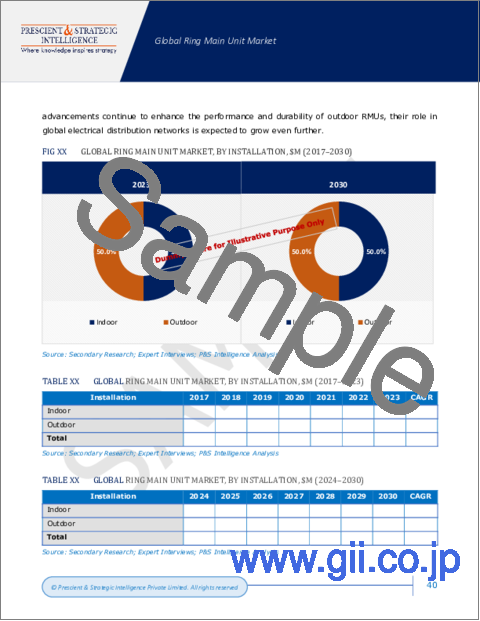
- FIG 16 GLOBAL RING MAIN UNIT MARKET, BY INSTALLATION, $M (2017-2030)
- FIG 17 GLOBAL RING MAIN UNIT MARKET, BY VOLTAGE RATING, $M (2017-2030)
- FIG 18 GLOBAL RING MAIN UNIT MARKET, BY APPLICATION, $M (2017-2030)
- FIG 19 MAJOR WORLDWIDE MARKETS FOR RING MAIN UNITS, $M
- FIG 20 NORTH AMERICA RING MAIN UNIT MARKET SNAPSHOT
- FIG 21 NORTH AMERICA RING MAIN UNIT MARKET, BY INSULATION TYPE, $M (2017-2030)
- FIG 22 NORTH AMERICA RING MAIN UNIT MARKET, BY INSTALLATION, $M (2017-2030)
- FIG 23 NORTH AMERICA RING MAIN UNIT MARKET, BY VOLTAGE RATING, $M (2017-2030)
- FIG 24 NORTH AMERICA RING MAIN UNIT MARKET, BY APPLICATION, $M (2017-2030)
- FIG 25 NORTH AMERICA RING MAIN UNIT MARKET, BY COUNTRY, $M (2017-2030)
- FIG 26 EUROPE RING MAIN UNIT MARKET SNAPSHOT
- FIG 27 EUROPE RING MAIN UNIT MARKET, BY INSULATION TYPE, $M (2017-2030)
- FIG 28 EUROPE RING MAIN UNIT MARKET, BY INSTALLATION, $M (2017-2030)
- FIG 29 EUROPE RING MAIN UNIT MARKET, BY VOLTAGE RATING, $M (2017-2030)
- FIG 30 EUROPE RING MAIN UNIT MARKET, BY APPLICATION, $M (2017-2030)
- FIG 31 EUROPE RING MAIN UNIT MARKET, BY COUNTRY, $M (2017-2030)
- FIG 32 APAC RING MAIN UNIT MARKET SNAPSHOT
- FIG 33 APAC RING MAIN UNIT MARKET, BY INSULATION TYPE, $M (2017-2030)
- FIG 34 APAC RING MAIN UNIT MARKET, BY INSTALLATION, $M (2017-2030)
- FIG 35 APAC RING MAIN UNIT MARKET, BY VOLTAGE RATING, $M (2017-2030)
- FIG 36 APAC RING MAIN UNIT MARKET, BY APPLICATION, $M (2017-2030)
- FIG 37 APAC RING MAIN UNIT MARKET, BY COUNTRY, $M (2017-2030)
- FIG 38 LATAM RING MAIN UNIT MARKET SNAPSHOT
- FIG 39 LATAM RING MAIN UNIT MARKET, BY INSULATION TYPE, $M (2017-2030)
- FIG 40 LATAM RING MAIN UNIT MARKET, BY INSTALLATION, $M (2017-2030)
- FIG 41 LATAM RING MAIN UNIT MARKET, BY VOLTAGE RATING, $M (2017-2030)
- FIG 42 LATAM RING MAIN UNIT MARKET, BY APPLICATION, $M (2017-2030)
- FIG 43 LATAM RING MAIN UNIT MARKET, BY COUNTRY, $M (2017-2030)
- FIG 44 MEA RING MAIN UNIT MARKET SNAPSHOT
- FIG 45 MEA RING MAIN UNIT MARKET, BY INSULATION TYPE, $M (2017-2030)
- FIG 46 MEA RING MAIN UNIT MARKET, BY INSTALLATION, $M (2017-2030)
- FIG 47 MEA RING MAIN UNIT MARKET, BY VOLTAGE RATING, $M (2017-2030)
- FIG 48 MEA RING MAIN UNIT MARKET, BY APPLICATION, $M (2017-2030)
- FIG 49 MEA RING MAIN UNIT MARKET, BY COUNTRY, $M (2017-2030)
- FIG 50 U.S. RING MAIN UNIT MARKET, BY INSULATION TYPE, $M (2017-2030)
- FIG 51 U.S. RING MAIN UNIT MARKET, BY INSTALLATION, $M (2017-2030)
- FIG 52 U.S. RING MAIN UNIT MARKET, BY VOLTAGE RATING, $M (2017-2030)
- FIG 53 U.S. RING MAIN UNIT MARKET, BY APPLICATION, $M (2017-2030)
- FIG 54 CANADA RING MAIN UNIT MARKET, BY INSULATION TYPE, $M (2017-2030)
- FIG 55 CANADA RING MAIN UNIT MARKET, BY INSTALLATION, $M (2017-2030)
- FIG 56 CANADA RING MAIN UNIT MARKET, BY VOLTAGE RATING, $M (2017-2030)
- FIG 57 CANADA RING MAIN UNIT MARKET, BY APPLICATION, $M (2017-2030)
- FIG 58 GERMANY RING MAIN UNIT MARKET, BY INSULATION TYPE, $M (2017-2030)
- FIG 59 GERMANY RING MAIN UNIT MARKET, BY INSTALLATION, $M (2017-2030)
- FIG 60 GERMANY RING MAIN UNIT MARKET, BY VOLTAGE RATING, $M (2017-2030)
- FIG 61 GERMANY RING MAIN UNIT MARKET, BY APPLICATION, $M (2017-2030)
- FIG 62 FRANCE RING MAIN UNIT MARKET, BY INSULATION TYPE, $M (2017-2030)
- FIG 63 FRANCE RING MAIN UNIT MARKET, BY INSTALLATION, $M (2017-2030)
- FIG 64 FRANCE RING MAIN UNIT MARKET, BY VOLTAGE RATING, $M (2017-2030)
- FIG 65 FRANCE RING MAIN UNIT MARKET, BY APPLICATION, $M (2017-2030)
- FIG 66 U.K. RING MAIN UNIT MARKET, BY INSULATION TYPE, $M (2017-2030)
- FIG 67 U.K. RING MAIN UNIT MARKET, BY INSTALLATION, $M (2017-2030)
- FIG 68 U.K. RING MAIN UNIT MARKET, BY VOLTAGE RATING, $M (2017-2030)
- FIG 69 U.K. RING MAIN UNIT MARKET, BY APPLICATION, $M (2017-2030)
- FIG 70 ITALY RING MAIN UNIT MARKET, BY INSULATION TYPE, $M (2017-2030)
- FIG 71 ITALY RING MAIN UNIT MARKET, BY INSTALLATION, $M (2017-2030)
- FIG 72 ITALY RING MAIN UNIT MARKET, BY VOLTAGE RATING, $M (2017-2030)
- FIG 73 ITALY RING MAIN UNIT MARKET, BY APPLICATION, $M (2017-2030)
- FIG 74 SPAIN RING MAIN UNIT MARKET, BY INSULATION TYPE, $M (2017-2030)
- FIG 75 SPAIN RING MAIN UNIT MARKET, BY INSTALLATION, $M (2017-2030)
- FIG 76 SPAIN RING MAIN UNIT MARKET, BY VOLTAGE RATING, $M (2017-2030)
- FIG 77 SPAIN RING MAIN UNIT MARKET, BY APPLICATION, $M (2017-2030)
- FIG 78 JAPAN RING MAIN UNIT MARKET, BY INSULATION TYPE, $M (2017-2030)
- FIG 79 JAPAN RING MAIN UNIT MARKET, BY INSTALLATION, $M (2017-2030)
- FIG 80 JAPAN RING MAIN UNIT MARKET, BY VOLTAGE RATING, $M (2017-2030)
- FIG 81 JAPAN RING MAIN UNIT MARKET, BY APPLICATION, $M (2017-2030)
- FIG 82 CHINA RING MAIN UNIT MARKET, BY INSULATION TYPE, $M (2017-2030)
- FIG 83 CHINA RING MAIN UNIT MARKET, BY INSTALLATION, $M (2017-2030)
- FIG 84 CHINA RING MAIN UNIT MARKET, BY VOLTAGE RATING, $M (2017-2030)
- FIG 85 CHINA RING MAIN UNIT MARKET, BY APPLICATION, $M (2017-2030)
- FIG 86 INDIA RING MAIN UNIT MARKET, BY INSULATION TYPE, $M (2017-2030)
- FIG 87 INDIA RING MAIN UNIT MARKET, BY INSTALLATION, $M (2017-2030)
- FIG 88 INDIA RING MAIN UNIT MARKET, BY VOLTAGE RATING, $M (2017-2030)
- FIG 89 INDIA RING MAIN UNIT MARKET, BY APPLICATION, $M (2017-2030)
- FIG 90 AUSTRALIA RING MAIN UNIT MARKET, BY INSULATION TYPE, $M (2017-2030)
- FIG 91 AUSTRALIA RING MAIN UNIT MARKET, BY INSTALLATION, $M (2017-2030)
- FIG 92 AUSTRALIA RING MAIN UNIT MARKET, BY VOLTAGE RATING, $M (2017-2030)
- FIG 93 AUSTRALIA RING MAIN UNIT MARKET, BY APPLICATION, $M (2017-2030)
- FIG 94 SOUTH KOREA RING MAIN UNIT MARKET, BY INSULATION TYPE, $M (2017-2030)
- FIG 95 SOUTH KOREA RING MAIN UNIT MARKET, BY INSTALLATION, $M (2017-2030)
- FIG 96 SOUTH KOREA RING MAIN UNIT MARKET, BY VOLTAGE RATING, $M (2017-2030)
- FIG 97 SOUTH KOREA RING MAIN UNIT MARKET, BY APPLICATION, $M (2017-2030)
- FIG 98 BRAZIL RING MAIN UNIT MARKET, BY INSULATION TYPE, $M (2017-2030)
- FIG 99 BRAZIL RING MAIN UNIT MARKET, BY INSTALLATION, $M (2017-2030)
- FIG 100 BRAZIL RING MAIN UNIT MARKET, BY VOLTAGE RATING, $M (2017-2030)
- FIG 101 BRAZIL RING MAIN UNIT MARKET, BY APPLICATION, $M (2017-2030)
- FIG 102 MEXICO RING MAIN UNIT MARKET, BY INSULATION TYPE, $M (2017-2030)
- FIG 103 MEXICO RING MAIN UNIT MARKET, BY INSTALLATION, $M (2017-2030)
- FIG 104 MEXICO RING MAIN UNIT MARKET, BY VOLTAGE RATING, $M (2017-2030)
- FIG 105 MEXICO RING MAIN UNIT MARKET, BY APPLICATION, $M (2017-2030)
- FIG 106 SAUDI ARABIA RING MAIN UNIT MARKET, BY INSULATION TYPE, $M (2017-2030)
- FIG 107 SAUDI ARABIA RING MAIN UNIT MARKET, BY INSTALLATION, $M (2017-2030)
- FIG 108 SAUDI ARABIA RING MAIN UNIT MARKET, BY VOLTAGE RATING, $M (2017-2030)
- FIG 109 SAUDI ARABIA RING MAIN UNIT MARKET, BY APPLICATION, $M (2017-2030)
- FIG 110 SOUTH AFRICA RING MAIN UNIT MARKET, BY INSULATION TYPE, $M (2017-2030)
- FIG 111 SOUTH AFRICA RING MAIN UNIT MARKET, BY INSTALLATION, $M (2017-2030)
- FIG 112 SOUTH AFRICA RING MAIN UNIT MARKET, BY VOLTAGE RATING, $M (2017-2030)
- FIG 113 SOUTH AFRICA RING MAIN UNIT MARKET, BY APPLICATION, $M (2017-2030)
- FIG 114 U.A.E. RING MAIN UNIT MARKET, BY INSULATION TYPE, $M (2017-2030)
- FIG 115 U.A.E. RING MAIN UNIT MARKET, BY INSTALLATION, $M (2017-2030)
- FIG 116 U.A.E. RING MAIN UNIT MARKET, BY VOLTAGE RATING, $M (2017-2030)
- FIG 117 U.A.E. RING MAIN UNIT MARKET, BY APPLICATION, $M (2017-2030)
- FIG 118 ABB LTD. - REVENUE SPLIT BY SEGMENT AND GEOGRAPHY (2022)
- FIG 119 SIEMENS AG - REVENUE SPLIT BY SEGMENT AND GEOGRAPHY (2022)
- FIG 120 EATON CORPORATION PLC - REVENUE SPLIT BY SEGMENT AND GEOGRAPHY (2022)
- FIG 121 SCHNEIDER ELECTRIC SE - REVENUE SPLIT BY SEGMENT AND GEOGRAPHY (2022)
- FIG 122 TOSHIBA CORPORATION - REVENUE SPLIT BY SEGMENT AND GEOGRAPHY (2022)
- FIG 123 LUCY GROUP LTD. - REVENUE SPLIT BY SEGMENT AND GEOGRAPHY (2022)
- FIG 124 C&S ELECTRIC LIMITED - REVENUE SPLIT BY SEGMENT AND GEOGRAPHY (2022)
The global ring main unit market was valued at USD 2,220 million in 2022, and this number is projected to reach USD 3,674 million by 2030, advancing at a CAGR of 6.5% during 2022-2030, according to P&S Intelligence.
This development can be credited to the growing demand for the refurbishment of the present transmission set-up with improved subsystems. Additionally, the increasing concentration on the installation of RMUs, which are quite easy to replace, is another main reason boosting the demand for them.
The growing usage of renewable energy and secondary distribution networks is an additional crucial industry growth driver. Above all, the rising electricity needs surge the sale of transmission devices, like ring main units.
The gas-insulated variants are leading, with a market share of 68%, on the basis of insulation types, mainly because they are compact and chemical-resistant and have better functionality and toughness throughout secondary distribution.
Gas insulation is extensively utilized in wind power plants, railway systems, mining sites, power grids, and underground installations. Furthermore, gas-insulated RMUs are more capable to handle high-temperature and effective load balancing which are the main benefits fuelling the development of the industry.
APAC is dominating the ring main unit market and is projected to be in the leading position till the end of the decade. This can be credited to the increasing need for electricity, volume additions, and constant industrialization developments.
In Asia-Pacific, China is dominating the market and is projected to grow with a CAGR of 6.9%, owing to the increasing acceptance of smart grids, substation industrialization projects, and rural electrification steps by the government. Furthermore, because of the rapid urbanization and automation rates, the need for RMUs is mushrooming.
The up to 15 kV category, held the largest market share, on the basis of voltage rating, credited to the increasing demand for low-voltage distribution networks due to their better fault durable capacity. The snowballing need for up-to-15-kV RMUs in the utility sector for several applications, including transmission and substation, is also projected to fuel the growth of the market.
The industrial category holds a significant market share, due to the increasing electricity needs in this industry. The need to reduce power loss and the requirement for growing energy effectiveness are fuelling the acceptance of smart grids.
Such systems also maintain the circuits, change functions according to the needs, and offer continuous distribution of energy from different bases. The increasing expenditure on novel industrial infrastructure, therefore, drives the market.
Hence, the growing demand for the refurbishment of the present transmission set-up with improved subsystems and the increasing concentration on the installation of RMUs, which are quite easy to replace are the major factors driving the ring main unit industry.
Table of Contents
Chapter 1. Research Scope
- 1.1. Research Objectives
- 1.2. Market Definition
- 1.3. Analysis Period
- 1.4. Market Size Breakdown by Segment
- 1.4.1. Market size breakdown, by insulation type
- 1.4.2. Market size breakdown, by installation
- 1.4.3. Market size breakdown, by voltage rating
- 1.4.4. Market size breakdown, by application
- 1.4.5. Market size breakdown, by region
- 1.4.6. Market size breakdown, by country
- 1.5. Market Data Reporting Unit
- 1.5.1. Value
- 1.6. Key Stakeholders
Chapter 2. Research Methodology
- 2.1. Secondary Research
- 2.1.1. Paid
- 2.1.2. Unpaid
- 2.1.3. P&S Intelligence database
- 2.2. Primary Research
- 2.3. Market Size Estimation
- 2.4. Data Triangulation
- 2.5. Currency Conversion Rates
- 2.6. Assumptions for the Study
- 2.7. Notes and Caveats
Chapter 3. Executive Summary
Chapter 4. Voice of Industry Experts/KOLs
Chapter 5. Market Indicators
Chapter 6. Industry Outlook
- 6.1. Market Dynamics
- 6.1.1. Trends
- 6.1.2. Drivers
- 6.1.3. Restraints/challenges
- 6.1.4. Impact analysis of drivers/restraints
- 6.2. Impact of COVID-19
- 6.3. Porter's Five Forces Analysis
- 6.3.1. Bargaining power of buyers
- 6.3.2. Bargaining power of suppliers
- 6.3.3. Threat of new entrants
- 6.3.4. Intensity of rivalry
- 6.3.5. Threat of substitutes
Chapter 7. Global Market
- 7.1. Overview
- 7.2. Market Revenue, by Insulation Type (2017-2030)
- 7.3. Market Revenue, by Installation (2017-2030)
- 7.4. Market Revenue, by Voltage Rating (2017-2030)
- 7.5. Market Revenue, by Application (2017-2030)
- 7.6. Market Revenue, by Region (2017-2030)
Chapter 8. North America Market
- 8.1. Overview
- 8.2. Market Revenue, by Insulation Type (2017-2030)
- 8.3. Market Revenue, by Installation (2017-2030)
- 8.4. Market Revenue, by Voltage Rating (2017-2030)
- 8.5. Market Revenue, by Application (2017-2030)
- 8.6. Market Revenue, by Country (2017-2030)
Chapter 9. Europe Market
- 9.1. Overview
- 9.2. Market Revenue, by Insulation Type (2017-2030)
- 9.3. Market Revenue, by Installation (2017-2030)
- 9.4. Market Revenue, by Voltage Rating (2017-2030)
- 9.5. Market Revenue, by Application (2017-2030)
- 9.6. Market Revenue, by Country (2017-2030)
Chapter 10. APAC Market
- 10.1. Overview
- 10.2. Market Revenue, by Insulation Type (2017-2030)
- 10.3. Market Revenue, by Installation (2017-2030)
- 10.4. Market Revenue, by Voltage Rating (2017-2030)
- 10.5. Market Revenue, by Application (2017-2030)
- 10.6. Market Revenue, by Country (2017-2030)
Chapter 11. LATAM Market
- 11.1. Overview
- 11.2. Market Revenue, by Insulation Type (2017-2030)
- 11.3. Market Revenue, by Installation (2017-2030)
- 11.4. Market Revenue, by Voltage Rating (2017-2030)
- 11.5. Market Revenue, by Application (2017-2030)
- 11.6. Market Revenue, by Country (2017-2030)
Chapter 12. MEA Market
- 12.1. Overview
- 12.2. Market Revenue, by Insulation Type (2017-2030)
- 12.3. Market Revenue, by Installation (2017-2030)
- 12.4. Market Revenue, by Voltage Rating (2017-2030)
- 12.5. Market Revenue, by Application (2017-2030)
- 12.6. Market Revenue, by Country (2017-2030)
Chapter 13. U.S. Market
- 13.1. Overview
- 13.2. Market Revenue, by Insulation Type (2017-2030)
- 13.3. Market Revenue, by Installation (2017-2030)
- 13.4. Market Revenue, by Voltage Rating (2017-2030)
- 13.5. Market Revenue, by Application (2017-2030)
Chapter 14. Canada Market
- 14.1. Overview
- 14.2. Market Revenue, by Insulation Type (2017-2030)
- 14.3. Market Revenue, by Installation (2017-2030)
- 14.4. Market Revenue, by Voltage Rating (2017-2030)
- 14.5. Market Revenue, by Application (2017-2030)
Chapter 15. Germany Market
- 15.1. Overview
- 15.2. Market Revenue, by Insulation Type (2017-2030)
- 15.3. Market Revenue, by Installation (2017-2030)
- 15.4. Market Revenue, by Voltage Rating (2017-2030)
- 15.5. Market Revenue, by Application (2017-2030)
Chapter 16. France Market
- 16.1. Overview
- 16.2. Market Revenue, by Insulation Type (2017-2030)
- 16.3. Market Revenue, by Installation (2017-2030)
- 16.4. Market Revenue, by Voltage Rating (2017-2030)
- 16.5. Market Revenue, by Application (2017-2030)
Chapter 17. U.K. Market
- 17.1. Overview
- 17.2. Market Revenue, by Insulation Type (2017-2030)
- 17.3. Market Revenue, by Installation (2017-2030)
- 17.4. Market Revenue, by Voltage Rating (2017-2030)
- 17.5. Market Revenue, by Application (2017-2030)
Chapter 18. Italy Market
- 18.1. Overview
- 18.2. Market Revenue, by Insulation Type (2017-2030)
- 18.3. Market Revenue, by Installation (2017-2030)
- 18.4. Market Revenue, by Voltage Rating (2017-2030)
- 18.5. Market Revenue, by Application (2017-2030)
Chapter 19. Spain Market
- 19.1. Overview
- 19.2. Market Revenue, by Insulation Type (2017-2030)
- 19.3. Market Revenue, by Installation (2017-2030)
- 19.4. Market Revenue, by Voltage Rating (2017-2030)
- 19.5. Market Revenue, by Application (2017-2030)
Chapter 20. Japan Market
- 20.1. Overview
- 20.2. Market Revenue, by Insulation Type (2017-2030)
- 20.3. Market Revenue, by Installation (2017-2030)
- 20.4. Market Revenue, by Voltage Rating (2017-2030)
- 20.5. Market Revenue, by Application (2017-2030)
Chapter 21. China Market
- 21.1. Overview
- 21.2. Market Revenue, by Insulation Type (2017-2030)
- 21.3. Market Revenue, by Installation (2017-2030)
- 21.4. Market Revenue, by Voltage Rating (2017-2030)
- 21.5. Market Revenue, by Application (2017-2030)
Chapter 22. India Market
- 22.1. Overview
- 22.2. Market Revenue, by Insulation Type (2017-2030)
- 22.3. Market Revenue, by Installation (2017-2030)
- 22.4. Market Revenue, by Voltage Rating (2017-2030)
- 22.5. Market Revenue, by Application (2017-2030)
Chapter 23. Australia Market
- 23.1. Overview
- 23.2. Market Revenue, by Insulation Type (2017-2030)
- 23.3. Market Revenue, by Installation (2017-2030)
- 23.4. Market Revenue, by Voltage Rating (2017-2030)
- 23.5. Market Revenue, by Application (2017-2030)
Chapter 24. South Korea Market
- 24.1. Overview
- 24.2. Market Revenue, by Insulation Type (2017-2030)
- 24.3. Market Revenue, by Installation (2017-2030)
- 24.4. Market Revenue, by Voltage Rating (2017-2030)
- 24.5. Market Revenue, by Application (2017-2030)
Chapter 25. Brazil Market
- 25.1. Overview
- 25.2. Market Revenue, by Insulation Type (2017-2030)
- 25.3. Market Revenue, by Installation (2017-2030)
- 25.4. Market Revenue, by Voltage Rating (2017-2030)
- 25.5. Market Revenue, by Application (2017-2030)
Chapter 26. Mexico Market
- 26.1. Overview
- 26.2. Market Revenue, by Insulation Type (2017-2030)
- 26.3. Market Revenue, by Installation (2017-2030)
- 26.4. Market Revenue, by Voltage Rating (2017-2030)
- 26.5. Market Revenue, by Application (2017-2030)
Chapter 27. Saudi Arabia Market
- 27.1. Overview
- 27.2. Market Revenue, by Insulation Type (2017-2030)
- 27.3. Market Revenue, by Installation (2017-2030)
- 27.4. Market Revenue, by Voltage Rating (2017-2030)
- 27.5. Market Revenue, by Application (2017-2030)
Chapter 28. South Africa Market
- 28.1. Overview
- 28.2. Market Revenue, by Insulation Type (2017-2030)
- 28.3. Market Revenue, by Installation (2017-2030)
- 28.4. Market Revenue, by Voltage Rating (2017-2030)
- 28.5. Market Revenue, by Application (2017-2030)
Chapter 29. U.A.E. Market
- 29.1. Overview
- 29.2. Market Revenue, by Insulation Type (2017-2030)
- 29.3. Market Revenue, by Installation (2017-2030)
- 29.4. Market Revenue, by Voltage Rating (2017-2030)
- 29.5. Market Revenue, by Application (2017-2030)
Chapter 30. Competitive Landscape
- 30.1. List of Market Players and Their Offerings
- 30.2. Competitive Benchmarking of Key Players
- 30.3. Product Benchmarking of Key Players
- 30.4. Recent Strategic Developments
Chapter 31. Company Profiles
- 31.1. ABB Ltd.
- 31.1.1. Business overview
- 31.1.2. Product and service offerings
- 31.1.3. Key financial summary
- 31.2. Siemens AG
- 31.2.1. Business overview
- 31.2.2. Product and service offerings
- 31.2.3. Key financial summary
- 31.3. Eaton Corporation plc
- 31.3.1. Business overview
- 31.3.2. Product and service offerings
- 31.3.3. Key financial summary
- 31.4. Schneider Electric SE
- 31.4.1. Business overview
- 31.4.2. Product and service offerings
- 31.4.3. Key financial summary
- 31.5. Toshiba Corporation
- 31.5.1. Business overview
- 31.5.2. Product and service offerings
- 31.5.3. Key financial summary
- 31.6. NATUS GmbH & Co. KG
- 31.6.1. Business overview
- 31.6.2. Product and service offerings
- 31.7. China Transpowers Electric Co. Limited
- 31.7.1. Business overview
- 31.7.2. Product and service offerings
- 31.8. BVM Technologies Private Limited
- 31.8.1. Business overview
- 31.8.2. Product and service offerings
- 31.9. Wenzhou Rockwill Electric Co. Ltd.
- 31.9.1. Business overview
- 31.9.2. Product and service offerings
- 31.10. LS ELECTRIC Co. Ltd.
- 31.10.1. Business overview
- 31.10.2. Product and service offerings
- 31.11. Lucy Group Ltd.
- 31.11.1. Business overview
- 31.11.2. Product and service offerings
- 31.11.3. Key financial summary
- 31.12. C&S Electric limited
- 31.12.1. Business overview
- 31.12.2. Product and service offerings
- 31.12.3. Key financial summary
- 31.13. The International Electrical Products Company
- 31.13.1. Business overview
- 31.13.2. Product and service offerings
- 31.14. ENTEC Electric & Electronic Co. Ltd.
- 31.14.1. Business overview
- 31.14.2. Product and service offerings
- 31.15. Orecco electric
- 31.15.1. Business overview
- 31.15.2. Product and service offerings
Chapter 32. Appendix
- 32.1. Abbreviations
- 32.2. Sources and References
- 32.3. Related Reports