|
|
市場調査レポート
商品コード
1222207
燃料電池発電機の世界市場:展望 - タイプ別、エンドユーザー別、産業収益予測・需要予測(~2030年)Fuel Cell Generator Market Outlook by Type, End User - Global Industry Revenue Estimation and Demand Forecast to 2030 |
||||||
|
|
|||||||


| 燃料電池発電機の世界市場:展望 - タイプ別、エンドユーザー別、産業収益予測・需要予測(~2030年) |
|
出版日: 2023年01月01日
発行: Prescient & Strategic Intelligence
ページ情報: 英文 160 Pages
納期: 2~3営業日
|
- 全表示
- 概要
- 図表
- 目次
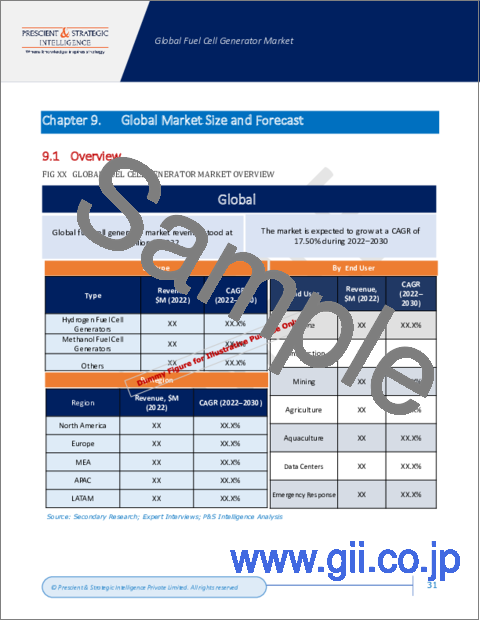
世界の燃料電池発電機の市場規模は、2022年に約3億3,000万米ドルとなり、2030年には11億9,900万米ドルに達し、2022年~2030年にかけてCAGRで17.50%の成長が予測されています。この背景には、CO2排出量の削減ニーズの高まり、燃料電池発電機の入手可能性、再生可能エネルギー発電の需要があります。
当レポートでは、世界の燃料電池発電機市場について調査し、産業の展望、タイプ・エンドユーザー・地域別の市場分析、競合情勢、企業プロファイル等に関する情報を提供しています。
目次
第1章 調査範囲
- 調査目的
- 市場の定義
- 分析期間
- 市場規模内訳:セグメント別
- 市場規模内訳:タイプ別
- 市場規模内訳:エンドユーザー別
- 市場規模内訳:地域別
- 市場データ報告ユニット
- 主な利害関係者
第2章 調査手法
第3章 エグゼクティブサマリー
第4章 産業専門家/KOLの声
第5章 市場指標
第6章 産業の展望
- 市場力学
- 動向
- 促進要因
- 抑制要因/課題
- 促進要因/抑制要因の影響分析
- COVID-19の影響
- ポーターのファイブフォース分析
- 買い手の交渉力
- 供給企業の交渉力
- 新規参入者の脅威
- 競合の激しさ
- 代替品の脅威
第7章 世界市場
- 概要
- 市場数量:タイプ別(2017年~2030年)
- 市場収益:タイプ別(2017年~2030年)
- 市場収益:エンドユーザー別(2017年~2030年)
- 市場数量:地域別(2017年~2030年)
- 市場収益:地域別(2017年~2030年)
第8章 北米市場
- 概要
- 市場数量:タイプ別(2017年~2030年)
- 市場収益:タイプ別(2017年~2030年)
- 市場収益:エンドユーザー別(2017年~2030年)
- 市場数量:国別(2017年~2030年)
- 市場収益:国別(2017年~2030年)
第9章 欧州市場
- 概要
- 市場数量:タイプ別(2017年~2030年)
- 市場収益:タイプ別(2017年~2030年)
- 市場収益:エンドユーザー別(2017年~2030年)
- 市場数量:国別(2017年~2030年)
- 市場収益:国別(2017年~2030年)
第10章 アジア太平洋市場
- 概要
- 市場数量:タイプ別(2017年~2030年)
- 市場収益:タイプ別(2017年~2030年)
- 市場収益:エンドユーザー別(2017年~2030年)
- 市場数量:国別(2017年~2030年)
- 市場収益:国別(2017年~2030年)
第11章 ラテンアメリカ市場
- 概要
- 市場数量:タイプ別(2017年~2030年)
- 市場収益:タイプ別(2017年~2030年)
- 市場収益:エンドユーザー別(2017年~2030年)
- 市場数量:国別(2017年~2030年)
- 市場収益:国別(2017年~2030年)
第12章 中東・アフリカ市場
- 概要
- 市場数量:タイプ別(2017年~2030年)
- 市場収益:タイプ別(2017年~2030年)
- 市場収益:エンドユーザー別(2017年~2030年)
- 市場数量:国別(2017年~2030年)
- 市場収益:国別(2017年~2030年)
第13章 競合情勢
- 市場企業と製品リスト
- 主要企業の競合ベンチマーキング
- 主要企業の製品ベンチマーキング
- 最近の戦略的展開
第14章 企業プロファイル
- Bloom Energy Corporation
- Doosan Fuel Cell Co. Ltd.
- PowerCell Sweden AB
- Proton Motor Power Systems PLC
- Nedstack Fuel Cell Technology BV
- Panasonic Holdings Corporation
- Siemens Energy
- Toyota Motor Corporation
- Ballard Power Systems Inc.
- Teco 2030 ASA
- Cummins Inc.
- ABB Ltd.
- Powerup Energy Technologies
- Plug Power Inc.
- SFC Energy AG
第15章 付録
LIST OF TABLES
- TABLE 1 ANALYSIS PERIOD OF THE STUDY
- TABLE 2 DRIVERS FOR THE MARKET: IMPACT ANALYSIS
- TABLE 3 RESTRAINTS FOR THE MARKET: IMPACT ANALYSIS
- TABLE 4 GLOBAL FUEL CELL GENERATOR MARKET, BY TYPE, UNITS (2017-2022)
- TABLE 5 GLOBAL FUEL CELL GENERATOR MARKET, BY TYPE, UNITS (2023-2026)
- TABLE 6 GLOBAL FUEL CELL GENERATOR MARKET, BY TYPE, UNITS (2027-2030)
- TABLE 7 GLOBAL FUEL CELL GENERATOR MARKET, BY TYPE, $M (2017-2022)
- TABLE 8 GLOBAL FUEL CELL GENERATOR MARKET, BY TYPE, $M (2023-2026)
- TABLE 9 GLOBAL FUEL CELL GENERATOR MARKET, BY TYPE, $M (2027-2030)
- TABLE 10 GLOBAL FUEL CELL GENERATOR MARKET, BY END USER, $M (2017-2022)
- TABLE 11 GLOBAL FUEL CELL GENERATOR MARKET, BY END USER, $M (2023-2026)
- TABLE 12 GLOBAL FUEL CELL GENERATOR MARKET, BY END USER, $M (2027-2030)
- TABLE 13 GLOBAL FUEL CELL GENERATOR MARKET, BY REGION, UNITS (2017-2022)
- TABLE 14 GLOBAL FUEL CELL GENERATOR MARKET, BY REGION, UNITS (2023-2026)
- TABLE 15 GLOBAL FUEL CELL GENERATOR MARKET, BY REGION, UNITS (2027-2030)
- TABLE 16 GLOBAL FUEL CELL GENERATOR MARKET, BY REGION, $M (2017-2022)
- TABLE 17 GLOBAL FUEL CELL GENERATOR MARKET, BY REGION, $M (2023-2026)
- TABLE 18 GLOBAL FUEL CELL GENERATOR MARKET, BY REGION, $M (2027-2030)
- TABLE 19 NORTH AMERICA FUEL CELL GENERATOR MARKET, BY TYPE, UNITS (2017-2022)
- TABLE 20 NORTH AMERICA FUEL CELL GENERATOR MARKET, BY TYPE, UNITS (2023-2026)
- TABLE 21 NORTH AMERICA FUEL CELL GENERATOR MARKET, BY TYPE, UNITS (2027-2030)
- TABLE 22 NORTH AMERICA FUEL CELL GENERATOR MARKET, BY TYPE, $M (2017-2022)
- TABLE 23 NORTH AMERICA FUEL CELL GENERATOR MARKET, BY TYPE, $M (2023-2026)
- TABLE 24 NORTH AMERICA FUEL CELL GENERATOR MARKET, BY TYPE, $M (2027-2030)
- TABLE 25 NORTH AMERICA FUEL CELL GENERATOR MARKET, BY END USER, $M (2017-2022)
- TABLE 26 NORTH AMERICA FUEL CELL GENERATOR MARKET, BY END USER, $M (2023-2026)
- TABLE 27 NORTH AMERICA FUEL CELL GENERATOR MARKET, BY END USER, $M (2027-2030)
- TABLE 28 NORTH AMERICA FUEL CELL GENERATOR MARKET, BY COUNTRY, UNITS (2017-2022)
- TABLE 29 NORTH AMERICA FUEL CELL GENERATOR MARKET, BY COUNTRY, UNITS (2023-2026)
- TABLE 30 NORTH AMERICA FUEL CELL GENERATOR MARKET, BY COUNTRY, UNITS (2027-2030)
- TABLE 31 NORTH AMERICA FUEL CELL GENERATOR MARKET, BY COUNTRY, $M (2017-2022)
- TABLE 32 NORTH AMERICA FUEL CELL GENERATOR MARKET, BY COUNTRY, $M (2023-2026)
- TABLE 33 NORTH AMERICA FUEL CELL GENERATOR MARKET, BY COUNTRY, $M (2027-2030)
- TABLE 34 EUROPE FUEL CELL GENERATOR MARKET, BY TYPE, UNITS (2017-2022)
- TABLE 35 EUROPE FUEL CELL GENERATOR MARKET, BY TYPE, UNITS (2023-2026)
- TABLE 36 EUROPE FUEL CELL GENERATOR MARKET, BY TYPE, UNITS (2027-2030)
- TABLE 37 EUROPE FUEL CELL GENERATOR MARKET, BY TYPE, $M (2017-2022)
- TABLE 38 EUROPE FUEL CELL GENERATOR MARKET, BY TYPE, $M (2023-2026)
- TABLE 39 EUROPE FUEL CELL GENERATOR MARKET, BY TYPE, $M (2027-2030)
- TABLE 40 EUROPE FUEL CELL GENERATOR MARKET, BY END USER, $M (2017-2022)
- TABLE 41 EUROPE FUEL CELL GENERATOR MARKET, BY END USER, $M (2023-2026)
- TABLE 42 EUROPE FUEL CELL GENERATOR MARKET, BY END USER, $M (2027-2030)
- TABLE 43 EUROPE FUEL CELL GENERATOR MARKET, BY COUNTRY, UNITS (2017-2022)
- TABLE 44 EUROPE FUEL CELL GENERATOR MARKET, BY COUNTRY, UNITS (2023-2026)
- TABLE 45 EUROPE FUEL CELL GENERATOR MARKET, BY COUNTRY, UNITS (2027-2030)
- TABLE 46 EUROPE FUEL CELL GENERATOR MARKET, BY COUNTRY, $M (2017-2022)
- TABLE 47 EUROPE FUEL CELL GENERATOR MARKET, BY COUNTRY, $M (2023-2026)
- TABLE 48 EUROPE FUEL CELL GENERATOR MARKET, BY COUNTRY, $M (2027-2030)
- TABLE 49 APAC FUEL CELL GENERATOR MARKET, BY TYPE, UNITS (2017-2022)
- TABLE 50 APAC FUEL CELL GENERATOR MARKET, BY TYPE, UNITS (2023-2026)
- TABLE 51 APAC FUEL CELL GENERATOR MARKET, BY TYPE, UNITS (2027-2030)
- TABLE 52 APAC FUEL CELL GENERATOR MARKET, BY TYPE, $M (2017-2022)
- TABLE 53 APAC FUEL CELL GENERATOR MARKET, BY TYPE, $M (2023-2026)
- TABLE 54 APAC FUEL CELL GENERATOR MARKET, BY TYPE, $M (2027-2030)
- TABLE 55 APAC FUEL CELL GENERATOR MARKET, BY END USER, $M (2017-2022)
- TABLE 56 APAC FUEL CELL GENERATOR MARKET, BY END USER, $M (2023-2026)
- TABLE 57 APAC FUEL CELL GENERATOR MARKET, BY END USER, $M (2027-2030)
- TABLE 58 APAC FUEL CELL GENERATOR MARKET, BY COUNTRY, UNITS (2017-2022)
- TABLE 59 APAC FUEL CELL GENERATOR MARKET, BY COUNTRY, UNITS (2023-2026)
- TABLE 60 APAC FUEL CELL GENERATOR MARKET, BY COUNTRY, UNITS (2027-2030)
- TABLE 61 APAC FUEL CELL GENERATOR MARKET, BY COUNTRY, $M (2017-2022)
- TABLE 62 APAC FUEL CELL GENERATOR MARKET, BY COUNTRY, $M (2023-2026)
- TABLE 63 APAC FUEL CELL GENERATOR MARKET, BY COUNTRY, $M (2027-2030)
- TABLE 64 LATAM FUEL CELL GENERATOR MARKET, BY TYPE, UNITS (2017-2022)
- TABLE 65 LATAM FUEL CELL GENERATOR MARKET, BY TYPE, UNITS (2023-2026)
- TABLE 66 LATAM FUEL CELL GENERATOR MARKET, BY TYPE, UNITS (2027-2030)
- TABLE 67 LATAM FUEL CELL GENERATOR MARKET, BY TYPE, $M (2017-2022)
- TABLE 68 LATAM FUEL CELL GENERATOR MARKET, BY TYPE, $M (2023-2026)
- TABLE 69 LATAM FUEL CELL GENERATOR MARKET, BY TYPE, $M (2027-2030)
- TABLE 70 LATAM FUEL CELL GENERATOR MARKET, BY END USER, $M (2017-2022)
- TABLE 71 LATAM FUEL CELL GENERATOR MARKET, BY END USER, $M (2023-2026)
- TABLE 72 LATAM FUEL CELL GENERATOR MARKET, BY END USER, $M (2027-2030)
- TABLE 73 LATAM FUEL CELL GENERATOR MARKET, BY COUNTRY, UNITS (2017-2022)
- TABLE 74 LATAM FUEL CELL GENERATOR MARKET, BY COUNTRY, UNITS (2023-2026)
- TABLE 75 LATAM FUEL CELL GENERATOR MARKET, BY COUNTRY, UNITS (2027-2030)
- TABLE 76 LATAM FUEL CELL GENERATOR MARKET, BY COUNTRY, $M (2017-2022)
- TABLE 77 LATAM FUEL CELL GENERATOR MARKET, BY COUNTRY, $M (2023-2026)
- TABLE 78 LATAM FUEL CELL GENERATOR MARKET, BY COUNTRY, $M (2027-2030)
- TABLE 79 MEA FUEL CELL GENERATOR MARKET, BY TYPE, UNITS (2017-2022)
- TABLE 80 MEA FUEL CELL GENERATOR MARKET, BY TYPE, UNITS (2023-2026)
- TABLE 81 MEA FUEL CELL GENERATOR MARKET, BY TYPE, UNITS (2027-2030)
- TABLE 82 MEA FUEL CELL GENERATOR MARKET, BY TYPE, $M (2017-2022)
- TABLE 83 MEA FUEL CELL GENERATOR MARKET, BY TYPE, $M (2023-2026)
- TABLE 84 MEA FUEL CELL GENERATOR MARKET, BY TYPE, $M (2027-2030)
- TABLE 85 MEA FUEL CELL GENERATOR MARKET, BY END USER, $M (2017-2022)
- TABLE 86 MEA FUEL CELL GENERATOR MARKET, BY END USER, $M (2023-2026)
- TABLE 87 MEA FUEL CELL GENERATOR MARKET, BY END USER, $M (2027-2030)
- TABLE 88 MEA FUEL CELL GENERATOR MARKET, BY COUNTRY, UNITS (2017-2022)
- TABLE 89 MEA FUEL CELL GENERATOR MARKET, BY COUNTRY, UNITS (2023-2026)
- TABLE 90 MEA FUEL CELL GENERATOR MARKET, BY COUNTRY, UNITS (2027-2030)
- TABLE 91 MEA FUEL CELL GENERATOR MARKET, BY COUNTRY, $M (2017-2022)
- TABLE 92 MEA FUEL CELL GENERATOR MARKET, BY COUNTRY, $M (2023-2026)
- TABLE 93 MEA FUEL CELL GENERATOR MARKET, BY COUNTRY, $M (2027-2030)
- TABLE 94 BLOOM ENERGY CORPORATION - AT A GLANCE
- TABLE 95 BLOOM ENERGY CORPORATION - KEY FINANCIAL SUMMARY
- TABLE 96 DOOSAN FUEL CELL CO. LTD. - AT A GLANCE
- TABLE 97 DOOSAN FUEL CELL CO. LTD. - KEY FINANCIAL SUMMARY
- TABLE 98 POWERCELL SWEDEN AB - AT A GLANCE
- TABLE 99 POWERCELL SWEDEN AB - KEY FINANCIAL SUMMARY
- TABLE 100 PROTON MOTOR POWER SYSTEMS PLC - AT A GLANCE
- TABLE 101 PROTON MOTOR POWER SYSTEMS PLC - KEY FINANCIAL SUMMARY
- TABLE 102 NEDSTACK FUEL CELL TECHNOLOGY BV - AT A GLANCE
- TABLE 103 PANASONIC HOLDINGS CORPORATION - AT A GLANCE
- TABLE 104 PANASONIC HOLDINGS CORPORATION - KEY FINANCIAL SUMMARY
- TABLE 105 SIEMENS ENERGY - AT A GLANCE
- TABLE 106 SIEMENS ENERGY - KEY FINANCIAL SUMMARY
- TABLE 107 TOYOTA MOTOR CORPORATION - AT A GLANCE
- TABLE 108 TOYOTA MOTOR CORPORATION - KEY FINANCIAL SUMMARY
- TABLE 109 BALLARD POWER SYSTEMS INC. - AT A GLANCE
- TABLE 110 BALLARD POWER SYSTEMS INC. - KEY FINANCIAL SUMMARY
- TABLE 111 TECO 2030 ASA - AT A GLANCE
- TABLE 112 TECO 2030 ASA - KEY FINANCIAL SUMMARY
- TABLE 113 CUMMINS INC. - AT A GLANCE
- TABLE 114 CUMMINS INC. - KEY FINANCIAL SUMMARY
- TABLE 115 ABB LTD. - AT A GLANCE
- TABLE 116 ABB LTD. - KEY FINANCIAL SUMMARY
- TABLE 117 POWERUP ENERGY TECHNOLOGIES - AT A GLANCE
- TABLE 118 PLUG POWER INC. - AT A GLANCE
- TABLE 119 PLUG POWER INC. - KEY FINANCIAL SUMMARY
- TABLE 120 SFC ENERGY AG - AT A GLANCE
- TABLE 121 SFC ENERGY AG - KEY FINANCIAL SUMMARY
LIST OF FIGURES
- FIG 1 MARKET SIZE BREAKDOWN BY SEGMENT
- FIG 2 RESEARCH METHODOLOGY
- FIG 3 BREAKDOWN OF PRIMARY RESEARCH, BY REGION
- FIG 4 BREAKDOWN OF PRIMARY RESEARCH, BY DESIGNATION
- FIG 5 BREAKDOWN OF PRIMARY RESEARCH, BY COMPANY TYPE
- FIG 6 DATA TRIANGULATION APPROACH
- FIG 7 CURRENCY CONVERSION RATES FOR USD (2022)
- FIG 8 GLOBAL FUEL CELL GENERATOR MARKET SUMMARY
- FIG 9 BARGAINING POWER OF BUYERS
- FIG 10 BARGAINING POWER OF SUPPLIERS
- FIG 11 INTENSITY OF RIVALRY
- FIG 12 THREAT OF NEW ENTRANTS
- FIG 13 THREAT OF SUBSTITUTES
- FIG 14 GLOBAL FUEL CELL GENERATOR MARKET SNAPSHOT
- FIG 15 GLOBAL FUEL CELL GENERATOR MARKET, BY TYPE, UNITS (2017-2030)
- FIG 16 GLOBAL FUEL CELL GENERATOR MARKET, BY TYPE, $M (2017-2030)
- FIG 17 GLOBAL FUEL CELL GENERATOR MARKET, BY END USER, $M (2017-2030)
- FIG 18 MAJOR WORLDWIDE MARKETS FOR FUEL CELL GENERATORS, UNITS
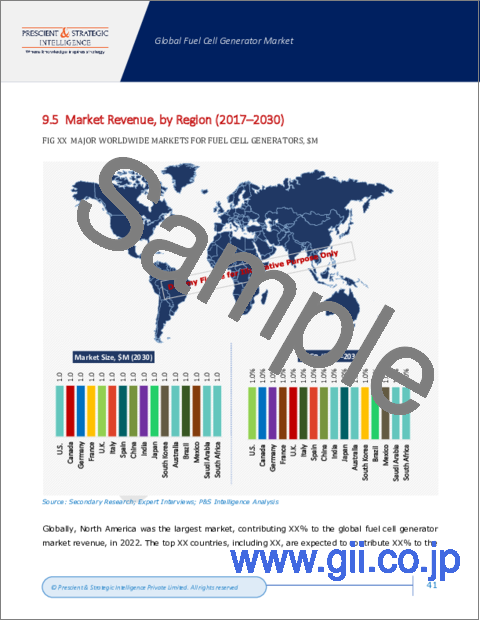
- FIG 19 MAJOR WORLDWIDE MARKETS FOR FUEL CELL GENERATORS, $M
- FIG 20 NORTH AMERICA FUEL CELL GENERATOR MARKET SNAPSHOT
- FIG 21 NORTH AMERICA FUEL CELL GENERATOR MARKET, BY TYPE, UNITS (2017-2030)
- FIG 22 NORTH AMERICA FUEL CELL GENERATOR MARKET, BY TYPE, $M (2017-2030)
- FIG 23 NORTH AMERICA FUEL CELL GENERATOR MARKET, BY END USER, $M (2017-2030)
- FIG 24 NORTH AMERICA FUEL CELL GENERATOR MARKET, BY COUNTRY, UNITS (2017-2030)
- FIG 25 NORTH AMERICA FUEL CELL GENERATOR MARKET, BY COUNTRY, $M (2017-2030)
- FIG 26 EUROPE FUEL CELL GENERATOR MARKET SNAPSHOT
- FIG 27 EUROPE FUEL CELL GENERATOR MARKET, BY TYPE, UNITS (2017-2030)
- FIG 28 EUROPE FUEL CELL GENERATOR MARKET, BY TYPE, $M (2017-2030)
- FIG 29 EUROPE FUEL CELL GENERATOR MARKET, BY END USER, $M (2017-2030)
- FIG 30 EUROPE FUEL CELL GENERATOR MARKET, BY COUNTRY, UNITS (2017-2030)
- FIG 31 EUROPE FUEL CELL GENERATOR MARKET, BY COUNTRY, $M (2017-2030)
- FIG 32 APAC FUEL CELL GENERATOR MARKET SNAPSHOT
- FIG 33 APAC FUEL CELL GENERATOR MARKET, BY TYPE, UNITS (2017-2030)
- FIG 34 APAC FUEL CELL GENERATOR MARKET, BY TYPE, $M (2017-2030)
- FIG 35 APAC FUEL CELL GENERATOR MARKET, BY END USER, $M (2017-2030)
- FIG 36 APAC FUEL CELL GENERATOR MARKET, BY COUNTRY, UNITS (2017-2030)
- FIG 37 APAC FUEL CELL GENERATOR MARKET, BY COUNTRY, $M (2017-2030)
- FIG 38 LATAM FUEL CELL GENERATOR MARKET SNAPSHOT
- FIG 39 LATAM FUEL CELL GENERATOR MARKET, BY TYPE, UNITS (2017-2030)
- FIG 40 LATAM FUEL CELL GENERATOR MARKET, BY TYPE, $M (2017-2030)
- FIG 41 LATAM FUEL CELL GENERATOR MARKET, BY END USER, $M (2017-2030)
- FIG 42 LATAM FUEL CELL GENERATOR MARKET, BY COUNTRY, UNITS (2017-2030)
- FIG 43 LATAM FUEL CELL GENERATOR MARKET, BY COUNTRY, $M (2017-2030)
- FIG 44 MEA FUEL CELL GENERATOR MARKET SNAPSHOT
- FIG 45 MEA FUEL CELL GENERATOR MARKET, BY TYPE, UNITS (2017-2030)
- FIG 46 MEA FUEL CELL GENERATOR MARKET, BY TYPE, $M (2017-2030)
- FIG 47 MEA FUEL CELL GENERATOR MARKET, BY END USER, $M (2017-2030)
- FIG 48 MEA FUEL CELL GENERATOR MARKET, BY COUNTRY, UNITS (2017-2030)
- FIG 49 MEA FUEL CELL GENERATOR MARKET, BY COUNTRY, $M (2017-2030)
- FIG 50 BLOOM ENERGY CORPORATION - REVENUE SPLIT BY SEGMENT AND GEOGRAPHY (2022)
- FIG 51 DOOSAN FUEL CELL CO. LTD. - REVENUE SPLIT BY SEGMENT AND GEOGRAPHY (2022)
- FIG 52 POWERCELL SWEDEN AB - REVENUE SPLIT BY SEGMENT AND GEOGRAPHY (2022)
- FIG 53 PROTON MOTOR POWER SYSTEMS PLC - REVENUE SPLIT BY SEGMENT AND GEOGRAPHY (2022)
- FIG 54 PANASONIC HOLDINGS CORPORATION - REVENUE SPLIT BY SEGMENT AND GEOGRAPHY (2022)
- FIG 55 SIEMENS ENERGY - REVENUE SPLIT BY SEGMENT AND GEOGRAPHY (2022)
- FIG 56 TOYOTA MOTOR CORPORATION - REVENUE SPLIT BY SEGMENT AND GEOGRAPHY (2022)
- FIG 57 BALLARD POWER SYSTEMS INC. - REVENUE SPLIT BY SEGMENT AND GEOGRAPHY (2022)
- FIG 58 TECO 2030 ASA - REVENUE SPLIT BY SEGMENT AND GEOGRAPHY (2022)
- FIG 59 CUMMINS INC. - REVENUE SPLIT BY SEGMENT AND GEOGRAPHY (2022)
- FIG 60 ABB LTD. - REVENUE SPLIT BY SEGMENT AND GEOGRAPHY (2022)
- FIG 61 PLUG POWER INC. - REVENUE SPLIT BY SEGMENT AND GEOGRAPHY (2022)
- FIG 62 SFC ENERGY AG - REVENUE SPLIT BY SEGMENT AND GEOGRAPHY (2022)
In 2022, the fuel cell generator market was worth around USD 330 million, and it is projected to advance at a 17.50% CAGR from 2022 to 2030, hitting USD 1,199 million in 2030, as per P&S Intelligence.
This development can be ascribed to several reasons, including the burgeoning need for the minimalization of CO2 emissions, easy availability of fuel cell generators, and demand for the renewable generation of energy.
Variants that Use Hydrogen Are Highest Revenue Contributors
Hydrogen fuel cell generators have the largest market share, of approximately 55%, mainly because they do not release any damaging gases. This, in turn, removes the prices associated with deploying a dedicated CCUS system. Moreover, these generators are dependable and offer 40-60% output efficiency and scalability.
Numerous nations are targeting to decrease their overall releases of CO2 to zero by 2050. This is because governments' focus has amplified on making a decarbonized future over the past few years. To accomplish this aim, the introduction of renewable sources, including solar, biomass, hydro, wind, and geothermal, is vital.
However, the production of electricity from the sun and wind has a few drawbacks, the biggest of which is the output disparities, as these technologies are reliant on weather conditions.
Fuel Cell Generator Usage in Aquaculture To Grow at Highest Rate
Aquaculture will be the fastest-growing end user, witnessing a CAGR of approximately 19.2%, credited to the increasing aquaculture activities and strong ecological impact ascribed to it due to the high-volume consumption of electricity and water.
Thus, to lessen the environmental effects, governments have taken numerous steps for utilizing fuel-cell-based generators as an alternative to diesel generators.
As per the estimates of the NOAA, the aquaculture sector in the U.S. generates USD 1.5 billion every year and supports 1.7 million people engaged in fisheries.
North America Is Leading the Way in Fuel Cell Generator Usage
North America is dominating the industry, and it is projected to continue with the dominance throughout the decade. This can be ascribed to the acceptance of clean sources for generating heat and electricity.
In North America, the U.S. is leading the market, and it will develop with a CAGR of 18.1%, credited to the solid economic support of the government and the private sector.
The growth in the usage of renewable sources and snowballing electricity needs from the aquaculture and data centers industries are the major factors that will boost the industry in the future.
Table of Contents
Chapter 1. Research Scope
- 1.1. Research Objectives
- 1.2. Market Definition
- 1.3. Analysis Period
- 1.4. Market Size Breakdown by Segment
- 1.4.1. Market size breakdown, by type
- 1.4.2. Market size breakdown, by end user
- 1.4.3. Market size breakdown, by region
- 1.5. Market Data Reporting Unit
- 1.5.1. Volume
- 1.5.2. Value
- 1.6. Key Stakeholders
Chapter 2. Research Methodology
- 2.1. Secondary Research
- 2.1.1. Paid
- 2.1.2. Unpaid
- 2.1.3. P&S Intelligence database
- 2.2. Primary Research
- 2.3. Market Size Estimation
- 2.4. Data Triangulation
- 2.5. Currency Conversion Rates
- 2.6. Assumptions for the Study
- 2.7. Notes and Caveats
Chapter 3. Executive Summary
Chapter 4. Voice of Industry Experts/KOLs
Chapter 5. Market Indicators
Chapter 6. Industry Outlook
- 6.1. Market Dynamics
- 6.1.1. Trends
- 6.1.2. Drivers
- 6.1.3. Restraints/challenges
- 6.1.4. Impact analysis of drivers/restraints
- 6.2. Impact of COVID-19
- 6.3. Porter's Five Forces Analysis
- 6.3.1. Bargaining power of buyers
- 6.3.2. Bargaining power of suppliers
- 6.3.3. Threat of new entrants
- 6.3.4. Intensity of rivalry
- 6.3.5. Threat of substitutes
Chapter 7. Global Market
- 7.1. Overview
- 7.2. Market Volume, by Type (2017-2030)
- 7.3. Market Revenue, by Type (2017-2030)
- 7.4. Market Revenue, by End User (2017-2030)
- 7.5. Market Volume, by Region (2017-2030)
- 7.6. Market Revenue, by Region (2017-2030)
Chapter 8. North America Market
- 8.1. Overview
- 8.2. Market Volume, by Type (2017-2030)
- 8.3. Market Revenue, by Type (2017-2030)
- 8.4. Market Revenue, by End User (2017-2030)
- 8.5. Market Volume, by Country (2017-2030)
- 8.6. Market Revenue, by Country (2017-2030)
Chapter 9. Europe Market
- 9.1. Overview
- 9.2. Market Volume, by Type (2017-2030)
- 9.3. Market Revenue, by Type (2017-2030)
- 9.4. Market Revenue, by End User (2017-2030)
- 9.5. Market Volume, by Country (2017-2030)
- 9.6. Market Revenue, by Country (2017-2030)
Chapter 10. APAC Market
- 10.1. Overview
- 10.2. Market Volume, by Type (2017-2030)
- 10.3. Market Revenue, by Type (2017-2030)
- 10.4. Market Revenue, by End User (2017-2030)
- 10.5. Market Volume, by Country (2017-2030)
- 10.6. Market Revenue, by Country (2017-2030)
Chapter 11. LATAM Market
- 11.1. Overview
- 11.2. Market Volume, by Type (2017-2030)
- 11.3. Market Revenue, by Type (2017-2030)
- 11.4. Market Revenue, by End User (2017-2030)
- 11.5. Market Volume, by Country (2017-2030)
- 11.6. Market Revenue, by Country (2017-2030)
Chapter 12. MEA Market
- 12.1. Overview
- 12.2. Market Volume, by Type (2017-2030)
- 12.3. Market Revenue, by Type (2017-2030)
- 12.4. Market Revenue, by End User (2017-2030)
- 12.5. Market Volume, by Country (2017-2030)
- 12.6. Market Revenue, by Country (2017-2030)
Chapter 13. Competitive Landscape
- 13.1. List of Market Players and Their Offerings
- 13.2. Competitive Benchmarking of Key Players
- 13.3. Product Benchmarking of Key Players
- 13.4. Recent Strategic Developments
Chapter 14. Company Profiles
- 14.1. Bloom Energy Corporation
- 14.1.1. Business overview
- 14.1.2. Product and service offerings
- 14.1.3. Key financial summary
- 14.2. Doosan Fuel Cell Co. Ltd.
- 14.2.1. Business overview
- 14.2.2. Product and service offerings
- 14.2.3. Key financial summary
- 14.3. PowerCell Sweden AB
- 14.3.1. Business overview
- 14.3.2. Product and service offerings
- 14.3.3. Key financial summary
- 14.4. Proton Motor Power Systems PLC
- 14.4.1. Business overview
- 14.4.2. Product and service offerings
- 14.4.3. Key financial summary
- 14.5. Nedstack Fuel Cell Technology BV
- 14.5.1. Business overview
- 14.5.2. Product and service offerings
- 14.6. Panasonic Holdings Corporation
- 14.6.1. Business overview
- 14.6.2. Product and service offerings
- 14.6.3. Key financial summary
- 14.7. Siemens Energy
- 14.7.1. Business overview
- 14.7.2. Product and service offerings
- 14.7.3. Key financial summary
- 14.8. Toyota Motor Corporation
- 14.8.1. Business overview
- 14.8.2. Product and service offerings
- 14.8.3. Key financial summary
- 14.9. Ballard Power Systems Inc.
- 14.9.1. Business overview
- 14.9.2. Product and service offerings
- 14.9.3. Key financial summary
- 14.10. Teco 2030 ASA
- 14.10.1. Business overview
- 14.10.2. Product and service offerings
- 14.10.3. Key financial summary
- 14.11. Cummins Inc.
- 14.11.1. Business overview
- 14.11.2. Product and service offerings
- 14.11.3. Key financial summary
- 14.12. ABB Ltd.
- 14.12.1. Business overview
- 14.12.2. Product and service offerings
- 14.12.3. Key financial summary
- 14.13. Powerup Energy Technologies
- 14.13.1. Business overview
- 14.13.2. Product and service offerings
- 14.14. Plug Power Inc.
- 14.14.1. Business overview
- 14.14.2. Product and service offerings
- 14.14.3. Key financial summary
- 14.15. SFC Energy AG
- 14.15.1. Business overview
- 14.15.2. Product and service offerings
- 14.15.3. Key financial summary
Chapter 15. Appendix
- 15.1. Abbreviations
- 15.2. Sources and References
- 15.3. Related Reports