|
|
市場調査レポート
商品コード
1286636
燃料電池バックアップ電源の世界市場(2023年)Global Fuel Cell Backup Power Market Research Report 2023 |
||||||
|
|
|||||||
カスタマイズ可能
適宜更新あり
|
|||||||


| 燃料電池バックアップ電源の世界市場(2023年) |
|
出版日: 2023年06月05日
発行: QYResearch
ページ情報: 英文 140 Pages
納期: 2~3営業日
|

- 全表示
- 概要
- 図表
- 目次
世界の燃料電池バックアップ電源の市場規模は、2022年の1億5,767万米ドルから2029年までに10億1,140万米ドルに達し、予測期間の2023年~2029年にCAGRで29.48%の成長が予測されています。
当レポートでは、世界の燃料電池バックアップ電源市場について調査分析し、市場規模と予測、地域とセグメントの分析、企業プロファイルなどを提供しています。
目次
第1章 燃料電池バックアップ電源市場の概要
- 製品の定義
- 燃料電池バックアップ電源:タイプ別
- 世界の燃料電池バックアップ電源の市場金額成長率分析:タイプ別(2018年・2022年・2029年)
- 可動式
- 固定式
- 燃料電池バックアップ電源:用途別
- 世界の燃料電池バックアップ電源の市場金額成長率分析:用途別(2018年・2022年・2029年)
- データセンター
- 病院
- 通信
- 公共インフラ
- その他
- 世界市場の成長の見通し
- 世界の燃料電池バックアップ電源の金額の推計と予測(2018年~2029年)
- 世界の燃料電池バックアップ電源の生産の推計と予測(2018年~2029年)
- 世界の燃料電池バックアップ電源市場の平均価格の推計と予測(2018年~2029年)
- 前提条件と制限
第2章 市場競合:メーカー別
- 世界の燃料電池バックアップ電源の生産の市場シェア:メーカー別(2018年~2023年)
- 世界の燃料電池バックアップ電源の生産金額の市場シェア:メーカー別(2018年~2023年)
- 世界の燃料電池バックアップ電源の主要企業、業界ランキング(2021年・2022年)
- 世界の燃料電池バックアップ電源の市場シェア:企業タイプ別(Tier 1、Tier 2、Tier 3)
- 世界の燃料電池バックアップ電源の平均価格:メーカー別(2018年~2023年)
- 世界の燃料電池バックアップ電源の主要メーカー、設立時期、本社
- 世界の燃料電池バックアップ電源市場の競合状況と動向
- 合併と買収、拡大
第3章 燃料電池バックアップ電源の生産:地域別
- 世界の燃料電池バックアップ電源の生産金額の推計と予測:地域別(2018年・2022年・2029年)
- 世界の燃料電池バックアップ電源の生産:地域別(2018年~2029年)
- 世界の燃料電池バックアップ電源の生産の推計と予測:地域別(2018年・2022年・2029年)
- 世界の燃料電池バックアップ電源の生産:地域別(2018年~2029年)
- 世界の燃料電池バックアップ電源の市場価格分析:地域別(2018年~2023年)
- 世界の燃料電池バックアップ電源の生産と金額、前年比成長率
第4章 燃料電池バックアップ電源の消費:地域別
- 世界の燃料電池バックアップ電源の消費の推計と予測:地域別(2018年・2022年・2029年)
- 世界の燃料電池バックアップ電源の消費:地域別(2018年~2029年)
- 世界の燃料電池バックアップ電源の消費:地域別(2018年~2029年)
- 世界の燃料電池バックアップ電源の消費の予測:地域別(2024年~2029年)
- 北米
- 北米の燃料電池バックアップ電源の消費の成長率:国別(2018年・2022年・2029年)
- 北米の燃料電池バックアップ電源の消費:国別(2018年~2029年)
- 米国
- カナダ
- 欧州
- 欧州の燃料電池バックアップ電源の消費の成長率:国別(2018年・2022年・2029年)
- 欧州の燃料電池バックアップ電源の消費:国別(2018年~2029年)
- ドイツ
- フランス
- 英国
- イタリア
- オランダ
- アジア太平洋
- アジア太平洋の燃料電池バックアップ電源の消費の成長率:国別(2018年・2022年・2029年)
- アジア太平洋の燃料電池バックアップ電源の消費:地域別(2018年~2029年)
- 中国
- 日本
- 韓国
- 東南アジア
- インド
- ラテンアメリカ・中東・アフリカ
- ラテンアメリカ・中東・アフリカの燃料電池バックアップ電源の消費の成長率:国別(2018年・2022年・2029年)
- ラテンアメリカ・中東・アフリカの燃料電池バックアップ電源の消費:国別(2018年~2029年)
- ラテンアメリカ
- 中東・アフリカ
第5章 セグメント:タイプ別
- 世界の燃料電池バックアップ電源の生産:タイプ別(2018年~2029年)
- 世界の燃料電池バックアップ電源の生産金額:タイプ別(2018年~2029年)
- 世界の燃料電池バックアップ電源価格:タイプ別(2018年~2029年)
第6章 セグメント:用途別
- 世界の燃料電池バックアップ電源の消費:用途別(2018年~2029年)
- 世界の燃料電池バックアップ電源の消費:用途別、地域別(2018年~2029年)
第7章 企業プロファイル
- Plug Power
- Altergy
- Bloom Energy
- Ballard Power Systems
- Toshiba ESS
- GenCell
- Nedstack
- SinoHytec
- Pearl Hydrogen
- Sinosynergy
- ALSTOM Hydrogene
- Suzhou Foresight Energy
第8章 産業チェーンと販売チャネルの分析
- 燃料電池スタックの産業チェーン分析
- 燃料電池バックアップ電源の主な原材料
- 燃料電池バックアップ電源の生産方式とプロセス
- 燃料電池バックアップ電源の販売とマーケティング
- 燃料電池バックアップ電源の販売チャネル
- 燃料電池バックアップ電源の販売業者
- 燃料電池バックアップ電源の顧客
第9章 燃料電池バックアップ電源の市場力学
- 燃料電池バックアップ電源業界の動向
- 燃料電池バックアップ電源市場の促進要因
- 燃料電池バックアップ電源市場の課題
- 燃料電池バックアップ電源市場の抑制要因
第10章 調査結果と結論
第11章 調査手法とデータソース
List of Tables
- Table 1. Global Fuel Cell Backup Power Market Value by Type, (US$ Million) & (2018 VS 2022 VS 2029)
- Table 2. Global Fuel Cell Backup Power Market Value by Application, (US$ Million) & (2018 VS 2022 VS 2029)
- Table 3. Global Fuel Cell Backup Power Production by Manufacturers (2018-2023) & (MW)
- Table 4. Global Fuel Cell Backup Power Production Market Share by Manufacturers (2018-2023)
- Table 5. Global Fuel Cell Backup Power Production Value by Manufacturers (2018-2023) & (US$ Million)
- Table 6. Global Fuel Cell Backup Power Production Value Share by Manufacturers (2018-2023)
- Table 7. Global Key Players of Fuel Cell Backup Power, Industry Ranking, 2021 VS 2022
- Table 8. Global Company Type (Tier 1, Tier 2, and Tier 3) & (based on the Production Value in Fuel Cell Backup Power as of 2022)
- Table 9. Global Market Fuel Cell Backup Power Average Price by Manufacturers (US$/KW) & (2018-2023)
- Table 10. Global Key Manufacturers of Fuel Cell Backup Power, Founded Time & Headquarters
- Table 11. Global Fuel Cell Backup Power Manufacturers Market Concentration Ratio (CR5)
- Table 12. Mergers & Acquisitions, Expansion Plans
- Table 13. Global Fuel Cell Backup Power Production Value Growth Rate by Region: 2018 VS 2022 VS 2029 (US$ Million)
- Table 14. Global Fuel Cell Backup Power Production Value (US$ Million) by Region (2018-2023)
- Table 15. Global Fuel Cell Backup Power Production Value Market Share by Region (2018-2023)
- Table 16. Global Fuel Cell Backup Power Production Value (US$ Million) Forecast by Region (2024-2029)
- Table 17. Global Fuel Cell Backup Power Production Value Market Share Forecast by Region (2024-2029)
- Table 18. Global Fuel Cell Backup Power Production Comparison by Region: 2018 VS 2022 VS 2029 (MW)
- Table 19. Global Fuel Cell Backup Power Production (MW) by Region (2018-2023)
- Table 20. Global Fuel Cell Backup Power Production Market Share by Region (2018-2023)
- Table 21. Global Fuel Cell Backup Power Production (MW) Forecast by Region (2024-2029)
- Table 22. Global Fuel Cell Backup Power Production Market Share Forecast by Region (2024-2029)
- Table 23. Global Fuel Cell Backup Power Market Average Price (US$/KW) by Region (2018-2023)
- Table 24. Global Fuel Cell Backup Power Market Average Price (US$/KW) by Region (2024-2029)
- Table 25. Global Fuel Cell Backup Power Consumption Growth Rate by Region: 2018 VS 2022 VS 2029 (MW)
- Table 26. Global Fuel Cell Backup Power Consumption by Region (2018-2023) & (MW)
- Table 27. Global Fuel Cell Backup Power Consumption Market Share by Region (2018-2023)
- Table 28. Global Fuel Cell Backup Power Forecasted Consumption by Region (2024-2029) & (MW)
- Table 29. Global Fuel Cell Backup Power Forecasted Consumption Market Share by Region (2018-2023)
- Table 30. North America Fuel Cell Backup Power Consumption Growth Rate by Country: 2018 VS 2022 VS 2029 (MW)
- Table 31. North America Fuel Cell Backup Power Consumption by Country (2018-2023) & (MW)
- Table 32. North America Fuel Cell Backup Power Consumption by Country (2024-2029) & (MW)
- Table 33. Europe Fuel Cell Backup Power Consumption Growth Rate by Country: 2018 VS 2022 VS 2029 (MW)
- Table 34. Europe Fuel Cell Backup Power Consumption by Country (2018-2023) & (MW)
- Table 35. Europe Fuel Cell Backup Power Consumption by Country (2024-2029) & (MW)
- Table 36. Asia-Pacific Fuel Cell Backup Power Consumption Growth Rate by Country: 2018 VS 2022 VS 2029 (MW)
- Table 37. Asia-Pacific Fuel Cell Backup Power Consumption by Region (2018-2023) & (MW)
- Table 38. Asia-Pacific Fuel Cell Backup Power Consumption by Region (2024-2029) & (MW)
- Table 39. Latin America, Middle East & Africa Fuel Cell Backup Power Consumption Growth Rate by Country: 2018 VS 2022 VS 2029 (MW)
- Table 40. Latin America, Middle East & Africa Fuel Cell Backup Power Consumption by Country (2018-2023) & (MW)
- Table 41. Latin America, Middle East & Africa Fuel Cell Backup Power Consumption by Country (2024-2029) & (MW)
- Table 42. Global Fuel Cell Backup Power Production (MW) by Type (2018-2023)
- Table 43. Global Fuel Cell Backup Power Production (MW) by Type (2024-2029)
- Table 44. Global Fuel Cell Backup Power Production Market Share by Type (2018-2023)
- Table 45. Global Fuel Cell Backup Power Production Market Share by Type (2024-2029)
- Table 46. Global Fuel Cell Backup Power Production Value (US$ Million) by Type (2018-2023)
- Table 47. Global Fuel Cell Backup Power Production Value (US$ Million) by Type (2024-2029)
- Table 48. Global Fuel Cell Backup Power Production Value Market Share by Type (2018-2023)
- Table 49. Global Fuel Cell Backup Power Production Value Market Share by Type (2024-2029)
- Table 50. Global Fuel Cell Backup Power Price (US$/KW) by Type (2018-2023)
- Table 51. Global Fuel Cell Backup Power Price (US$/KW) by Type (2024-2029)
- Table 52. Global Fuel Cell Backup Power Production (MW) by Application (2018-2023)
- Table 53. Global Fuel Cell Backup Power Production (MW) by Application (2024-2029)
- Table 54. Global Fuel Cell Backup Power Production Market Share by Application (2018-2023)
- Table 55. Global Fuel Cell Backup Power Production Market Share by Application (2024-2029)
- Table 56. Asia-Pacific Fuel Cell Backup Power Consumption by Application (2018-2023)
- Table 57. Asia-Pacific Fuel Cell Backup Power Consumption by Application (2024-2029)
- Table 58. North America Fuel Cell Backup Power Consumption by Application (2018-2023)
- Table 59. North America Fuel Cell Backup Power Consumption by Application (2024-2029)
- Table 60. Europe Fuel Cell Backup Power Consumption by Application (2018-2023)
- Table 61. Europe Fuel Cell Backup Power Consumption by Application (2024-2029)
- Table 62. Latin America, Middle East & Africa Fuel Cell Backup Power Consumption by Application (2018-2023)
- Table 63. Latin America, Middle East & Africa Fuel Cell Backup Power Consumption by Application (2024-2029)
- Table 1. Plug Power Basic Information
- Table 2. Plug Power Hydrogen and Fuel Cells Product and Services
- Table 3. Plug Power Hydrogen and Fuel Cells Production (MW), Price (USD/KW), Gross Margin and Revenue (USD Million) (2018-2023)
- Table 4. Recent Development
- Table 5. Altergy Basic Information
- Table 6. Altergy Hydrogen and Fuel Cells Product and Services
- Table 7. Altergy Hydrogen and Fuel Cells Production (MW), Price (USD/KW), Gross Margin and Revenue (USD Million) (2018-2023)
- Table 8. Recent Development
- Table 9. Bloom Energy Denso Basic Information
- Table 10. Bloom Energy Hydrogen and Fuel Cells Product and Services
- Table 11. Bloom Energy Hydrogen and Fuel Cells Production (MW), Price (USD/KW), Gross Margin and Revenue (USD Million) (2018-2023)
- Table 12. Recent Development
- Table 13. Ballard Power Systems Basic Information
- Table 14. Ballard Power Systems Hydrogen and Fuel Cells Product and Services
- Table 15. Ballard Power Systems Hydrogen and Fuel Cells Production (MW), Price (USD/KW), Gross Margin and Revenue (USD Million) (2018-2023)
- Table 16. Recent Development
- Table 17. Toshiba ESS Basic Information
- Table 18. Toshiba ESS Hydrogen and Fuel Cells Product and Services
- Table 19. Toshiba ESS Hydrogen and Fuel Cells Production (MW), Price (USD/KW), Gross Margin and Revenue (USD Million) (2018-2023)
- Table 20. Recent Development
- Table 21. GenCell Basic Information
- Table 22. GenCell Hydrogen and Fuel Cells Product and Services
- Table 23. GenCell Hydrogen and Fuel Cells Production (MW), Price (USD/KW), Gross Margin and Revenue (USD Million) (2018-2023)
- Table 24. Recent Development
- Table 25. Nedstack Basic Information
- Table 26. Nedstack Hydrogen and Fuel Cells Product and Services
- Table 27. Nedstack Hydrogen and Fuel Cells Production (MW), Price (USD/KW), Gross Margin and Revenue (USD Million) (2018-2023)
- Table 28. Recent Development
- Table 29. SinoHytec Basic Information
- Table 30. SinoHytec Hydrogen and Fuel Cells Product and Services
- Table 31. SinoHytec Hydrogen and Fuel Cells Production (MW), Price (USD/KW), Gross Margin and Revenue (USD Million) (2018-2023)
- Table 32. Recent Development
- Table 33. Pearl Hydrogen Basic Information
- Table 34. Pearl Hydrogen Hydrogen and Fuel Cells Product and Services
- Table 35. Pearl Hydrogen Hydrogen and Fuel Cells Production (MW), Price (USD/KW), Gross Margin and Revenue (USD Million) (2018-2023)
- Table 36. Recent Development
- Table 37. Sinosynergy Basic Information
- Table 38. Sinosynergy Hydrogen and Fuel Cells Product and Services
- Table 39. Sinosynergy Hydrogen and Fuel Cells Production (MW), Price (USD/KW), Gross Margin and Revenue (USD Million) (2018-2023)
- Table 40. Recent Development
- Table 41. ALSTOM Hydrogene Basic Information
- Table 42. ALSTOM Hydrogene Hydrogen and Fuel Cells Product and Services
- Table 43. ALSTOM Hydrogene Hydrogen and Fuel Cells Production (MW), Price (USD/KW), Gross Margin and Revenue (USD Million) (2018-2023)
- Table 44. Recent Development
- Table 45. Suzhou Foresight Energy Basic Information
- Table 46. Suzhou Foresight Energy Hydrogen and Fuel Cells Product and Services
- Table 47. Suzhou Foresight Energy Hydrogen and Fuel Cells Production (MW), Price (USD/KW), Gross Margin and Revenue (USD Million) (2018-2023)
- Table 48. Raw Materials Key Suppliers Lists
- Table 49. Fuel Cell Backup Power Distributors List
- Table 50. Fuel Cell Backup Power Customers List
- Table 51. Fuel Cell Backup Power Market Trends
- Table 52. Fuel Cell Backup Power Market Drivers
- Table 53. Fuel Cell Backup Power Market Challenges
- Table 54. Fuel Cell Backup Power Market Restraints
- Table 55. Research Programs/Design for This Report
- Table 56. Key Data Information from Secondary Sources
- Table 57. Key Data Information from Primary Sources
- Table 58. Authors List of This Report
- Table 59. QYR Business Unit and Senior & Team Lead Analysts
List of Figures
- Figure 1. Product Picture of Fuel Cell Backup Power
- Figure 2. Global Fuel Cell Backup Power Market Share by Type: 2022 VS 2029
- Figure 3. Mobile Product Picture
- Figure 4. Stationary Product Picture
- Figure 5. Global Fuel Cell Backup Power Market Share by Application: 2022 VS 2029
- Figure 6. Data Centers
- Figure 7. Hospital
- Figure 8. Telecommunication
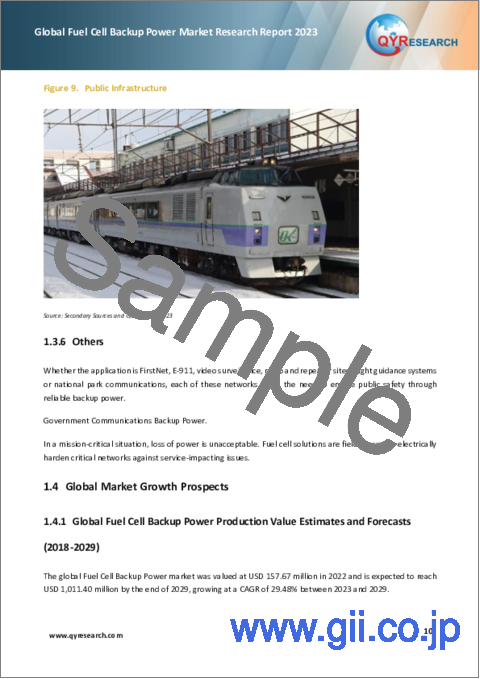
- Figure 9. Public Infrastructure
- Figure 10. Global Fuel Cell Backup Power Production Value (US$ Million), 2018 VS 2023 VS 2029
- Figure 11. Global Fuel Cell Backup Power Production Value (US$ Million) & (2018-2029)
- Figure 12. Global Fuel Cell Backup Power Production (MW) & (2018-2029)
- Figure 13. Global Fuel Cell Backup Power Average Price (US$/KW) & (2018-2029)
- Figure 14. Fuel Cell Backup Power Report Years Considered
- Figure 15. Fuel Cell Backup Power Production Share by Manufacturers in 2022
- Figure 16. Fuel Cell Backup Power Market Share by Company Type (Tier 1, Tier 2, and Tier 3): 2018 VS 2022
- Figure 17. The Global 5 and 10 Largest Players: Market Share by Fuel Cell Backup Power Revenue in 2022
- Figure 18. Global Fuel Cell Backup Power Production Value Market Share by Region: 2022 VS 2029
- Figure 19. Global Fuel Cell Backup Power Production Market Share by Region: 2022 VS 2029
- Figure 20. North America Fuel Cell Backup Power Production Value (US$ Million) Growth Rate (2018-2029)
- Figure 21. Europe Fuel Cell Backup Power Production Value (US$ Million) Growth Rate (2018-2029)
- Figure 22. China Fuel Cell Backup Power Production Value (US$ Million) Growth Rate (2018-2029)
- Figure 23. Japan Fuel Cell Backup Power Production Value (US$ Million) Growth Rate (2018-2029)
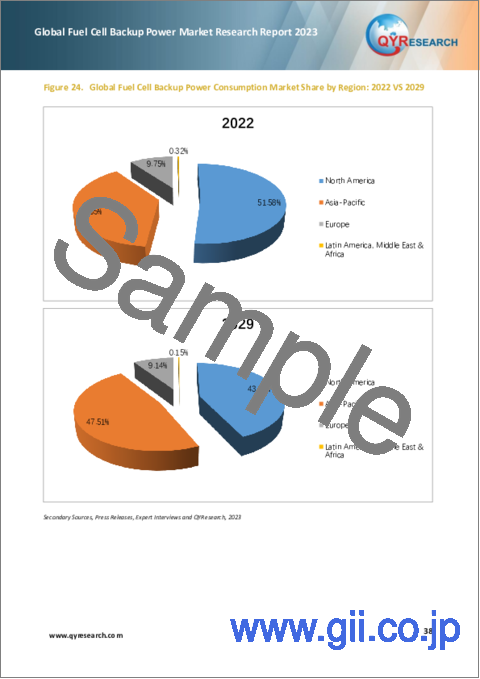
- Figure 24. Global Fuel Cell Backup Power Consumption Market Share by Region: 2022 VS 2029
- Figure 25. North America Fuel Cell Backup Power Consumption and Growth Rate (2018-2029) & (MW)
- Figure 26. North America Fuel Cell Backup Power Consumption Market Share by Country (2018-2029)
- Figure 27. U.S. Fuel Cell Backup Power Consumption and Growth Rate (2018-2029) & (MW)
- Figure 28. Canada Fuel Cell Backup Power Consumption and Growth Rate (2018-2029) & (MW)
- Figure 29. Europe Fuel Cell Backup Power Consumption and Growth Rate (2018-2029) & (MW)
- Figure 30. Europe Fuel Cell Backup Power Consumption Market Share by Country (2018-2029)
- Figure 31. Germany Fuel Cell Backup Power Consumption and Growth Rate (2018-2029) & (MW)
- Figure 32. France Fuel Cell Backup Power Consumption and Growth Rate (2018-2029) & (MW)
- Figure 33. U.K. Fuel Cell Backup Power Consumption and Growth Rate (2018-2029) & (MW)
- Figure 34. Italy Fuel Cell Backup Power Consumption and Growth Rate (2018-2029) & (MW)
- Figure 35. Netherlands Fuel Cell Backup Power Consumption and Growth Rate (2018-2029) & (MW)
- Figure 36. Asia-Pacific Fuel Cell Backup Power Consumption and Growth Rate (2018-2029) & (MW)
- Figure 37. Asia-Pacific Fuel Cell Backup Power Consumption Market Share by Region (2018-2029)
- Figure 38. China Fuel Cell Backup Power Consumption and Growth Rate (2018-2029) & (MW)
- Figure 39. Japan Fuel Cell Backup Power Consumption and Growth Rate (2018-2029) & (MW)
- Figure 40. South Korea Fuel Cell Backup Power Consumption and Growth Rate (2018-2029) & (MW)
- Figure 41. Southeast Asia Fuel Cell Backup Power Consumption and Growth Rate (2018-2029) & (MW)
- Figure 42. India Fuel Cell Backup Power Consumption and Growth Rate (2018-2029) & (MW)
- Figure 43. Latin America, Middle East & Africa Fuel Cell Backup Power Consumption and Growth Rate (2018-2029) & (MW)
- Figure 44. Latin America, Middle East & Africa Fuel Cell Backup Power Consumption Market Share by Country (2018-2029)
- Figure 45. Latin America Fuel Cell Backup Power Consumption and Growth Rate (2018-2029) & (MW)
- Figure 46. Middle East & Africa Fuel Cell Backup Power Consumption and Growth Rate (2018-2029) & (MW)
- Figure 47. Global Production Market Share of Fuel Cell Backup Power by Type (2018-2029)
- Figure 48. Global Production Value Market Share of Fuel Cell Backup Power by Type (2018-2029)
- Figure 49. Global Production Market Share of Fuel Cell Backup Power by Application (2018-2029)
- Figure 50. Fuel Cell Stacks Value Chain
- Figure 51. Fuel Cell Backup Power Production Process
- Figure 52. Marketing Channels of Industrial Furnace
- Figure 53. Distributors Profiles
- Figure 54. Bottom-up and Top-down Approaches for This Report
- Figure 55. Data Triangulation
The global Fuel Cell Backup Power market was valued at US$ 157.67 million in 2022 and is anticipated to reach US$ 1,011.40 million by 2029, witnessing a CAGR of 29.48% during the forecast period 2023-2029. The influence of COVID-19 and the Russia-Ukraine War were considered while estimating market sizes.
North American market for Fuel Cell Backup Power is estimated to increase from $ 100.91 million in 2022 to reach $ 587.12 million by 2029, at a CAGR of 27.31% during the forecast period of 2023 through 2029.
China market for Fuel Cell Backup Power is estimated to increase from $ 13.05 million in 2022 to reach $ 190.1 million by 2029, at a CAGR of 47.16% during the forecast period of 2023 through 2029.
Japan market for Fuel Cell Backup Power is estimated to increase from $ 22.8 million in 2022 to reach $ 120.78 million by 2029, at a CAGR of 25.82% during the forecast period of 2023 through 2029.
The major global manufacturers of Fuel Cell Backup Power include: Plug Power, Altergy, Bloom Energy, Ballard Power System and Toshiba ESS, etc. In 2022, the world's top three vendors accounted for approximately 61.77% of the revenue.
Report Scope
This report aims to provide a comprehensive presentation of the global market for Fuel Cell Backup Power, with both quantitative and qualitative analysis, to help readers develop business/growth strategies, assess the market competitive situation, analyze their position in the current marketplace, and make informed business decisions regarding Fuel Cell Backup Power.
The Fuel Cell Backup Power market size, estimations, and forecasts are provided in terms of output/shipments (MW) and revenue ($ millions), considering 2022 as the base year, with history and forecast data for the period from 2018 to 2029. This report segments the global Fuel Cell Backup Power market comprehensively. Regional market sizes, concerning products by Type, by Application, and by players, are also provided.
For a more in-depth understanding of the market, the report provides profiles of the competitive landscape, key competitors, and their respective market ranks. The report also discusses technological trends and new product developments.
The report will help the Fuel Cell Backup Power manufacturers, new entrants, and industry chain related companies in this market with information on the revenues, production, and average price for the overall market and the sub-segments across the different segments, by company, by Type, by Application, and by regions.
By Company
- Plug Power
- Altergy
- Bloom Energy
- Ballard Power System
- Toshiba ESS
- GenCell
- Nedstack
- SinoHytec
- Pearl Hydrogen
- Sinosynergy
- ALSTOM Hydrogene
- Suzhou Foresight Energy
by Type
- Mobile
- Stationary
by Application
- Data Centers
- Hospital
- Telecommunication
- Public Infrastructure
- Others
Production by Region
- North America
- Europe
- China
- Japan
Consumption by Region
- North America
- U.S.
- Canada
- Asia-Pacific
- China
- Japan
- South Korea
- Southeast Asia
- India
- Europe
- Germany
- France
- U.K.
- Italy
- Netherlands
- Rest of Europe
- Latin America, Middle East & Africa
- Latin America
- Middle East & Africa
Core Chapters
- Chapter 1: Introduces the report scope of the report, executive summary of different market segments (by region, by Type, by Application, etc), including the market size of each market segment, future development potential, and so on. It offers a high-level view of the current state of the market and its likely evolution in the short to mid-term, and long term.
- Chapter 2: Detailed analysis of Fuel Cell Backup Power manufacturers competitive landscape, price, production and value market share, latest development plan, merger, and acquisition information, etc.
- Chapter 3: Production/output, value of Fuel Cell Backup Power by region/country. It provides a quantitative analysis of the market size and development potential of each region in the next six years.
- Chapter 4: Consumption of Fuel Cell Backup Power in regional level and country level. It provides a quantitative analysis of the market size and development potential of each region and its main countries and introduces the market development, future development prospects, market space, and production of each country in the world.
- Chapter 5: Provides the analysis of various market segments by Type, covering the market size and development potential of each market segment, to help readers find the blue ocean market in different market segments.
- Chapter 6: Provides the analysis of various market segments by Application, covering the market size and development potential of each market segment, to help readers find the blue ocean market in different downstream markets.
- Chapter 7: Provides profiles of key players, introducing the basic situation of the main companies in the market in detail, including product production/output, value, price, gross margin, product introduction, recent development, etc.
- Chapter 8: Analysis of industrial chain, including the upstream and downstream of the industry.
- Chapter 9: Introduces the market dynamics, latest developments of the market, the driving factors and restrictive factors of the market, the challenges and risks faced by manufacturers in the industry, and the analysis of relevant policies in the industry.
- Chapter 10: The main points and conclusions of the report.
Table of Contents
1 Fuel Cell Backup Power Market Overview
- 1.1 Product Definition
- 1.2 Fuel Cell Backup Power by Type
- 1.2.1 Global Fuel Cell Backup Power Market Value Growth Rate Analysis by Type: 2018 VS 2022 VS 2029
- 1.2.2 Mobile
- 1.2.3 Stationary
- 1.3 Fuel Cell Backup Power by Application
- 1.3.1 Global Fuel Cell Backup Power Market Value Growth Rate Analysis by Application: 2018 VS 2022 VS 2029
- 1.3.2 Data Centers
- 1.3.3 Hospital
- 1.3.4 Telecommunication
- 1.3.5 Public Infrastructure
- 1.3.6 Others
- 1.4 Global Market Growth Prospects
- 1.4.1 Global Fuel Cell Backup Power Production Value Estimates and Forecasts (2018-2029)
- 1.4.2 Global Fuel Cell Backup Power Production Estimates and Forecasts (2018-2029)
- 1.4.3 Global Fuel Cell Backup Power Market Average Price Estimates and Forecasts (2018-2029)
- 1.5 Assumptions and Limitations
2 Market Competition by Manufacturers
- 2.1 Global Fuel Cell Backup Power Production Market Share by Manufacturers (2018-2023)
- 2.2 Global Fuel Cell Backup Power Production Value Market Share by Manufacturers (2018-2023)
- 2.3 Global Key Players of Fuel Cell Backup Power, Industry Ranking, 2021 VS 2022
- 2.4 Global Fuel Cell Backup Power Market Share by Company Type (Tier 1, Tier 2, and Tier 3)
- 2.5 Global Fuel Cell Backup Power Average Price by Manufacturers (2018-2023)
- 2.6 Global Key Manufacturers of Fuel Cell Backup Power, Founded Time & Headquarters
- 2.7 Global Fuel Cell Backup Power Market Competitive Situation and Trends
- 2.7.1 Global Fuel Cell Backup Power Market Concentration Rate
- 2.7.2 Global 5 and 10 Largest Fuel Cell Backup Power Players Market Share by Revenue
- 2.8 Mergers & Acquisitions, Expansion
3 Fuel Cell Backup Power Production by Region
- 3.1 Global Fuel Cell Backup Power Production Value Estimates and Forecasts by Region: 2018 VS 2022 VS 2029
- 3.2 Global Fuel Cell Backup Power Production Value by Region (2018-2029)
- 3.2.1 Global Fuel Cell Backup Power Production Value Market Share by Region (2018-2023)
- 3.2.2 Global Forecasted Production Value of Fuel Cell Backup Power by Region (2024-2029)
- 3.3 Global Fuel Cell Backup Power Production Estimates and Forecasts by Region: 2018 VS 2022 VS 2029
- 3.4 Global Fuel Cell Backup Power Production by Region (2018-2029)
- 3.4.1 Global Fuel Cell Backup Power Production Market Share by Region (2018-2023)
- 3.4.2 Global Forecasted Production of Fuel Cell Backup Power by Region (2024-2029)
- 3.5 Global Fuel Cell Backup Power Market Price Analysis by Region (2018-2023)
- 3.6 Global Fuel Cell Backup Power Production and Value, Year-over-Year Growth
- 3.6.1 North America Fuel Cell Backup Power Production Value Estimates and Forecasts (2018-2029)
- 3.6.2 Europe Fuel Cell Backup Power Production Value Estimates and Forecasts (2018-2029)
- 3.6.3 China Fuel Cell Backup Power Production Value Estimates and Forecasts (2018-2029)
- 3.6.4 Japan Fuel Cell Backup Power Production Value Estimates and Forecasts (2018-2029)
4 Fuel Cell Backup Power Consumption by Region
- 4.1 Global Fuel Cell Backup Power Consumption Estimates and Forecasts by Region: 2018 VS 2022 VS 2029
- 4.2 Global Fuel Cell Backup Power Consumption by Region (2018-2029)
- 4.2.1 Global Fuel Cell Backup Power Consumption by Region (2018-2029)
- 4.2.2 Global Fuel Cell Backup Power Forecasted Consumption by Region (2024-2029)
- 4.3 North America
- 4.3.1 North America Fuel Cell Backup Power Consumption Growth Rate by Country: 2018 VS 2022 VS 2029
- 4.3.2 North America Fuel Cell Backup Power Consumption by Country (2018-2029)
- 4.3.3 U.S.
- 4.3.4 Canada
- 4.4 Europe
- 4.4.1 Europe Fuel Cell Backup Power Consumption Growth Rate by Country: 2018 VS 2022 VS 2029
- 4.4.2 Europe Fuel Cell Backup Power Consumption by Country (2018-2029)
- 4.4.3 Germany
- 4.4.4 France
- 4.4.5 U.K.
- 4.4.6 Italy
- 4.4.7 Netherlands
- 4.5 Asia-Pacific
- 4.5.1 Asia-Pacific Fuel Cell Backup Power Consumption Growth Rate by Country: 2018 VS 2022 VS 2029
- 4.5.2 Asia-Pacific Fuel Cell Backup Power Consumption by Region (2018-2029)
- 4.5.3 China
- 4.5.4 Japan
- 4.5.5 South Korea
- 4.5.6 Southeast Asia
- 4.5.7 India
- 4.6 Latin America, Middle East & Africa
- 4.6.1 Latin America, Middle East & Africa Fuel Cell Backup Power Consumption Growth Rate by Country: 2018 VS 2022 VS 2029
- 4.6.2 Latin America, Middle East & Africa Fuel Cell Backup Power Consumption by Country (2018-2029)
- 4.6.3 Latin America
- 4.6.4 Middle East & Africa
5 Segment by Type
- 5.1 Global Fuel Cell Backup Power Production by Type (2018-2029)
- 5.1.1 Global Fuel Cell Backup Power Production by Type (2018-2023)
- 5.1.2 Global Fuel Cell Backup Power Production by Type (2024-2029)
- 5.1.3 Global Fuel Cell Backup Power Production Market Share by Type (2018-2029)
- 5.2 Global Fuel Cell Backup Power Production Value by Type (2018-2029)
- 5.2.1 Global Fuel Cell Backup Power Production Value by Type (2018-2023)
- 5.2.2 Global Fuel Cell Backup Power Production Value by Type (2024-2029)
- 5.2.3 Global Fuel Cell Backup Power Production Value Market Share by Type (2018-2029)
- 5.3 Global Fuel Cell Backup Power Price by Type (2018-2029)
6 Segment by Application
- 6.1 Global Fuel Cell Backup Power Consumption by Application (2018-2029)
- 6.1.1 Global Fuel Cell Backup Power Consumption by Application (2018-2023)
- 6.1.2 Global Fuel Cell Backup Power Consumption by Application (2024-2029)
- 6.1.3 Global Fuel Cell Backup Power Production Market Share by Application (2018-2029)
- 6.2 Global Fuel Cell Backup Power Consumption by Application by Regions (2018-2029)
- 6.2.1 Asia-Pacific Fuel Cell Backup Power Consumption by Application (2018-2029)
- 6.2.2 North America Fuel Cell Backup Power Consumption by Application (2018-2029)
- 6.2.3 Europe Fuel Cell Backup Power Consumption by Application (2018-2029)
- 6.2.4 Latin America, Middle East & Africa Fuel Cell Backup Power Consumption by Application (2018-2029)
7 Company Profiles
- 7.1 Plug Power
- 7.1.1 Plug Power Details
- 7.1.2 Plug Power Hydrogen and Fuel Cells Product and Services
- 7.1.3 Plug Power Hydrogen and Fuel Cells Production, Price, Gross Margin and Revenue (2018-2023)
- 7.1.4 Recent Development
- 7.2 Altergy
- 7.2.1 Altergy Details
- 7.2.2 Altergy Hydrogen and Fuel Cells Product and Services
- 7.2.3 Altergy Hydrogen and Fuel Cells Production, Price, Gross Margin and Revenue (2018-2023)
- 7.2.4 Recent Development
- 7.3 Bloom Energy
- 7.3.1 Bloom Energy Details
- 7.3.2 Bloom Energy Hydrogen and Fuel Cells Product and Services
- 7.3.3 Bloom Energy Hydrogen and Fuel Cells Production, Price, Gross Margin and Revenue (2018-2023)
- 7.3.4 Recent Development
- 7.4 Ballard Power Systems
- 7.4.1 Ballard Power Systems Details
- 7.4.2 Ballard Power Systems Hydrogen and Fuel Cells Product and Services
- 7.4.3 Ballard Power Systems Hydrogen and Fuel Cells Production, Price, Gross Margin and Revenue (2018-2023)
- 7.4.4 Recent Development
- 7.5 Toshiba ESS
- 7.5.1 Toshiba ESS Details
- 7.5.2 Toshiba ESS Hydrogen and Fuel Cells Product and Services
- 7.5.3 Toshiba ESS Hydrogen and Fuel Cells Production, Price, Gross Margin and Revenue (2018-2023)
- 7.5.4 Recent Development
- 7.6 GenCell
- 7.6.1 GenCell Details
- 7.6.2 GenCell Hydrogen and Fuel Cells Product and Services
- 7.6.3 GenCell Hydrogen and Fuel Cells Production, Price, Gross Margin and Revenue (2018-2023)
- 7.6.4 Recent Development
- 7.7 Nedstack
- 7.7.1 Nedstack Details
- 7.7.2 Nedstack Hydrogen and Fuel Cells Product and Services
- 7.7.3 Nedstack Hydrogen and Fuel Cells Production, Price, Gross Margin and Revenue (2018-2023)
- 7.7.4 Recent Development
- 7.8 SinoHytec
- 7.8.1 SinoHytec Details
- 7.8.2 SinoHytec Hydrogen and Fuel Cells Product and Services
- 7.8.3 SinoHytec Hydrogen and Fuel Cells Production, Price, Gross Margin and Revenue (2018-2023)
- 7.8.4 Recent Development
- 7.9 Pearl Hydrogen
- 7.9.1 Pearl Hydrogen Details
- 7.9.2 Pearl Hydrogen Hydrogen and Fuel Cells Product and Services
- 7.9.3 Pearl Hydrogen Hydrogen and Fuel Cells Production, Price, Gross Margin and Revenue (2018-2023)
- 7.9.4 Recent Development
- 7.10 Sinosynergy
- 7.10.1 Sinosynergy Details
- 7.10.2 Sinosynergy Hydrogen and Fuel Cells Product and Services
- 7.10.3 Sinosynergy Hydrogen and Fuel Cells Production, Price, Gross Margin and Revenue (2018-2023)
- 7.10.4 Recent Development
- 7.11 ALSTOM Hydrogene
- 7.11.1 ALSTOM Hydrogene Details
- 7.11.2 ALSTOM Hydrogene Hydrogen and Fuel Cells Product and Services
- 7.11.3 ALSTOM Hydrogene Hydrogen and Fuel Cells Production, Price, Gross Margin and Revenue (2018-2023)
- 7.11.4 Recent Development
- 7.12 Suzhou Foresight Energy
- 7.12.1 Suzhou Foresight Energy Details
- 7.12.2 Suzhou Foresight Energy Hydrogen and Fuel Cells Product and Services
- 7.12.3 Suzhou Foresight Energy Hydrogen and Fuel Cells Production, Price, Gross Margin and Revenue (2018-2023)
8 Industry Chain and Sales Channels Analysis
- 8.1 Fuel Cell Stacks Industry Chain Analysis
- 8.2 Fuel Cell Backup Power Key Raw Materials
- 8.3 Fuel Cell Backup Power Production Mode & Process
- 8.4 Fuel Cell Backup Power Sales and Marketing
- 8.4.1 Fuel Cell Backup Power Sales Channels
- 8.4.2 Fuel Cell Backup Power Distributors
- 8.5 Fuel Cell Backup Power Customers
9 Fuel Cell Backup Power Market Dynamics
- 9.1 Fuel Cell Backup Power Industry Trends
- 9.2 Fuel Cell Backup Power Market Drivers
- 9.3 Fuel Cell Backup Power Market Challenges
- 9.4 Fuel Cell Backup Power Market Restraints
10 Research Findings and Conclusion
11 Methodology and Data Source
- 11.1 Methodology/Research Approach
- 11.1.1 Research Programs/Design
- 11.1.2 Market Size Estimation
- 11.1.3 Market Breakdown and Data Triangulation
- 11.2 Data Source
- 11.2.1 Secondary Sources
- 11.2.2 Primary Sources
- 11.3 Author List
- 11.4 Disclaimer