|
|
市場調査レポート
商品コード
1339109
都市データプラットフォーム市場、シェア、規模、動向、産業分析レポート:ストリームタイプ別、展開モード別、エンドユーザー別、地域別、セグメント別予測、2023年~2032年City Data Platform Market Share, Size, Trends, Industry Analysis Report, By Stream Type (Demand-Side Stream, Supply-Side Stream, Analytical Stream, and Standardization Stream); By Deployment Mode; By End-User; By Region; Segment Forecast, 2023 - 2032 |
||||||
|
|
|||||||
カスタマイズ可能
|
|||||||


| 都市データプラットフォーム市場、シェア、規模、動向、産業分析レポート:ストリームタイプ別、展開モード別、エンドユーザー別、地域別、セグメント別予測、2023年~2032年 |
|
出版日: 2023年07月23日
発行: Polaris Market Research
ページ情報: 英文 119 Pages
納期: 即日から翌営業日
|

- 全表示
- 概要
- 図表
- 目次
Polaris Market Researchの最新調査によると、世界の都市データプラットフォーム市場規模は2032年までに3,137億8,000万米ドルに達する見込みです。この調査レポートは、現在の市場力学を詳細に洞察し、将来の市場成長に関する分析を提供しています。
都市データプラットフォーム市場を推進している主な要因の1つは、関連する地方自治体や当局がスマートシティを構築する能力です。インフラの重要な構成要素としてスマート・サービスの実装を目指したさまざまな政策や活動を通じて、政府はスマート・シティ分野で重要な役割を果たしています。
米国政府は、25以上の最新の技術協力と1億6,000万米ドルを超える連邦研究資金を活用して、交通渋滞の緩和、犯罪対策、経済成長の促進、気候変動の影響への対処、都市サービスの強化など、喫緊の課題に取り組む地域社会を支援する新たな「スマートシティ」構想を発表しています。予測期間中、このことも都市データプラットフォーム市場の拡大を促進する上で重要な役割を果たすと予想されます。
これとは別に、スマートシティ向けの最先端緊急対応技術の開発のために、国土安全保障省(DHS)は予測期間中に5,000万米ドルを支出する意向を表明しています。また、エネルギー省(DOE)は、スマートシティ技術を活用したスマートでエネルギー効率が高く、低排出ガスな街づくりへの支援を強化するため、約1,000万米ドルを支出する予定です。その結果、政府はこの地域を低炭素の未来に近づけるため、効果的なモデルや手法を活用したエネルギー配給に注力しており、効率的なスマートシティ管理ソリューションの必要性を促しています。そのため、都市データ・プラットフォーム市場は急速に拡大しています。
さらに、中国、韓国、ドバイ、インド、シンガポール、日本などの新興経済諸国政府は、自国経済のスマートシティ構築のために数多くのプログラムを後援しており、同地域におけるスマートシティ・データプラットフォーム・ソリューションの需要増加が見込まれています。IBEFによると、シンガポールはインドのスマートシティ・イニシアチブを支援することに関心を示しており、アンドラ・プラデシュ州の新首都アムラバティをスマートシティにするための支援を申し出ています。同国はまた、老朽化したインドの都市の再設計、近代化、改修を検討しています。
イタリアはスマートシティ構想に関心を示し、今後20年間で1兆2,000億米ドルを投資すると表明しています。イタリア企業はスマート・シティの設計と技術に貢献し、コンサルティングから実際のインフラ構築まで幅広いサービスを提供します。その結果、政府の取り組みが活発化し、世界中で政府投資が増加していることが、予測期間中の市場の成長を後押ししています。
都市データプラットフォーム市場レポートハイライト
輸送分野は、最高の輸送サービスを提供することから、予測期間中に高い成長が見込まれます。
オンプレミスが最も高い収益シェアを占める。企業データは、オンプレミス・ソリューションによって企業内部で保存/管理されます。
アジア太平洋地域は、都市化により交通量と環境問題が増加しているため、予測期間中に顕著な成長が見込まれます。
目次
第1章 イントロダクション
第2章 エグゼクティブサマリー
第3章 調査手法
第4章 世界の都市データプラットフォーム市場洞察
- 都市データプラットフォーム市場- エンドユーザーのスナップショット
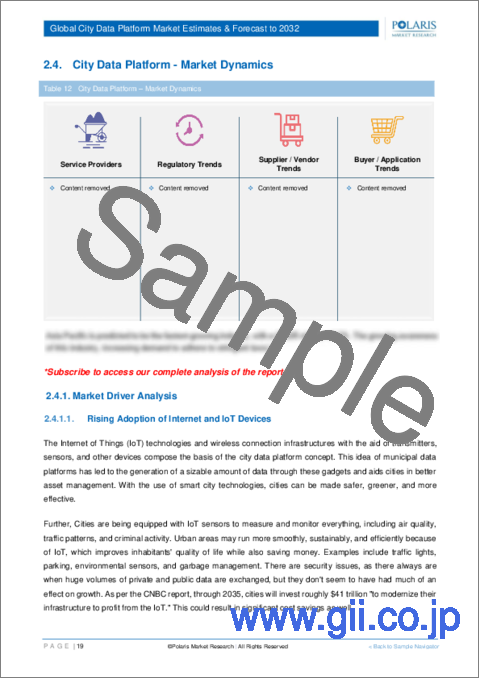
- 都市データプラットフォーム市場力学
- 促進要因と機会
- インターネットとIoTデバイスの普及が進む
- 政府はスマートシティへの注目を高める
- 抑制要因と課題
- データのプライバシーとセキュリティに対する懸念の高まり
- 促進要因と機会
- PESTEL分析
- 都市データプラットフォーム市場のエンドユーザー動向
- バリューチェーン分析
- COVID-19感染症の影響分析
第5章 世界の都市データプラットフォーム市場、ストリームタイプ別
- 主な調査結果
- イントロダクション
- 需要側ストリーム
- 供給側ストリーム
- 分析ストリーム
- 標準化ストリーム
第6章 世界の都市データプラットフォーム市場、展開モード別
- 主な調査結果
- イントロダクション
- オンプレミス
- クラウド
第7章 世界の都市データプラットフォーム市場、エンドユーザー別
- 主な調査結果
- イントロダクション
- 輸送
- 小売
- 自治体
- その他
第8章 世界の都市データプラットフォーム市場、地域別
- 主な調査結果
- イントロダクション
- 都市データプラットフォーム市場評価、地域別、2019~2032年
- 都市データプラットフォーム市場-北米
- 北米:都市データプラットフォーム市場、ストリームタイプ別、2019~2032年
- 北米:都市データプラットフォーム市場、エンドユーザー別、2019~2032年
- 北米:都市データプラットフォーム市場、展開モード別、2019~2032年
- 都市データプラットフォーム市場-米国
- 都市データプラットフォーム市場- カナダ
- 都市データプラットフォーム市場- 欧州
- 欧州:都市データプラットフォーム市場、ストリームタイプ別、2019~2032年
- 欧州:都市データプラットフォーム市場、エンドユーザー別、2019~2032年
- 欧州:都市データプラットフォーム市場、展開モード別、2019~2032年
- 都市データプラットフォーム市場- 英国
- 都市データプラットフォーム市場- フランス
- 都市データプラットフォーム市場- ドイツ
- 都市データプラットフォーム市場- イタリア
- 都市データプラットフォーム市場- スペイン
- 都市データプラットフォーム市場- オランダ
- 都市データプラットフォーム市場- ロシア
- 都市データプラットフォーム市場- アジア太平洋
- アジア太平洋:都市データプラットフォーム市場、ストリームタイプ別、2019~2032年
- アジア太平洋:都市データプラットフォーム市場、エンドユーザー別、2019~2032年
- アジア太平洋:都市データプラットフォーム市場、展開モード別、2019~2032年
- 都市データプラットフォーム市場- 中国
- 都市データプラットフォーム市場- インド
- 都市データプラットフォーム市場- マレーシア
- 都市データプラットフォーム市場- 日本
- 都市データプラットフォーム市場- インドネシア
- 都市データプラットフォーム市場- 韓国
- 都市データプラットフォーム市場-中東およびアフリカ
- 中東およびアフリカ:都市データプラットフォーム市場、ストリームタイプ別、2019~2032年
- 中東およびアフリカ:都市データプラットフォーム市場、エンドユーザー別、2019~2032年
- 中東およびアフリカ:都市データプラットフォーム市場、展開モード別、2019~2032年
- 都市データプラットフォーム市場- サウジアラビア
- 都市データプラットフォーム市場- アラブ首長国連邦
- 都市データプラットフォーム市場- イスラエル
- 都市データプラットフォーム市場- 南アフリカ
- 都市データプラットフォーム市場-ラテンアメリカ
- ラテンアメリカ:都市データプラットフォーム市場、ストリームタイプ別、2019~2032年
- ラテンアメリカ:都市データプラットフォーム市場、エンドユーザー別、2019~2032年
- ラテンアメリカ:都市データプラットフォーム市場、展開モード別、2019~2032年
- 都市データプラットフォーム市場- メキシコ
- 都市データプラットフォーム市場- ブラジル
- 都市データプラットフォーム市場- アルゼンチン
第9章 競合情勢
- 拡大と買収の分析
- 拡大
- 買収
- 提携/協業/合意/公開
第10章 企業プロファイル
- Alibaba Group
- Acility S.A
- Amazon Web Services
- Bosch.IO
- Cisco Systems
- Denali Management
- Ericsson Corporation
- Fujitsu Limited
- Fybr Inc
- Hitachi
- Inspur Technologies
- Lumani
- Nexpa Systems
- Quantela
List of Tables
- Table 1 Global City Data Platform Market, by Stream Type, 2019-2032 (USD Billion)
- Table 2 Global City Data Platform Market, by Deployment Mode, 2019-2032 (USD Billion)
- Table 3 Global City Data Platform Market, by End-User, 2019-2032 (USD Billion)
- Table 4 City Data Platform Market Assessment, By Geography, 2019-2032 (USD Billion)
- Table 5 North America: City Data Platform Market, by Stream Type, 2019-2032 (USD Billion)
- Table 6 North America: City Data Platform Market, by Deployment Mode, 2019-2032 (USD Billion)
- Table 7 North America: City Data Platform Market, by End-User, 2019-2032 (USD Billion)
- Table 8 U.S.: City Data Platform Market, by Stream Type, 2019-2032 (USD Billion)
- Table 9 U.S.: City Data Platform Market, by Deployment Mode, 2019-2032 (USD Billion)
- Table 10 U.S.: City Data Platform Market, by End-User, 2019-2032 (USD Billion)
- Table 11 Canada: City Data Platform Market, by Stream Type, 2019-2032 (USD Billion)
- Table 12 Canada: City Data Platform Market, by Deployment Mode, 2019-2032 (USD Billion)
- Table 13 Canada: City Data Platform Market, by End-User, 2019-2032 (USD Billion)
- Table 14 Europe: City Data Platform Market, by Stream Type, 2019-2032 (USD Billion)
- Table 15 Europe: City Data Platform Market, by Deployment Mode, 2019-2032 (USD Billion)
- Table 16 Europe: City Data Platform Market, by End-User, 2019-2032 (USD Billion)
- Table 17 UK: City Data Platform Market, by Stream Type, 2019-2032 (USD Billion)
- Table 18 UK: City Data Platform Market, by Deployment Mode, 2019-2032 (USD Billion)
- Table 19 UK: City Data Platform Market, by End-User, 2019-2032 (USD Billion)
- Table 20 France: City Data Platform Market, by Stream Type, 2019-2032 (USD Billion)
- Table 21 France: City Data Platform Market, by Deployment Mode, 2019-2032 (USD Billion)
- Table 22 France: City Data Platform Market, by End-User, 2019-2032 (USD Billion)
- Table 23 Germany: City Data Platform Market, by Stream Type, 2019-2032 (USD Billion)
- Table 24 Germany: City Data Platform Market, by Deployment Mode, 2019-2032 (USD Billion)
- Table 25 Germany: City Data Platform Market, by End-User, 2019-2032 (USD Billion)
- Table 26 Italy: City Data Platform Market, by Stream Type, 2019-2032 (USD Billion)
- Table 27 Italy: City Data Platform Market, by Deployment Mode, 2019-2032 (USD Billion)
- Table 28 Italy: City Data Platform Market, by End-User, 2019-2032 (USD Billion)
- Table 29 Spain: City Data Platform Market, by Stream Type, 2019-2032 (USD Billion)
- Table 30 Spain: City Data Platform Market, by Deployment Mode, 2019-2032 (USD Billion)
- Table 31 Spain: City Data Platform Market, by End-User, 2019-2032 (USD Billion)
- Table 32 Netherlands: City Data Platform Market, by Stream Type, 2019-2032 (USD Billion)
- Table 33 Netherlands: City Data Platform Market, by Deployment Mode, 2019-2032 (USD Billion)
- Table 34 Netherlands: City Data Platform Market, by End-User, 2019-2032 (USD Billion)
- Table 35 Russia: City Data Platform Market, by Stream Type, 2019-2032 (USD Billion)
- Table 36 Russia: City Data Platform Market, by Deployment Mode, 2019-2032 (USD Billion)
- Table 37 Russia: City Data Platform Market, by End-User, 2019-2032 (USD Billion)
- Table 38 Asia Pacific: City Data Platform Market, by Stream Type, 2019-2032 (USD Billion)
- Table 39 Asia Pacific: City Data Platform Market, by Deployment Mode, 2019-2032 (USD Billion)
- Table 40 Asia Pacific: City Data Platform Market, by End-User, 2019-2032 (USD Billion)
- Table 41 China: City Data Platform Market, by Stream Type, 2019-2032 (USD Billion)
- Table 42 China: City Data Platform Market, by Deployment Mode, 2019-2032 (USD Billion)
- Table 43 China: City Data Platform Market, by End-User, 2019-2032 (USD Billion)
- Table 44 India: City Data Platform Market, by Stream Type, 2019-2032 (USD Billion)
- Table 45 India: City Data Platform Market, by Deployment Mode, 2019-2032 (USD Billion)
- Table 46 India: City Data Platform Market, by End-User, 2019-2032 (USD Billion)
- Table 47 Malaysia: City Data Platform Market, by Stream Type, 2019-2032 (USD Billion)
- Table 48 Malaysia: City Data Platform Market, by Deployment Mode, 2019-2032 (USD Billion)
- Table 49 Malaysia: City Data Platform Market, by End-User, 2019-2032 (USD Billion)
- Table 50 Japan: City Data Platform Market, by Stream Type, 2019-2032 (USD Billion)
- Table 51 Japan: City Data Platform Market, by Deployment Mode, 2019-2032 (USD Billion)
- Table 52 Japan: City Data Platform Market, by End-User, 2019-2032 (USD Billion)
- Table 53 Indonesia: City Data Platform Market, by Stream Type, 2019-2032 (USD Billion)
- Table 54 Indonesia: City Data Platform Market, by Deployment Mode, 2019-2032 (USD Billion)
- Table 55 Indonesia: City Data Platform Market, by End-User, 2019-2032 (USD Billion)
- Table 56 South Korea: City Data Platform Market, by Stream Type, 2019-2032 (USD Billion)
- Table 57 South Korea: City Data Platform Market, by Deployment Mode, 2019-2032 (USD Billion)
- Table 58 South Korea: City Data Platform Market, by End-User, 2019-2032 (USD Billion)
- Table 59 Middle East & Africa: City Data Platform Market, by Stream Type, 2019-2032 (USD Billion)
- Table 60 Middle East & Africa: City Data Platform Market, by Deployment Mode, 2019-2032 (USD Billion)
- Table 61 Middle East & Africa: City Data Platform Market, by End-User, 2019-2032 (USD Billion)
- Table 62 Saudi Arabia: City Data Platform Market, by Stream Type, 2019-2032 (USD Billion)
- Table 63 Saudi Arabia: City Data Platform Market, by Deployment Mode, 2019-2032 (USD Billion)
- Table 64 Saudi Arabia: City Data Platform Market, by End-User, 2019-2032 (USD Billion)
- Table 65 UAE: City Data Platform Market, by Stream Type, 2019-2032 (USD Billion)
- Table 66 UAE: City Data Platform Market, by Deployment Mode, 2019-2032 (USD Billion)
- Table 67 UAE: City Data Platform Market, by End-User, 2019-2032 (USD Billion)
- Table 68 Israel: City Data Platform Market, by Stream Type, 2019-2032 (USD Billion)
- Table 69 Israel: City Data Platform Market, by Deployment Mode, 2019-2032 (USD Billion)
- Table 70 Israel: City Data Platform Market, by End-User, 2019-2032 (USD Billion)
- Table 71 South Africa: City Data Platform Market, by Stream Type, 2019-2032 (USD Billion)
- Table 72 South Africa: City Data Platform Market, by Deployment Mode, 2019-2032 (USD Billion)
- Table 73 South Africa: City Data Platform Market, by End-User, 2019-2032 (USD Billion)
- Table 74 Latin America: City Data Platform Market, by Stream Type, 2019-2032 (USD Billion)
- Table 75 Latin America: City Data Platform Market, by Deployment Mode, 2019-2032 (USD Billion)
- Table 76 Latin America: City Data Platform Market, by End-User, 2019-2032 (USD Billion)
- Table 77 Mexico: City Data Platform Market, by Stream Type, 2019-2032 (USD Billion)
- Table 78 Mexico: City Data Platform Market, by Deployment Mode, 2019-2032 (USD Billion)
- Table 79 Mexico: City Data Platform Market, by End-User, 2019-2032 (USD Billion)
- Table 80 Brazil: City Data Platform Market, by Stream Type, 2019-2032 (USD Billion)
- Table 81 Brazil: City Data Platform Market, by Deployment Mode, 2019-2032 (USD Billion)
- Table 82 Brazil: City Data Platform Market, by End-User, 2019-2032 (USD Billion)
- Table 83 Argentina: City Data Platform Market, by Stream Type, 2019-2032 (USD Billion)
- Table 84 Argentina: City Data Platform Market, by Deployment Mode, 2019-2032 (USD Billion)
- Table 85 Argentina: City Data Platform Market, by End-User, 2019-2032 (USD Billion)
List of Figures
- Figure 1. Global City Data Platform Market, 2019-2032 (USD Billion)
- Figure 2. Integrated Ecosystem
- Figure 3. Research Methodology: Top-Down & Bottom-Up Approach
- Figure 4. Market by Geography
- Figure 5. Porter's Five Forces
- Figure 6. Market by Deployment Mode
- Figure 7. Global City Data Platform Market, by Deployment Mode, 2022 & 2032 (USD Billion)
- Figure 8. Market by Stream Type
- Figure 9. Global City Data Platform Market, by Stream Type, 2022 & 2032 (USD Billion)
- Figure 10. Market by End-User
- Figure 11. Global City Data Platform Market, by End-User, 2022 & 2032 (USD Billion)
- Figure 12. City Data Platform Market Assessment, By Geography, 2019-2032 (USD Billion)
- Figure 13. Strategic Analysis - City Data Platform Market
The Global city data platform market size is expected to reach USD 313.78 billion by 2032, according to a new study by Polaris Market Research. The report "City Data Platform Market Share, Size, Trends, Industry Analysis Report, By Stream Type (Demand-Side Stream, Supply-Side Stream, Analytical Stream, and Standardization Stream); By Deployment Mode; By End-User; By Region; Segment Forecast, 2023 - 2032" gives a detailed insight into current market dynamics and provides analysis on future market growth.
One of the main factors propelling the market for city data platforms is the ability of relevant local governments and authorities to create smart cities. Through their different policies and activities aimed at the implementation of smart services as a significant component of their infrastructure, governments have been playing a significant role in the smart city sector.
As per the US Government, the Administration is unveiling the new "Smart Cities" Initiative that will use more than 25 latest technological collaborations and over $160 million in federal research funding to assist local communities in addressing pressing issues like reducing traffic congestion, combating crime, promoting economic growth, coping with the effects of climate change, and enhancing the provision of city services. During the forecast period, this is also anticipated to play a significant role in driving the city data platform market's expansion.
Apart from this, for the development of cutting-edge emergency response technology for Smart Cities, the Department of Homeland Security (DHS) has announced intentions to spend $50 million over the forecast period. Also, the Department of Energy (DOE) will spend roughly $10 million to increase its assistance in the creation of smart, energy-efficient, and low-emission towns that use Smart Cities technologies. As a result, the government is concentrating on energy distribution utilizing effective models and methods to move this region closer to a low-carbon future, which in turn is encouraging the need for efficient smart city management solutions. Therefore, the market for city data platforms is rising at a rapid rate.
In addition, governments in developing nations like China, South Korea, Dubai, India, Singapore, and Japan are sponsoring numerous programs to construct smart cities for their economies, which is expected to increase demand for smart city data platform solutions in the area. As per the IBEF, Singapore has expressed interest in supporting India's Smart City Initiative and offered to assist in creating Amravati, the new capital of Andhra Pradesh, as a smart city. The nation is also considering re-engineering, modernizing, and renovating the aging Indian city.
Italy has expressed interest in the idea of smart cities and pledged to invest US$ 1.2 trillion over the next 20 years through several initiatives. The Italian businesses will contribute to the design and technology of the smart cities, providing services ranging from consulting to the actual building of the infrastructure. As a result, rising government initiatives as well as increasing government investment across the globe are boosting the growth of the market over the forecast period.
City Data Platform Market Report Highlights
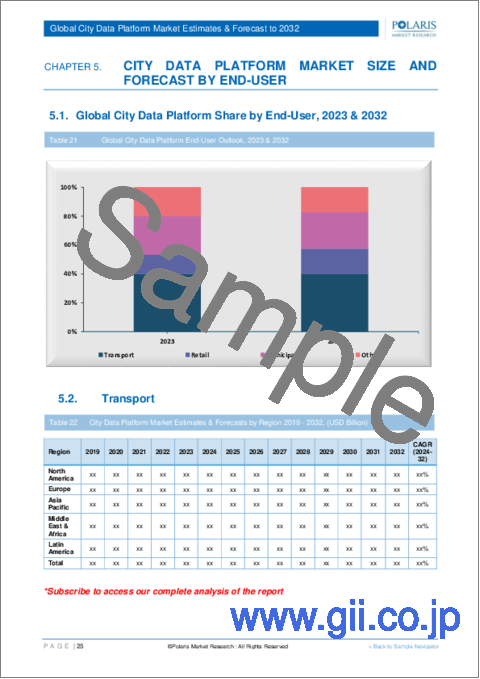
Transport segment is anticipated to grow at high pace over the forecast period owing to the providing the finest transportation service.
On-Premise accounted for highest revenue share. Corporate data is stored/managed internally within the firm via an on-premises solution.
Asia-pacific is expected to grow prominently over the projected period on account of urbanization causing more traffic and environmental issues
The global players include: Alibaba Group, Inspur Technologies, Cisco Systems, and Quantela, Inc.
Polaris Market Research has segmented the City Data Platform market report based on stream type, deployment mode, end-user, and region:
City Data Platform, Stream Type Outlook (Revenue - USD Billion, 2019 - 2032)
- Demand-Side Stream
- Supply-Side Stream
- Analytical Stream
- Standardization Stream
City Data Platform, End-User Outlook (Revenue - USD Billion, 2019 - 2032)
- Transport
- Retail
- Municipality
- Others
City Data Platform, Deployment Mode Outlook (Revenue - USD Billion, 2019 - 2032)
- On-Premise
- Cloud
City Data Platform, Regional Outlook (Revenue - USD Billion, 2019 - 2032)
- North America
- U.S.
- Canada
- Europe
- Germany
- UK
- France
- Italy
- Spain
- Russia
- Netherlands
- Asia Pacific
- China
- India
- Japan
- South Korea
- Indonesia
- Malaysia
- Latin America
- Argentina
- Brazil
- Mexico
- Middle East & Africa
- UAE
- Saudi Arabia
- Israel
- South Africa
Table of Contents
1. Introduction
- 1.1. Report Description
- 1.1.1. Objectives of the Study
- 1.1.2. Market Scope
- 1.1.3. Assumptions
- 1.2. Stakeholders
2. Executive Summary
- 2.1. Market Highlights
3. Research Methodology
- 3.1. Overview
- 3.1.1. Data Mining
- 3.2. Data Sources
- 3.2.1. Primary Sources
- 3.2.2. Secondary Sources
4. Global City Data Platform Market Insights
- 4.1. City Data Platform Market - End-User Snapshot
- 4.2. City Data Platform Market Dynamics
- 4.2.1. Drivers and Opportunities
- 4.2.1.1. Rising Adoption of Internet and IoT Devices
- 4.2.1.2. Governments Increasing Focus on Smart City
- 4.2.2. Restraints and Challenges
- 4.2.2.1. Increasing concern over data privacy and security
- 4.2.1. Drivers and Opportunities
- 4.3. Porter's Five Forces Analysis
- 4.3.1. Bargaining Power of Suppliers (Moderate)
- 4.3.2. Threats of New Entrants: (Low)
- 4.3.3. Bargaining Power of Buyers (Moderate)
- 4.3.4. Threat of Substitute (Moderate)
- 4.3.5. Rivalry among existing firms (High)
- 4.4. PESTEL Analysis
- 4.5. City Data Platform Market End-User Trends
- 4.6. Value Chain Analysis
- 4.7. COVID-19 Impact Analysis
5. Global City Data Platform Market, by Stream Type
- 5.1. Key Findings
- 5.2. Introduction
- 5.2.1. Global City Data Platform Market, by Stream Type, 2019-2032 (USD Billion)
- 5.3. Demand-Side Stream
- 5.3.1. Global City Data Platform Market, by Demand-Side Stream, by Region, 2019-2032 (USD Billion)
- 5.4. Supply-Side Stream
- 5.4.1. Global City Data Platform Market, by Supply-Side Stream, by Region, 2019-2032 (USD Billion)
- 5.5. Analytical Stream
- 5.5.1. Global City Data Platform Market, by Analytical Stream, by Region, 2019-2032 (USD Billion)
- 5.6. Standardization Stream
- 5.6.1. Global City Data Platform Market, by Standardization Stream, by Region, 2019-2032 (USD Billion)
6. Global City Data Platform Market, by Deployment Mode
- 6.1. Key Findings
- 6.2. Introduction
- 6.2.1. Global City Data Platform Market, by Deployment Mode, 2019-2032 (USD Billion)
- 6.3. On-Premise
- 6.3.1. Global City Data Platform Market, by On-Premise, by Region, 2019-2032 (USD Billion)
- 6.4. Cloud
- 6.4.1. Global City Data Platform Market, by Cloud, by Region, 2019-2032 (USD Billion)
7. Global City Data Platform Market, by End-User
- 7.1. Key Findings
- 7.2. Introduction
- 7.2.1. Global City Data Platform Market, by End-User, 2019-2032 (USD Billion)
- 7.3. Transport
- 7.3.1. Global City Data Platform Market, by Transport, By Region, 2019-2032 (USD Billion)
- 7.4. Retail
- 7.4.1. Global City Data Platform Market, by Retail, By Region, 2019-2032 (USD Billion)
- 7.5. Municipality
- 7.5.1. Global City Data Platform Market, by Municipality, By Region, 2019-2032 (USD Billion)
- 7.6. Others
- 7.6.1. Global City Data Platform Market, by Others, By Region, 2019-2032 (USD Billion)
8. Global City Data Platform Market, by Geography
- 8.1. Key findings
- 8.2. Introduction
- 8.2.1. City Data Platform Market Assessment, By Geography, 2019-2032 (USD Billion)
- 8.3. City Data Platform Market - North America
- 8.3.1. North America: City Data Platform Market, by Stream Type, 2019-2032 (USD Billion)
- 8.3.2. North America: City Data Platform Market, by End-User, 2019-2032 (USD Billion)
- 8.3.3. North America: City Data Platform Market, by Deployment Mode, 2019-2032 (USD Billion)
- 8.3.4. City Data Platform Market - U.S.
- 8.3.4.1. U.S.: City Data Platform Market, by Stream Type, 2019-2032 (USD Billion)
- 8.3.4.2. U.S.: City Data Platform Market, by End-User, 2019-2032 (USD Billion)
- 8.3.4.3. U.S.: City Data Platform Market, by Deployment Mode, 2019-2032 (USD Billion)
- 8.3.5. City Data Platform Market - Canada
- 8.3.5.1. Canada: City Data Platform Market, by Stream Type, 2019-2032 (USD Billion)
- 8.3.5.2. Canada.: City Data Platform Market, by End-User, 2019-2032 (USD Billion)
- 8.3.5.3. Canada: City Data Platform Market, by Deployment Mode, 2019-2032 (USD Billion)
- 8.4. City Data Platform Market - Europe
- 8.4.1. Europe: City Data Platform Market, by Stream Type, 2019-2032 (USD Billion)
- 8.4.2. Europe.: City Data Platform Market, by End-User, 2019-2032 (USD Billion)
- 8.4.3. Europe: City Data Platform Market, by Deployment Mode, 2019-2032 (USD Billion)
- 8.4.4. City Data Platform Market - UK
- 8.4.4.1. UK: City Data Platform Market, by Stream Type, 2019-2032 (USD Billion)
- 8.4.4.2. UK.: City Data Platform Market, by End-User, 2019-2032 (USD Billion)
- 8.4.4.3. UK: City Data Platform Market, by Deployment Mode, 2019-2032 (USD Billion)
- 8.4.5. City Data Platform Market - France
- 8.4.5.1. France: City Data Platform Market, by Stream Type, 2019-2032 (USD Billion)
- 8.4.5.2. France.: City Data Platform Market, by End-User, 2019-2032 (USD Billion)
- 8.4.5.3. France: City Data Platform Market, by Deployment Mode, 2019-2032 (USD Billion)
- 8.4.6. City Data Platform Market - Germany
- 8.4.6.1. Germany: City Data Platform Market, by Stream Type, 2019-2032 (USD Billion)
- 8.4.6.2. Germany.: City Data Platform Market, by End-User, 2019-2032 (USD Billion)
- 8.4.6.3. Germany: City Data Platform Market, by Deployment Mode, 2019-2032 (USD Billion)
- 8.4.7. City Data Platform Market - Italy
- 8.4.7.1. Italy: City Data Platform Market, by Stream Type, 2019-2032 (USD Billion)
- 8.4.7.2. Italy.: City Data Platform Market, by End-User, 2019-2032 (USD Billion)
- 8.4.7.3. Italy: City Data Platform Market, by Deployment Mode, 2019-2032 (USD Billion)
- 8.4.8. City Data Platform Market - Spain
- 8.4.8.1. Spain: City Data Platform Market, by Stream Type, 2019-2032 (USD Billion)
- 8.4.8.2. Spain.: City Data Platform Market, by End-User, 2019-2032 (USD Billion)
- 8.4.8.3. Spain: City Data Platform Market, by Deployment Mode, 2019-2032 (USD Billion)
- 8.4.9. City Data Platform Market - Netherlands
- 8.4.9.1. Netherlands: City Data Platform Market, by Stream Type, 2019-2032 (USD Billion)
- 8.4.9.2. Netherlands.: City Data Platform Market, by End-User, 2019-2032 (USD Billion)
- 8.4.9.3. Netherlands: City Data Platform Market, by Deployment Mode, 2019-2032 (USD Billion)
- 8.4.10. City Data Platform Market - Russia
- 8.4.10.1. Russia: City Data Platform Market, by Stream Type, 2019-2032 (USD Billion)
- 8.4.10.2. Russia.: City Data Platform Market, by End-User, 2019-2032 (USD Billion)
- 8.4.10.3. Russia: City Data Platform Market, by Deployment Mode, 2019-2032 (USD Billion)
- 8.5. City Data Platform Market - Asia Pacific
- 8.5.1. Asia Pacific: City Data Platform Market, by Stream Type, 2019-2032 (USD Billion)
- 8.5.2. Asia Pacific.: City Data Platform Market, by End-User, 2019-2032 (USD Billion)
- 8.5.3. Asia Pacific: City Data Platform Market, by Deployment Mode, 2019-2032 (USD Billion)
- 8.5.4. City Data Platform Market - China
- 8.5.4.1. China: City Data Platform Market, by Stream Type, 2019-2032 (USD Billion)
- 8.5.4.2. China.: City Data Platform Market, by End-User, 2019-2032 (USD Billion)
- 8.5.4.3. China: City Data Platform Market, by Deployment Mode, 2019-2032 (USD Billion)
- 8.5.5. City Data Platform Market - India
- 8.5.5.1. India: City Data Platform Market, by Stream Type, 2019-2032 (USD Billion)
- 8.5.5.2. India.: City Data Platform Market, by End-User, 2019-2032 (USD Billion)
- 8.5.5.3. India: City Data Platform Market, by Deployment Mode, 2019-2032 (USD Billion)
- 8.5.6. City Data Platform Market - Malaysia
- 8.5.6.1. Malaysia: City Data Platform Market, by Stream Type, 2019-2032 (USD Billion)
- 8.5.6.2. Malaysia.: City Data Platform Market, by End-User, 2019-2032 (USD Billion)
- 8.5.6.3. Malaysia: City Data Platform Market, by Deployment Mode, 2019-2032 (USD Billion)
- 8.5.7. City Data Platform Market - Japan
- 8.5.7.1. Japan: City Data Platform Market, by Stream Type, 2019-2032 (USD Billion)
- 8.5.7.2. Japan.: City Data Platform Market, by End-User, 2019-2032 (USD Billion)
- 8.5.7.3. Japan: City Data Platform Market, by Deployment Mode, 2019-2032 (USD Billion)
- 8.5.8. City Data Platform Market - Indonesia
- 8.5.8.1. Indonesia: City Data Platform Market, by Stream Type, 2019-2032 (USD Billion)
- 8.5.8.2. Indonesia.: City Data Platform Market, by End-User, 2019-2032 (USD Billion)
- 8.5.8.3. Indonesia: City Data Platform Market, by Deployment Mode, 2019-2032 (USD Billion)
- 8.5.9. City Data Platform Market - South Korea
- 8.5.9.1. South Korea: City Data Platform Market, by Stream Type, 2019-2032 (USD Billion)
- 8.5.9.2. South Korea.: City Data Platform Market, by End-User, 2019-2032 (USD Billion)
- 8.5.9.3. South Korea: City Data Platform Market, by Deployment Mode, 2019-2032 (USD Billion)
- 8.6. City Data Platform Market - Middle East & Africa
- 8.6.1. Middle East & Africa: City Data Platform Market, by Stream Type, 2019-2032 (USD Billion)
- 8.6.2. Middle East & Africa.: City Data Platform Market, by End-User, 2019-2032 (USD Billion)
- 8.6.3. Middle East & Africa: City Data Platform Market, by Deployment Mode, 2019-2032 (USD Billion)
- 8.6.4. City Data Platform Market - Saudi Arabia
- 8.6.4.1. Saudi Arabia: City Data Platform Market, by Stream Type, 2019-2032 (USD Billion)
- 8.6.4.2. Saudi Arabia.: City Data Platform Market, by End-User, 2019-2032 (USD Billion)
- 8.6.4.3. Saudi Arabia: City Data Platform Market, by Deployment Mode, 2019-2032 (USD Billion)
- 8.6.5. City Data Platform Market - UAE
- 8.6.5.1. UAE: City Data Platform Market, by Stream Type, 2019-2032 (USD Billion)
- 8.6.5.2. UAE.: City Data Platform Market, by End-User, 2019-2032 (USD Billion)
- 8.6.5.3. UAE: City Data Platform Market, by Deployment Mode, 2019-2032 (USD Billion)
- 8.6.6. City Data Platform Market - Israel
- 8.6.6.1. Israel: City Data Platform Market, by Stream Type, 2019-2032 (USD Billion)
- 8.6.6.2. Israel.: City Data Platform Market, by End-User, 2019-2032 (USD Billion)
- 8.6.6.3. Israel: City Data Platform Market, by Deployment Mode, 2019-2032 (USD Billion)
- 8.6.7. City Data Platform Market - South Africa
- 8.6.7.1. South Africa: City Data Platform Market, by Stream Type, 2019-2032 (USD Billion)
- 8.6.7.2. South Africa.: City Data Platform Market, by End-User, 2019-2032 (USD Billion)
- 8.6.7.3. South Africa: City Data Platform Market, by Deployment Mode, 2019-2032 (USD Billion)
- 8.7. City Data Platform Market - Latin America
- 8.7.1. Latin America: City Data Platform Market, by Stream Type, 2019-2032 (USD Billion)
- 8.7.2. Latin America.: City Data Platform Market, by End-User, 2019-2032 (USD Billion)
- 8.7.3. Latin America: City Data Platform Market, by Deployment Mode, 2019-2032 (USD Billion)
- 8.7.4. City Data Platform Market - Mexico
- 8.7.4.1. Mexico: City Data Platform Market, by Stream Type, 2019-2032 (USD Billion)
- 8.7.4.2. Mexico.: City Data Platform Market, by End-User, 2019-2032 (USD Billion)
- 8.7.4.3. Mexico: City Data Platform Market, by Deployment Mode, 2019-2032 (USD Billion)
- 8.7.5. City Data Platform Market - Brazil
- 8.7.5.1. Brazil: City Data Platform Market, by Stream Type, 2019-2032 (USD Billion)
- 8.7.5.2. Brazil.: City Data Platform Market, by End-User, 2019-2032 (USD Billion)
- 8.7.5.3. Brazil: City Data Platform Market, by Deployment Mode, 2019-2032 (USD Billion)
- 8.7.6. City Data Platform Market - Argentina
- 8.7.6.1. Argentina: City Data Platform Market, by Stream Type, 2019-2032 (USD Billion)
- 8.7.6.2. Argentina.: City Data Platform Market, by End-User, 2019-2032 (USD Billion)
- 8.7.6.3. Argentina: City Data Platform Market, by Deployment Mode, 2019-2032 (USD Billion)
9. Competitive Landscape
- 9.1. Expansion and Acquisition Analysis
- 9.1.1. Expansion
- 9.1.2. Acquisitions
- 9.2. Partnerships/Collaborations/Agreements/Exhibitions
10. Company Profiles
- 10.1. Alibaba Group
- 10.1.1. Company Overview
- 10.1.2. Financial Performance
- 10.1.3. Product Benchmarking
- 10.1.4. Recent Development
- 10.2. Acility S.A
- 10.2.1. Company Overview
- 10.2.2. Financial Performance
- 10.2.3. Product Benchmarking
- 10.2.4. Recent Development
- 10.3. Amazon Web Services
- 10.3.1. Company Overview
- 10.3.2. Financial Performance
- 10.3.3. Product Benchmarking
- 10.3.4. Recent Development
- 10.4. Bosch.IO
- 10.4.1. Company Overview
- 10.4.2. Financial Performance
- 10.4.3. Product Benchmarking
- 10.4.4. Recent Development
- 10.5. Cisco Systems
- 10.5.1. Company Overview
- 10.5.2. Financial Performance
- 10.5.3. Product Benchmarking
- 10.5.4. Recent Development
- 10.6. Denali Management
- 10.6.1. Company Overview
- 10.6.2. Financial Performance
- 10.6.3. Product Benchmarking
- 10.6.4. Recent Development
- 10.7. Ericsson Corporation
- 10.7.1. Company Overview
- 10.7.2. Financial Performance
- 10.7.3. Product Benchmarking
- 10.7.4. Recent Development
- 10.8. Fujitsu Limited
- 10.8.1. Company Overview
- 10.8.2. Financial Performance
- 10.8.3. Product Benchmarking
- 10.8.4. Recent Development
- 10.9. Fybr Inc
- 10.9.1. Company Overview
- 10.9.2. Financial Performance
- 10.9.3. Product Benchmarking
- 10.9.4. Recent Development
- 10.10. Google
- 10.10.1. Company Overview
- 10.10.2. Financial Performance
- 10.10.3. Product Benchmarking
- 10.10.4. Recent Development
- 10.11. Hitachi
- 10.11.1. Company Overview
- 10.11.2. Financial Performance
- 10.11.3. Product Benchmarking
- 10.11.4. Recent Development
- 10.12. Inspur Technologies
- 10.12.1. Company Overview
- 10.12.2. Financial Performance
- 10.12.3. Product Benchmarking
- 10.12.4. Recent Development
- 10.13. Lumani
- 10.13.1. Company Overview
- 10.13.2. Financial Performance
- 10.13.3. Product Benchmarking
- 10.13.4. Recent Development
- 10.14. Nexpa Systems
- 10.14.1. Company Overview
- 10.14.2. Financial Performance
- 10.14.3. Product Benchmarking
- 10.14.4. Recent Development
- 10.15. Quantela
- 10.15.1. Company Overview
- 10.15.2. Financial Performance
- 10.15.3. Product Benchmarking
- 10.15.4. Recent Development