|
|
市場調査レポート
商品コード
1508671
デジタルフォトフレーム市場:世界の産業分析、規模、シェア、成長、動向、2024年~2033年予測Digital Photo Frame Market: Global Industry Analysis, Size, Share, Growth, Trends, and Forecast, 2024-2033 |
||||||
|
|
|||||||
カスタマイズ可能
|
|||||||


| デジタルフォトフレーム市場:世界の産業分析、規模、シェア、成長、動向、2024年~2033年予測 |
|
出版日: 2024年07月02日
発行: Persistence Market Research
ページ情報: 英文 300 Pages
納期: 2~5営業日
|

- 全表示
- 概要
- 目次
Persistence Market Research社はこのほど、デジタルフォトフレームの世界市場に関する包括的なレポートを発表しました。当レポートでは、市場促進要因・動向・機会・課題など、重要な市場ダイナミクスを徹底的に評価し、市場構造に関する詳細な洞察を提供しています。
主な洞察
- デジタルフォトフレームの市場規模(2024E):6,150万米ドル
- 予測市場価値(2033F):7,620万米ドル
- 世界市場成長率(CAGR 2024年~2033年):2.4%
デジタルフォトフレーム市場- 調査範囲:
デジタルフォトフレームは、コンピュータやプリンタを必要とせずにデジタル画像を表示するように設計された電子機器です。LCDスクリーン、内蔵ストレージを備え、多くの場合Wi-Fi接続機能を備えているため、ユーザーはスマートフォンやその他のデバイスから直接画像をアップロードして見ることができます。デジタルフォトフレーム市場は、個人消費者向けと、小売店、オフィス、接客施設などの商業施設の両方に対応しています。市場成長の原動力は、デジタル写真の人気の高まり、ディスプレイ技術の進歩、スマートホームデバイスのトレンドの高まりです。
市場促進要因:
世界のデジタルフォトフレーム市場は、デジタル写真の普及の高まりや、パーソナライズされたホームデコレーションソリューションに対する需要の高まりなど、いくつかの重要な要因によって推進されています。スマートフォンやデジタルカメラの普及により、デジタル写真コレクションが急増し、これらの画像を表示する便利でスタイリッシュな方法に対する需要が生まれています。高解像度ディスプレイやスマート接続機能などの技術的進歩は、ユーザー体験を向上させ、市場拡大を後押ししています。さらに、スマートホームの動向の高まりや、デジタルフォトフレームと他のスマートデバイスとの統合も市場拡大に寄与しています。
市場抑制要因:
有望な成長が見込まれるもの、デジタルフォトフレーム市場は、タブレット端末やスマートテレビなど、他のデジタルディスプレイ機器との競合に関する課題に直面しています。また、デジタルフォトフレーム、特に高度な機能を備えたデジタルフォトフレームは比較的高価であるため、価格に敏感な地域における市場浸透の妨げになる可能性があります。さらに、特にWi-Fi対応のフレームでは、データのセキュリティやプライバシーに対する懸念が、消費者の信頼や普及率に影響を与える可能性があります。これらの課題に対処するには、継続的な技術革新と、手頃な価格で安全かつユーザーフレンドリーな製品の開発が必要です。
市場機会:
デジタルフォトフレーム市場は、ディスプレイ技術の進歩、可処分所得の増加、消費者の嗜好の進化によって大きな成長機会がもたらされます。デジタルフォトフレームに人工知能(AI)と機械学習(ML)を統合することで、画像認識とソート機能を強化し、よりパーソナライズされたインタラクティブな体験をユーザーに提供することができます。さらに、広告や情報ディスプレイなど、商業的な場面でのデジタルフォトフレームの応用が拡大していることも、市場の幅を広げています。戦略的パートナーシップ、研究開発への投資、革新的で費用対効果の高い製品のイントロダクションは、新たな機会を活用し、市場のリーダーシップを維持するために不可欠です。
本レポートで扱う主な質問
- 世界のデジタルフォトフレーム市場の成長を促進する主な要因は何か?
- デジタルフォトフレームのどのような種類と用途が、さまざまな消費者環境および商業環境での採用を促進しているか?
- 技術の進歩はデジタルフォトフレーム市場の競合情勢をどのように変えているのか?
- デジタルフォトフレーム市場に貢献している主要プレーヤーは誰か、市場の関連性を維持するためにどのような戦略を採用しているか?
- 世界のデジタルフォトフレーム市場の新たな動向と将来性は?
目次
第1章 エグゼクティブサマリー
第2章 市場概要
- 市場範囲/分類
- 市場の定義/範囲/制限
第3章 主要な市場動向
- 市場に影響を与える主な動向
- バーチャルリアリティの影響力は拡大する
- スマート電子機器への大きな需要
- スマートテクノロジーの導入拡大
- その他(学習期間中)
- 製品イノベーションの動向
- デジタルフォトフレーム業界の将来展望
- 成長促進要因
- ブランドの流入
- 革新的な流通とマーケティング戦略
第4章 世界のデジタルフォトフレーム市場の需要分析
- 過去の市場規模(千ユニット)分析、2019年~2023年
- 現在および将来の市場規模(千ユニット)予測、2024年~2033年
- 前年比成長動向分析
第5章 世界のデジタルフォトフレーム市場- 価格分析
- 画面サイズ別の価格分析
- 世界平均価格分析ベンチマーク
第6章 世界のデジタルフォトフレーム市場の需要(金額またはパッケージ形式、百万米ドル)分析
- 過去の市場金額(百万米ドル)分析、2019年~2023年
- 現在および将来の市場金額(百万米ドル)予測、2024~2033年
- 前年比成長動向分析
- 絶対的なドル機会分析
第7章 市場背景
- マクロ経済要因
- 予測要因- 関連性と影響
- 世界のデジタルフォトフレーム市場のPESTLE分析
- デジタルフォトフレーム市場の投資実現可能性マトリックス
- ポーターの5つの力による世界のデジタルフォトフレーム市場の分析
- 市場力学
第8章 世界のデジタルフォトフレーム市場分析:画面サイズ別
- イントロダクション/主な調査結果
- 画面サイズ別の市場規模(百万米ドル)の過去分析、2019年~2023年
- 画面サイズ別の現在および将来の市場規模(百万米ドル)の分析と予測、2024年~2033年
- 7~9.9インチ
- 10~12.9インチ
- 13インチ以上
- 画面サイズ別市場の魅力分析
第9章 世界のデジタルフォトフレーム市場分析:アスペクト比別
- イントロダクション/主な調査結果
- アスペクト比別の過去市場規模(百万米ドル)と数量分析、2019年~2023年
- アスペクト比別の現在および将来の市場規模(百万米ドル)と数量分析と予測、2024年~2033年
- 標準(4:3)
- ワイドスクリーン(16:9)
- アスペクト比別市場の魅力分析
第10章 世界のデジタルフォトフレーム市場分析:電源別
- イントロダクション/主な調査結果
- 電源別の過去市場規模(百万米ドル)と数量分析、2019年~2023年
- 電源別の現在および将来の市場規模(百万米ドル)と数量分析と予測、2024年~2033年
- 電気
- 電池式
- 電源別市場の魅力分析
第11章 世界のデジタルフォトフレーム市場分析:アプリケーション別
- イントロダクション/主な調査結果
- アプリケーション別の過去市場規模(百万米ドル)と数量分析、2019年~2023年
- アプリケーション別の現在および将来の市場規模(百万米ドル)と数量分析と予測、2024年~2033年
- 住宅
- 商業
- アプリケーション別市場の魅力分析
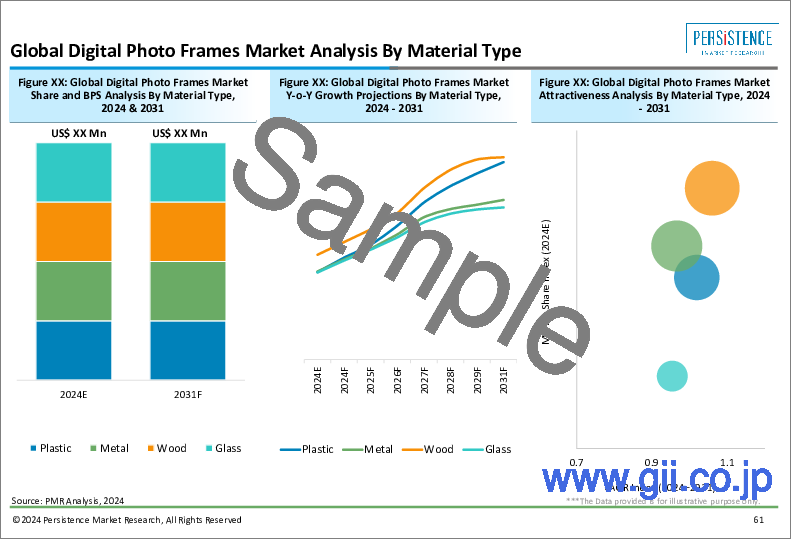
第12章 世界のデジタルフォトフレーム市場分析:素材タイプ
- イントロダクション/主な調査結果
- 素材タイプ別の過去市場規模(百万米ドル)と数量分析、2019年~2023年
- 素材タイプ別の現在および将来の市場規模(百万米ドル)と数量分析と予測、2024年~2033年
- プラスチック
- 金属
- 木材
- ガラス
- 素材タイプ別市場の魅力分析
第13章 世界のデジタルフォトフレーム市場分析:販売チャネル別
- イントロダクション/主な調査結果
- 販売チャネル別の過去市場規模(百万米ドル)と数量分析、2019年~2023年
- 販売チャネル別の現在および将来の市場規模(百万米ドル)と数量分析と予測、2024年~2033年
- 卸売業者/販売業者
- ハイパーマーケット/スーパーマーケット
- 専門店
- マルチブランドストア
- 独立系小規模店舗
- オンライン小売業者
- 販売チャネル別市場の魅力分析
第14章 デジタルフォトフレーム市場分析:地域別
- イントロダクション
- 地域別の市場規模(百万米ドル)と数量(千台)の過去分析、2019年~2023年
- 地域別の現在の市場規模(百万米ドル)と数量(千台)の分析と予測、2024年~2033年
- 北米
- ラテンアメリカ
- 欧州
- 東アジア
- 南アジア
- オセアニア
- 中東およびアフリカ
- 地域別市場の魅力分析
第15章 北米のデジタルフォトフレーム市場分析
第16章 ラテンアメリカのデジタルフォトフレーム市場分析
第17章 欧州のデジタルフォトフレーム市場分析
第18章 南アジアのデジタルフォトフレーム市場分析
第19章 東アジアのデジタルフォトフレーム市場分析
第20章 オセアニアのデジタルフォトフレーム市場分析
第21章 中東およびアフリカのデジタルフォトフレーム市場分析
第22章 主要国のデジタルフォトフレーム市場分析、2024年~2033年
- イントロダクション
- 主要国別の市場金額割合分析
- 世界と国別の成長比較
- 米国のデジタルフォトフレーム市場分析
- 画面サイズ別
- アスペクト比別
- 電源別
- アプリケーション別
- 素材タイプ別
- 販売チャネル別
- カナダのデジタルフォトフレーム市場分析
- 画面サイズ別
- アスペクト比別
- 電源別
- アプリケーション別
- 素材タイプ別
- 販売チャネル別
- メキシコのデジタルフォトフレーム市場分析
- 画面サイズ別
- アスペクト比別
- 電源別
- アプリケーション別
- 素材タイプ別
- 販売チャネル別
- ブラジルのデジタルフォトフレーム市場分析
- 画面サイズ別
- アスペクト比別
- 電源別
- アプリケーション別
- 素材タイプ別
- 販売チャネル別
- ドイツのデジタルフォトフレーム市場分析
- 画面サイズ別
- アスペクト比別
- 電源別
- アプリケーション別
- 素材タイプ別
- 販売チャネル別
- イタリアのデジタルフォトフレーム市場分析
- 画面サイズ別
- アスペクト比別
- 電源別
- アプリケーション別
- 素材タイプ別
- 販売チャネル別
- 英国のデジタルフォトフレーム市場分析
- 画面サイズ別
- アスペクト比別
- 電源別
- アプリケーション別
- 素材タイプ別
- 販売チャネル別
- 中国のデジタルフォトフレーム市場分析
- 画面サイズ別
- アスペクト比別
- 電源別
- アプリケーション別
- 素材タイプ別
- 販売チャネル別
- 日本のデジタルフォトフレーム市場分析
- 画面サイズ別
- アスペクト比別
- 電源別
- アプリケーション別
- 素材タイプ別
- 販売チャネル別
- 韓国のデジタルフォトフレーム市場分析
- 画面サイズ別
- アスペクト比別
- 電源別
- アプリケーション別
- 素材タイプ別
- 販売チャネル別
- インドのデジタルフォトフレーム市場分析
- 画面サイズ別
- アスペクト比別
- 電源別
- アプリケーション別
- 素材タイプ別
- 販売チャネル別
- オーストラリアとニュージーランドのデジタルフォトフレーム市場分析
- 画面サイズ別
- アスペクト比別
- 電源別
- アプリケーション別
- 素材タイプ別
- 販売チャネル別
- 南アフリカのデジタルフォトフレーム市場分析
- 画面サイズ別
- アスペクト比別
- 電源別
- アプリケーション別
- 素材タイプ別
- 販売チャネル別
第23章 市場構造分析
- 企業階層別市場分析(デジタルフォトフレーム)
- 市場集中
- 主要企業の市場シェア分析
- 市場プレゼンス分析
第24章 競合分析
- 競合ダッシュボード
- 競合による価格分析
- 競合ベンチマーク
- 競合の詳細
- Sony Corporation
- LG Electronics
- Aluratek
- ViewSonic Corporation
- PhotoSpring Inc.
- Sungale
- Aura
- HP Development Company, LP
- Nixplay
- Koninklijke Philips NV
- OSRAM GmbH
- Joy
- GiiNii Tech Corporation
- Digital Foci, Inc.
- Others(as per request)
第25章 使用される仮定と頭字語
第26章 調査手法
Persistence Market Research has recently released a comprehensive report on the worldwide market for digital photo frames. The report offers a thorough assessment of crucial market dynamics, including drivers, trends, opportunities, and challenges, providing detailed insights into the market structure.
Key Insights:
- Digital Photo Frame Market Size (2024E): USD 61.5 million
- Projected Market Value (2033F): USD 76.2 million
- Global Market Growth Rate (CAGR 2024 to 2033): 2.4%
Digital Photo Frame Market - Report Scope:
Digital photo frames are electronic devices designed to display digital images without the need for a computer or printer. They are equipped with an LCD screen, internal storage, and often feature Wi-Fi connectivity, enabling users to upload and view images directly from their smartphones or other devices. The market for digital photo frames caters to both individual consumers and commercial settings, such as retail stores, offices, and hospitality venues. Market growth is driven by the increasing popularity of digital photography, advancements in display technology, and the growing trend of smart home devices.
Market Growth Drivers:
The global digital photo frame market is propelled by several key factors, including the rising adoption of digital photography and the growing demand for personalized home decor solutions. The increasing use of smartphones and digital cameras has led to a surge in digital photo collections, creating a demand for convenient and stylish ways to display these images. Technological advancements, such as high-resolution displays and smart connectivity features, enhance the user experience and drive market expansion. Additionally, the growing trend of smart homes and the integration of digital photo frames with other smart devices contribute to market growth.
Market Restraints:
Despite promising growth prospects, the digital photo frame market faces challenges related to competition from other digital display devices, such as tablets and smart TVs. The relatively high cost of digital photo frames, particularly those with advanced features, may also hinder market penetration in price-sensitive regions. Moreover, concerns about data security and privacy, particularly with Wi-Fi-enabled frames, may affect consumer confidence and adoption rates. Addressing these challenges requires continuous innovation and the development of affordable, secure, and user-friendly products.
Market Opportunities:
The digital photo frame market presents significant growth opportunities driven by advancements in display technology, increasing disposable incomes, and evolving consumer preferences. The integration of artificial intelligence (AI) and machine learning (ML) in digital photo frames can enhance image recognition and sorting capabilities, providing users with a more personalized and interactive experience. Furthermore, the expanding application of digital photo frames in commercial settings, such as advertising and information displays, broadens the market scope. Strategic partnerships, investment in research and development, and the introduction of innovative, cost-effective products are essential to capitalize on emerging opportunities and sustain market leadership.
Key Questions Answered in the Report:
- What are the primary factors driving the growth of the digital photo frame market globally?
- Which types and applications of digital photo frames are driving adoption across different consumer and commercial settings?
- How are technological advancements reshaping the competitive landscape of the digital photo frame market?
- Who are the key players contributing to the digital photo frame market, and what strategies are they employing to maintain market relevance?
- What are the emerging trends and future prospects in the global digital photo frame market?
Competitive Intelligence and Business Strategy:
Leading players in the global digital photo frame market, including Nixplay, Aluratek, and Aura Frames, focus on innovation, product differentiation, and strategic partnerships to gain a competitive edge. These companies invest in R&D to develop advanced digital photo frames with features such as touchscreen displays, cloud storage, and smart home integration, catering to diverse consumer needs and preferences. Collaborations with tech companies, retailers, and digital content providers facilitate market access and promote technology adoption. Moreover, emphasis on marketing, customer service, and user education fosters market growth and enhances user satisfaction in the rapidly evolving digital photo frame landscape.
Key Companies Profiled:
- Sony Corporation
- LG Electronics
- Aluratek
- ViewSonic Corporation
- PhotoSpring Inc.
- Sungale
- Aura
- HP Development Company, L.P.
- Nixplay
- Koninklijke Philips N.V.
- OSRAM GmbH
- Joy
- GiiNii Tech Corporation
- Digital Foci, Inc.
Key Segments of Digital Photo Frame Industry Research
By Screen Size:
- 7 to 9.9 Inches
- 10 to 12.9 Inches
- 13 Inches & Above
By Aspect Ratio:
- Standard (4:3)
- Widescreen (16:9)
By Power Supply:
- Electric
- Battery-Operated
By Application:
- Residential
- Commercial
By Material Type:
- Plastic
- Metal
- Wood
- Glass
By Sales Channel:
- Wholesalers/Distributors
- Hypermarkets/Supermarkets
- Specialty Stores
- Multi-brand Stores
- Independent Small Stores
- Online Retailers
By Region:
- North America
- Latin America
- Europe
- East Asia
- South Asia
- Oceania
- Middle East Africa
Table of Contents
1. Executive Summary
- 1.1. Global Market Overview
- 1.2. Summary of Key Statistics
- 1.3. Summary of Key Findings
- 1.4. Product Evolution Analysis
- 1.5. PMR Analysis and Recommendations
2. Market Overview
- 2.1. Market Coverage/Taxonomy
- 2.2. Market Definition/Scope/Limitations
3. Key Market Trends
- 3.1. Key Trends Impacting the Market
- 3.1.1. Virtual Reality's Influence Will Grow
- 3.1.2. The Great Demand For The Smart Electronic Devices
- 3.1.3. Growing Adoption of Smart Technologies
- 3.1.4. Others (during course of study)
- 3.2. Product Innovation Trends
- 3.3. Future Prospects of the Digital Photo Frame Industry
- 3.3.1. Factors Fuelling the Growth
- 3.3.2. Influx of Brands
- 3.3.3. Innovative Distribution and Marketing Strategies
4. Global Digital Photo Frame Market Demand Analysis 2019-2023 and Forecast, 2024-2033
- 4.1. Historical Market Volume ('000 Units) Analysis, 2019-2023
- 4.2. Current and Future Market Volume ('000 Units) Projections, 2024-2033
- 4.3. Y-o-Y Growth Trend Analysis
5. Global Digital Photo Frame Market - Pricing Analysis
- 5.1. Pricing Analysis By Screen Size
- 5.2. Global Average Pricing Analysis Benchmark
6. Global Digital Photo Frame Market Demand (in Value or Packaging Format in US$ Mn) Analysis 2019-2023 and Forecast, 2024-2033
- 6.1. Historical Market Value (US$ Mn) Analysis, 2019-2023
- 6.2. Current and Future Market Value (US$ Mn) Projections, 2024-2033
- 6.2.1. Y-o-Y Growth Trend Analysis
- 6.2.2. Absolute $ Opportunity Analysis
7. Market Background
- 7.1. Macro-Economic Factors
- 7.1.1. GDP Growth Outlook
- 7.1.2. Consumer Spending Outlook
- 7.1.3. GDP Growth Rate Analysis
- 7.1.4. Income Group Population Overview
- 7.1.5. Per Capita Disposable Income
- 7.2. Forecast Factors - Relevance & Impact
- 7.2.1. Top Companies Historical Growth
- 7.2.2. Urbanization Growth Outlook
- 7.2.3. Others
- 7.3. PESTLE Analysis of Global Digital Photo Frame Market
- 7.4. Investment Feasibility Matrix of Digital Photo Frame Market
- 7.5. Porter's Five Forces Analysis of Global Digital Photo Frame Market
- 7.6. Market Dynamics
- 7.6.1. Drivers
- 7.6.2. Restraints
- 7.6.3. Opportunity Analysis
8. Global Digital Photo Frame Market Analysis 2019-2023 and Forecast 2024-2033, By Screen Size
- 8.1. Introduction / Key Findings
- 8.2. Historical Market Size (US$ Mn) Analysis By Screen Size, 2019-2023
- 8.3. Current and Future Market Size (US$ Mn) Analysis and Forecast By Screen Size, 2024-2033
- 8.3.1. 7-9.9 Inches
- 8.3.2. 10- 12.9 Inches
- 8.3.3. 13 Inches & Above
- 8.4. Market Attractiveness Analysis By Screen Size
9. Global Digital Photo Frame Market Analysis 2019-2023 and Forecast 2024-2033, by Aspect Ratio
- 9.1. Introduction / Key Findings
- 9.2. Historical Market Size (US$ Mn) and Volume Analysis By Aspect Ratio, 2019-2023
- 9.3. Current and Future Market Size (US$ Mn) and Volume Analysis and Forecast By Aspect Ratio, 2024-2033
- 9.3.1. Standard (4:3)
- 9.3.2. Widescreen (16:9)
- 9.4. Market Attractiveness Analysis By Aspect Ratio
10. Global Digital Photo Frame Market Analysis 2019-2023 and Forecast 2024-2033, by Power Supply
- 10.1. Introduction / Key Findings
- 10.2. Historical Market Size (US$ Mn) and Volume Analysis By Power Supply, 2019-2023
- 10.3. Current and Future Market Size (US$ Mn) and Volume Analysis and Forecast By Power Supply, 2024-2033
- 10.3.1. Electric
- 10.3.2. Battery Operated
- 10.4. Market Attractiveness Analysis By Power Supply
11. Global Digital Photo Frame Market Analysis 2019-2023 and Forecast 2024-2033, by Application
- 11.1. Introduction / Key Findings
- 11.2. Historical Market Size (US$ Mn) and Volume Analysis By Application, 2019-2023
- 11.3. Current and Future Market Size (US$ Mn) and Volume Analysis and Forecast By Application, 2024-2033
- 11.3.1. Residential
- 11.3.2. Commercial
- 11.4. Market Attractiveness Analysis By Application
12. Global Digital Photo Frame Market Analysis 2019-2023 and Forecast 2024-2033, by Material Type
- 12.1. Introduction / Key Findings
- 12.2. Historical Market Size (US$ Mn) and Volume Analysis By Material type, 2019-2023
- 12.3. Current and Future Market Size (US$ Mn) and Volume Analysis and Forecast By Material type, 2024-2033
- 12.3.1. Plastic
- 12.3.2. Metal
- 12.3.3. Wood
- 12.3.4. Glass
- 12.4. Market Attractiveness Analysis By Material type
13. Global Digital Photo Frame Market Analysis 2019-2023 and Forecast 2024-2033, by Sales Channel
- 13.1. Introduction / Key Findings
- 13.2. Historical Market Size (US$ Mn) and Volume Analysis By Sales Channel, 2019-2023
- 13.3. Current and Future Market Size (US$ Mn) and Volume Analysis and Forecast By Sales Channel, 2024-2033
- 13.3.1. Wholesalers/Distributors
- 13.3.2. Hypermarkets/Supermarkets
- 13.3.3. Specialty Stores
- 13.3.4. Multi-brand Stores
- 13.3.5. Independent Small Stores
- 13.3.6. Online Retailers
- 13.4. Market Attractiveness Analysis By Sales Channel
14. Global Digital Photo Frame Market Analysis 2019-2023 and Forecast 2024-2033, by Region
- 14.1. Introduction
- 14.2. Historical Market Size (US$ Mn) and Volume ('000 Units) Analysis by Region, 2019-2023
- 14.3. Current Market Size (US$ Mn) and Volume ('000 Units) Analysis and Forecast by Region, 2024-2033
- 14.3.1. North America
- 14.3.2. Latin America
- 14.3.3. Europe
- 14.3.4. East Asia
- 14.3.5. South Asia
- 14.3.6. Oceania
- 14.3.7. Middle East and Africa (MEA)
- 14.4. Market Attractiveness Analysis by Region
15. North America Digital Photo Frame Market Analysis 2019-2023 and Forecast 2024-2033
- 15.1. Introduction
- 15.2. Pricing Analysis
- 15.3. Historical Market Size (US$ Mn) and Volume Trend Analysis By Market Taxonomy, 2019-2023
- 15.4. Market Size (US$ Mn) and Volume Forecast By Market Taxonomy, 2024-2033
- 15.4.1. By Country
- 15.4.1.1. U.S.
- 15.4.1.2. Canada
- 15.4.2. By Screen Size
- 15.4.3. By Aspect Ratio
- 15.4.4. By Power Supply
- 15.4.5. By Application
- 15.4.6. By Material Type
- 15.4.7. By Sales Channel
- 15.4.1. By Country
- 15.5. Market Attractiveness Analysis
- 15.5.1. By Country
- 15.5.2. By Screen Size
- 15.5.3. By Aspect Ratio
- 15.5.4. By Power Supply
- 15.5.5. By Application
- 15.5.6. By Material Type
- 15.5.7. By Sales Channel
16. Latin America Digital Photo Frame Market Analysis 2019-2023 and Forecast 2024-2033
- 16.1. Introduction
- 16.2. Pricing Analysis
- 16.3. Historical Market Size (US$ Mn) and Volume Trend Analysis By Market Taxonomy, 2019-2023
- 16.4. Market Size (US$ Mn) and Volume Forecast By Market Taxonomy, 2024-2033
- 16.4.1. By Country
- 16.4.1.1. Brazil
- 16.4.1.2. Mexico
- 16.4.1.3. Rest of Latin America
- 16.4.2. By Screen Size
- 16.4.3. By Aspect Ratio
- 16.4.4. By Power Supply
- 16.4.5. By Application
- 16.4.6. By Material Type
- 16.4.7. By Sales Channel
- 16.4.1. By Country
- 16.5. Market Attractiveness Analysis
- 16.5.1. By Country
- 16.5.2. By Screen Size
- 16.5.3. By Aspect Ratio
- 16.5.4. By Power Supply
- 16.5.5. By Application
- 16.5.6. By Material Type
- 16.5.7. By Sales Channel
17. Europe Digital Photo Frame Market Analysis 2019-2023 and Forecast 2024-2033
- 17.1. Introduction
- 17.2. Pricing Analysis
- 17.3. Historical Market Size (US$ Mn) and Volume Trend Analysis By Market Taxonomy, 2019-2023
- 17.4. Market Size (US$ Mn) and Volume Forecast By Market Taxonomy, 2024-2033
- 17.4.1. By Country
- 17.4.1.1. Germany
- 17.4.1.2. Italy
- 17.4.1.3. France
- 17.4.1.4. U.K.
- 17.4.1.5. Spain
- 17.4.1.6. Rest of Europe
- 17.4.2. By Screen Size
- 17.4.3. By Aspect Ratio
- 17.4.4. By Power Supply
- 17.4.5. By Application
- 17.4.6. By Material Type
- 17.4.7. By Sales Channel
- 17.4.1. By Country
- 17.5. Market Attractiveness Analysis
- 17.5.1. By Country
- 17.5.2. By Screen Size
- 17.5.3. By Aspect Ratio
- 17.5.4. By Power Supply
- 17.5.5. By Application
- 17.5.6. By Material Type
- 17.5.7. By Sales Channel
18. South Asia Digital Photo Frame Market Analysis 2019-2023 and Forecast 2024-2033
- 18.1. Introduction
- 18.2. Pricing Analysis
- 18.3. Historical Market Size (US$ Mn) and Volume Trend Analysis By Market Taxonomy, 2019-2023
- 18.4. Market Size (US$ Mn) and Volume Forecast By Market Taxonomy, 2024-2033
- 18.4.1. By Country
- 18.4.1.1. India
- 18.4.1.2. Thailand
- 18.4.1.3. Indonesia
- 18.4.1.4. Malaysia
- 18.4.1.5. Rest of South Asia
- 18.4.2. By Screen Size
- 18.4.3. By Aspect Ratio
- 18.4.4. By Power Supply
- 18.4.5. By Application
- 18.4.6. By Material Type
- 18.4.7. By Sales Channel
- 18.4.1. By Country
- 18.5. Market Attractiveness Analysis
- 18.5.1. By Country
- 18.5.2. By Screen Size
- 18.5.3. By Aspect Ratio
- 18.5.4. By Power Supply
- 18.5.5. By Application
- 18.5.6. By Material Type
- 18.5.7. By Sales Channel
19. East Asia Digital Photo Frame Market Analysis 2019-2023 and Forecast 2024-2033
- 19.1. Introduction
- 19.2. Pricing Analysis
- 19.3. Historical Market Size (US$ Mn) and Volume Trend Analysis By Market Taxonomy, 2019-2023
- 19.4. Market Size (US$ Mn) and Volume Forecast By Market Taxonomy, 2024-2033
- 19.4.1. By Country
- 19.4.1.1. China
- 19.4.1.2. Japan
- 19.4.1.3. South Korea
- 19.4.2. By Screen Size
- 19.4.3. By Aspect Ratio
- 19.4.4. By Power Supply
- 19.4.5. By Application
- 19.4.6. By Material Type
- 19.4.7. By Sales Channel
- 19.4.1. By Country
- 19.5. Market Attractiveness Analysis
- 19.5.1. By Country
- 19.5.2. By Screen Size
- 19.5.3. By Aspect Ratio
- 19.5.4. By Power Supply
- 19.5.5. By Application
- 19.5.6. By Material Type
- 19.5.7. By Sales Channel
20. Oceania Digital Photo Frame Market Analysis 2019-2023 and Forecast 2024-2033
- 20.1. Introduction
- 20.2. Pricing Analysis
- 20.3. Historical Market Size (US$ Mn) and Volume Trend Analysis By Market Taxonomy, 2019-2023
- 20.4. Market Size (US$ Mn) and Volume Forecast By Market Taxonomy, 2024-2033
- 20.4.1. By Country
- 20.4.1.1. Australia
- 20.4.1.2. New Zealand
- 20.4.2. By Screen Size
- 20.4.3. By Aspect Ratio
- 20.4.4. By Power Supply
- 20.4.5. By Application
- 20.4.6. By Material Type
- 20.4.7. By Sales Channel
- 20.4.1. By Country
- 20.5. Market Attractiveness Analysis
- 20.5.1. By Country
- 20.5.2. By Screen Size
- 20.5.3. By Aspect Ratio
- 20.5.4. By Power Supply
- 20.5.5. By Application
- 20.5.6. By Material Type
- 20.5.7. By Sales Channel
21. Middle East and Africa Digital Photo Frame Market Analysis 2019-2023 and Forecast 2024-2033
- 21.1. Introduction
- 21.2. Pricing Analysis
- 21.3. Historical Market Size (US$ Mn) and Volume Trend Analysis By Market Taxonomy, 2019-2023
- 21.4. Market Size (US$ Mn) and Volume Forecast By Market Taxonomy, 2024-2033
- 21.4.1. By Country
- 21.4.1.1. GCC Countries
- 21.4.1.2. Northern Africa
- 21.4.1.3. South Africa
- 21.4.1.4. Rest of Middle East and Africa
- 21.4.2. By Screen Size
- 21.4.3. By Aspect Ratio
- 21.4.4. By Power Supply
- 21.4.5. By Application
- 21.4.6. By Material Type
- 21.4.7. By Sales Channel
- 21.4.1. By Country
- 21.5. Market Attractiveness Analysis
- 21.5.1. By Country
- 21.5.2. By Screen Size
- 21.5.3. By Aspect Ratio
- 21.5.4. By Power Supply
- 21.5.5. By Application
- 21.5.6. By Material Type
- 21.5.7. By Sales Channel
22. Key Countries' Digital Photo Frame Market Analysis 2024-2033
- 22.1. Introduction
- 22.1.1. Market Value Proportion Analysis, By Key Countries
- 22.1.2. Global Vs. Country Growth Comparison
- 22.2. U.S. Digital Photo Frame Market Analysis
- 22.2.1. By Screen Size
- 22.2.2. By Aspect Ratio
- 22.2.3. By Power Supply
- 22.2.4. By Application
- 22.2.5. By Material Type
- 22.2.6. By Sales Channel
- 22.3. Canada Digital Photo Frame Market Analysis
- 22.3.1. By Screen Size
- 22.3.2. By Aspect Ratio
- 22.3.3. By Power Supply
- 22.3.4. By Application
- 22.3.5. By Material Type
- 22.3.6. By Sales Channel
- 22.4. Mexico Digital Photo Frame Market Analysis
- 22.4.1. By Screen Size
- 22.4.2. By Aspect Ratio
- 22.4.3. By Power Supply
- 22.4.4. By Application
- 22.4.5. By Material Type
- 22.4.6. By Sales Channel
- 22.5. Brazil Digital Photo Frame Market Analysis
- 22.5.1. By Screen Size
- 22.5.2. By Aspect Ratio
- 22.5.3. By Power Supply
- 22.5.4. By Application
- 22.5.5. By Material Type
- 22.5.6. By Sales Channel
- 22.6. Germany Digital Photo Frame Market Analysis
- 22.6.1. By Screen Size
- 22.6.2. By Aspect Ratio
- 22.6.3. By Power Supply
- 22.6.4. By Application
- 22.6.5. By Material Type
- 22.6.6. By Sales Channel
- 22.7. Italy Digital Photo Frame Market Analysis
- 22.7.1. By Screen Size
- 22.7.2. By Aspect Ratio
- 22.7.3. By Power Supply
- 22.7.4. By Application
- 22.7.5. By Material Type
- 22.7.6. By Sales Channel
- 22.8. U.K. Digital Photo Frame Market Analysis
- 22.8.1. By Screen Size
- 22.8.2. By Aspect Ratio
- 22.8.3. By Power Supply
- 22.8.4. By Application
- 22.8.5. By Material Type
- 22.8.6. By Sales Channel
- 22.9. China Digital Photo Frame Market Analysis
- 22.9.1. By Screen Size
- 22.9.2. By Aspect Ratio
- 22.9.3. By Power Supply
- 22.9.4. By Application
- 22.9.5. By Material Type
- 22.9.6. By Sales Channel
- 22.10. Japan Digital Photo Frame Market Analysis
- 22.10.1. By Screen Size
- 22.10.2. By Aspect Ratio
- 22.10.3. By Power Supply
- 22.10.4. By Application
- 22.10.5. By Material Type
- 22.10.6. By Sales Channel
- 22.11. S. Korea Digital Photo Frame Market Analysis
- 22.11.1. By Screen Size
- 22.11.2. By Aspect Ratio
- 22.11.3. By Power Supply
- 22.11.4. By Application
- 22.11.5. By Material Type
- 22.11.6. By Sales Channel
- 22.12. India Digital Photo Frame Market Analysis
- 22.12.1. By Screen Size
- 22.12.2. By Aspect Ratio
- 22.12.3. By Power Supply
- 22.12.4. By Application
- 22.12.5. By Material Type
- 22.12.6. By Sales Channel
- 22.13. Australia and New Zealand Digital Photo Frame Market Analysis
- 22.13.1. By Screen Size
- 22.13.2. By Aspect Ratio
- 22.13.3. By Power Supply
- 22.13.4. By Application
- 22.13.5. By Material Type
- 22.13.6. By Sales Channel
- 22.14. South Africa Digital Photo Frame Market Analysis
- 22.14.1. By Screen Size
- 22.14.2. By Aspect Ratio
- 22.14.3. By Power Supply
- 22.14.4. By Application
- 22.14.5. By Material Type
- 22.14.6. By Sales Channel
23. Market Structure Analysis
- 23.1. Market Analysis by Tier of Companies (Digital Photo Frame)
- 23.2. Market Concentration
- 23.3. Market Share Analysis of Top Players
- 23.4. Market Presence Analysis
- 23.4.1. By Regional Footprint of Players
- 23.4.2. Product Footprint by Players
- 23.4.3. Channel Footprint by Players
24. Competition Analysis
- 24.1. Competition Dashboard
- 24.2. Pricing Analysis by Competition
- 24.3. Competition Benchmarking
- 24.4. Competition Deep Dive
- 24.4.1. Sony Corporation
- 24.4.1.1. Overview
- 24.4.1.2. Product Portfolio
- 24.4.1.3. Profitability by Market Segments (Product/Channel/Region)
- 24.4.1.4. Sales Footprint
- 24.4.1.5. Strategy Overview
- 24.4.1.5.1. Marketing Strategy
- 24.4.1.5.2. Service Strategy
- 24.4.2. LG Electronics
- 24.4.2.1. Overview
- 24.4.2.2. Product Portfolio
- 24.4.2.3. Profitability by Market Segments (Product/Channel/Region)
- 24.4.2.4. Sales Footprint
- 24.4.2.5. Strategy Overview
- 24.4.2.5.1. Marketing Strategy
- 24.4.2.5.2. Service Strategy
- 24.4.3. Aluratek
- 24.4.3.1. Overview
- 24.4.3.2. Product Portfolio
- 24.4.3.3. Profitability by Market Segments (Product/Channel/Region)
- 24.4.3.4. Sales Footprint
- 24.4.3.5. Strategy Overview
- 24.4.3.5.1. Marketing Strategy
- 24.4.3.5.2. Service Strategy
- 24.4.4. ViewSonic Corporation
- 24.4.4.1. Overview
- 24.4.4.2. Product Portfolio
- 24.4.4.3. Profitability by Market Segments (Product/Channel/Region)
- 24.4.4.4. Sales Footprint
- 24.4.4.5. Strategy Overview
- 24.4.4.5.1. Marketing Strategy
- 24.4.4.5.2. Service Strategy
- 24.4.5. PhotoSpring Inc.
- 24.4.5.1. Overview
- 24.4.5.2. Product Portfolio
- 24.4.5.3. Profitability by Market Segments (Product/Channel/Region)
- 24.4.5.4. Sales Footprint
- 24.4.5.5. Strategy Overview
- 24.4.5.5.1. Marketing Strategy
- 24.4.5.5.2. Service Strategy
- 24.4.6. Sungale
- 24.4.6.1. Overview
- 24.4.6.2. Product Portfolio
- 24.4.6.3. Profitability by Market Segments (Product/Channel/Region)
- 24.4.6.4. Sales Footprint
- 24.4.6.5. Strategy Overview
- 24.4.6.5.1. Marketing Strategy
- 24.4.6.5.2. Service Strategy
- 24.4.7. Aura
- 24.4.7.1. Overview
- 24.4.7.2. Product Portfolio
- 24.4.7.3. Profitability by Market Segments (Product/Channel/Region)
- 24.4.7.4. Sales Footprint
- 24.4.7.5. Strategy Overview
- 24.4.7.5.1. Marketing Strategy
- 24.4.7.5.2. Service Strategy
- 24.4.8. HP Development Company, L.P.
- 24.4.8.1. Overview
- 24.4.8.2. Product Portfolio
- 24.4.8.3. Profitability by Market Segments (Product/Channel/Region)
- 24.4.8.4. Sales Footprint
- 24.4.8.5. Strategy Overview
- 24.4.8.5.1. Marketing Strategy
- 24.4.8.5.2. Service Strategy
- 24.4.9. Nixplay
- 24.4.9.1. Overview
- 24.4.9.2. Product Portfolio
- 24.4.9.3. Profitability by Market Segments (Product/Channel/Region)
- 24.4.9.4. Sales Footprint
- 24.4.9.5. Strategy Overview
- 24.4.9.5.1. Marketing Strategy
- 24.4.9.5.2. Service Strategy
- 24.4.10. Koninklijke Philips N.V.
- 24.4.10.1. Overview
- 24.4.10.2. Product Portfolio
- 24.4.10.3. Profitability by Market Segments (Product/Channel/Region)
- 24.4.10.4. Sales Footprint
- 24.4.10.5. Strategy Overview
- 24.4.10.5.1. Marketing Strategy
- 24.4.10.5.2. Service Strategy
- 24.4.11. OSRAM GmbH
- 24.4.11.1. Overview
- 24.4.11.2. Product Portfolio
- 24.4.11.3. Profitability by Market Segments (Product/Channel/Region)
- 24.4.11.4. Sales Footprint
- 24.4.11.5. Strategy Overview
- 24.4.11.5.1. Marketing Strategy
- 24.4.11.5.2. Service Strategy
- 24.4.12. Joy
- 24.4.12.1. Overview
- 24.4.12.2. Product Portfolio
- 24.4.12.3. Profitability by Market Segments (Product/Channel/Region)
- 24.4.12.4. Sales Footprint
- 24.4.12.5. Strategy Overview
- 24.4.12.5.1. Marketing Strategy
- 24.4.12.5.2. Service Strategy
- 24.4.13. GiiNii Tech Corporation
- 24.4.13.1. Overview
- 24.4.13.2. Product Portfolio
- 24.4.13.3. Profitability by Market Segments (Product/Channel/Region)
- 24.4.13.4. Sales Footprint
- 24.4.13.5. Strategy Overview
- 24.4.13.5.1. Marketing Strategy
- 24.4.13.5.2. Service Strategy
- 24.4.14. Digital Foci, Inc.
- 24.4.14.1. Overview
- 24.4.14.2. Product Portfolio
- 24.4.14.3. Profitability by Market Segments (Product/Channel/Region)
- 24.4.14.4. Sales Footprint
- 24.4.14.5. Strategy Overview
- 24.4.14.5.1. Marketing Strategy
- 24.4.14.5.2. Service Strategy
- 24.4.15. Others (as per request)
- 24.4.15.1. Overview
- 24.4.15.2. Product Portfolio
- 24.4.15.3. Profitability by Market Segments (Product/Channel/Region)
- 24.4.15.4. Sales Footprint
- 24.4.15.5. Strategy Overview
- 24.4.15.5.1. Marketing Strategy
- 24.4.15.5.2. Service Strategy
- 24.4.1. Sony Corporation