|
|
市場調査レポート
商品コード
1482448
指向性エネルギー兵器市場:地域別(北米、欧州、アジア太平洋、ラテンアメリカ、中東アフリカ)世界の産業分析、規模、シェア、成長、動向、2024-2031年予測Direct Energy Weapon Market by Geography (North America, Europe, Asia Pacific, Latin America, and the Middle East and Africa): Global Industry Analysis, Size, Share, Growth, Trends, and Forecast, 2024-2031 |
||||||

|
|||||||
カスタマイズ可能
|
|||||||

| 指向性エネルギー兵器市場:地域別(北米、欧州、アジア太平洋、ラテンアメリカ、中東アフリカ)世界の産業分析、規模、シェア、成長、動向、2024-2031年予測 |
|
出版日: 2024年05月16日
発行: Persistence Market Research
ページ情報: 英文 287 Pages
納期: 2~5営業日
|

全表示
- 概要
- 目次
Persistence Market Research社は、世界の指向性エネルギー兵器(DEW)市場を徹底的に分析し、市場力学、成長触媒、課題、新興動向に関する洞察を提供しています。本レポートは、利害関係者のための包括的なリソースとして機能し、DEW市場情勢をナビゲートするための詳細なデータと統計を提供します。
世界の指向性エネルギー兵器市場は現在27億米ドルと評価されており、CAGR 22.3%で拡大すると予測されています。様々な政府組織からの支援の増加により、市場は2031年までに110億9,000万米ドルに拡大する見込みです。
主な洞察
- 推定市場価値(2024年):27億米ドル
- 予測市場価値(2031年)110億9,000万米ドル
- 世界市場成長率(CAGR 2024年~2031年):22.3%
指向性エネルギー兵器市場-調査範囲:
指向性エネルギー兵器には、高エネルギーレーザー(HEL)や高出力マイクロ波(HPM)を含むさまざまな技術が含まれ、ミサイル防衛、対空システム、対エレクトロニクスなど、さまざまな軍事用途向けに設計されています。DEWへのシフトは、正確さとスピードが戦略的優位を維持するために重要である非対称戦争への重点の高まりを反映しています。
市場成長の促進要因:
DEW市場は、主要軍事大国による防衛近代化プログラムへの投資の増加、レーザーおよびマイクロ波技術の技術進歩、ドローン群、弾道ミサイル、無人航空機(UAV)の脅威の増大など、いくつかの要因によって牽引されています。DEWは、従来の運動兵器と比較して、迅速な対応能力、精度の向上、巻き添え被害の低減を実現し、軍事用途として魅力的です。
さらに、防空・ミサイル防衛プラットフォーム、艦艇、地上施設などの既存の防衛システムにDEWを統合することで、全体的な軍事能力と抑止態勢が強化されます。さらに、従来の兵器システムと比較して、運用コストやライフサイクルコストの面でDEWの費用対効果が高いことが、世界中の防衛機関によるDEWの採用を後押ししています。
市場抑制要因:
DEW市場は大きな成長の見込みがあるにもかかわらず、技術的限界、規制上の制約、運用上の要件に関する課題に直面しています。HELとHPMの高出力とビーム品質を達成することは依然として技術的課題であり、実世界のシナリオにおける有効性と信頼性に影響を与えています。
さらに、軍備管理・不拡散に関する国際条約や条約を含む、DEWsの配備と使用に関連する規制上のハードルが、市場の成長を制限する可能性があります。さらに、既存の軍事プラットフォームやインフラストラクチャーにDEWを統合する運用上の複雑さは、広範な試験、検証、訓練を必要とし、採用率をさらに鈍らせる。
市場機会:
DEW市場は、特に固体レーザー、ファイバーレーザー、フェーズドアレイアンテナなどの次世代レーザーおよびマイクロ波技術の開発において、技術革新と拡大のための多くの機会を提示しています。ビーム制御、パワースケーリング、熱管理の進歩は、DEWの性能と信頼性を高め、広範な軍事用途への適用をより現実的なものにします。
さらに、宇宙を利用した戦争、サイバー防衛、電子戦争といった新たな領域における指向性エネルギー能力に対する需要の高まりは、成長と多様化のための新たな道を提示しています。防衛請負業者、研究機関、政府機関のコラボレーションは、技術革新を促進し、世界の防衛市場におけるDEWの採用を加速します。
本レポートで扱う主な質問
- 2024年から2031年までの指向性エネルギー兵器市場の期待値CAGRは?
- 指向性エネルギー兵器市場の成長を促進する主な要因は何か?
- 指向性エネルギー兵器市場で最大の市場シェアを占める地域はどこか?
- 指向性エネルギー兵器の世界市場における主要プレイヤーは?
- 指向性エネルギー兵器市場で成長を維持するために主要企業が採用している戦略とは?
目次
第1章 エグゼクティブサマリー
第2章 市場概要
- 市場範囲/分類
- 市場の定義/範囲/制限
第3章 市場背景
- 市場力学
- シナリオ予測
- 機会マップ分析
- 製品ライフサイクル分析
- サプライチェーン分析
- 投資実現可能性マトリックス
- バリューチェーン分析
- PESTLEとポーター分析
- 規制状況
- 地域親市場見通し
- 生産・消費統計
- 輸入と輸出の統計
第4章 世界の指向性エネルギー兵器市場分析
- 過去の市場規模(金額および数量)分析、2019-2023年
- 現在および将来の市場規模(金額および数量)予測、2024~2031年
第5章 技術別:世界指向性エネルギー兵器市場分析
- イントロダクション/主な調査結果
- 過去の市場規模(金額および数量)分析、2019-2023年
- 現在および将来の市場規模(金額および数量)分析・予測、2024-2031年
- レーザ
- 高エネルギー
- 低エネルギー
- 電子レンジ
- 粒子ビーム
- その他
- レーザ
- 前年比成長動向分析、2019~2023年
- 絶対的収益の機会分析、2024~2031年
第6章 射程別:世界指向性エネルギー兵器市場分析
- イントロダクション/主な調査結果
- 過去の市場規模(金額および数量)分析、2019-2023年
- 現在および将来の市場規模(金額および数量)分析・予測、2024-2031年
- 1マイル未満
- 1マイル以上
- 前年比成長動向分析、2019~2023年
- 絶対的収益の機会分析、2024~2031年
第7章 用途別:世界の指向性エネルギー兵器市場分析
- イントロダクション/主な調査結果
- 過去の市場規模(金額および数量)分析、2019-2023年
- 現在および将来の市場規模(金額および数量)分析・予測、2024-2031年
- 地面
- 海軍
- 空中
- アプリケーション別前年比成長動向分析、2019~2023年
- アプリケーション別の絶対的な$機会分析、2024-2031
第8章 プラットフォーム別:世界指向性エネルギー兵器市場分析
- イントロダクション/主な調査結果
- 過去の市場規模(金額および数量)分析、2019-2023年
- 現在および将来の市場規模(金額および数量)分析・予測、2024-2031年
- 装甲車両
- 無人システム
- ハンドヘルドシステム
- 航空機システム
- 船舶と潜水艦
- その他
- 前年比成長動向分析、2019~2023年
- 絶対的収益の機会分析、2024~2031年
第9章 地域別:世界指向性エネルギー兵器市場分析
- イントロダクション
- 過去の市場規模(金額および数量)分析、2019-2023年
- 現在の市場規模(金額および数量)分析・予測、2024-2031年
- 北米
- ラテンアメリカ
- 欧州
- アジア太平洋地域
- 中東・アフリカ
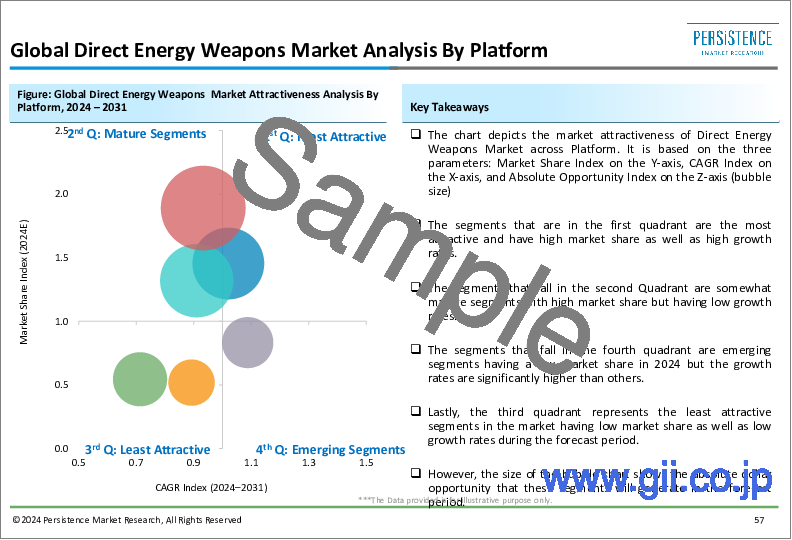
- 地域別市場魅力度分析
第10章 北米の指向性エネルギー兵器市場分析(国別)
第11章 ラテンアメリカの指向性エネルギー兵器市場分析(国別)
第12章 欧州の指向性エネルギー兵器市場分析(国別)
第13章 アジア太平洋地域の指向性エネルギー兵器市場分析(国別)
第14章 中東・アフリカの指向性エネルギー兵器市場分析(国別)
第15章 主要国の指向性エネルギー兵器市場分析
- 米国
- カナダ
- ブラジル
- メキシコ
- ドイツ
- 英国
- フランス
- スペイン
- イタリア
- 中国
- 日本
- 韓国
- シンガポール
- タイ
- インドネシア
- オーストラリア
- ニュージーランド
- GCC諸国
- 南アフリカ
- イスラエル
第16章 市場構造分析
- 競合ダッシュボード
- 競合ベンチマーク
- 主要企業の市場シェア分析
第17章 競合分析
- 競合の詳細
- Lockheed Martin Corporation
- Thales Group
- L3Harris Technologies, Inc.
- Elbit Systems Ltd.
- Raytheon Technologies Corporation
- BAE Systems
- Honeywell International Inc.
- Rheinmetall AG
- Moog, Inc.
- Boeing
第18章 使用される前提条件と頭字語
第19章 調査手法
Persistence Market Research presents an exhaustive analysis of the global Direct Energy Weapon (DEW) Market, offering insights into market dynamics, growth catalysts, challenges, and emerging trends. This report serves as a comprehensive resource for stakeholders, providing detailed data and statistics to navigate the DEW market landscape.
The global direct energy weapon market is currently valued at US$ 2.7 Billion and is anticipated to expand at a CAGR of 22.3%. Owing to the growing support from various governmental organizations, the market is likely to propel to US$ 11.09 Billion by 2031.
Key Insights:
- Estimated Market Value (2024): USD 2.7 Billion
- Projected Market Value (2031): USD 11.09 Billion
- Global Market Growth Rate (CAGR 2024 to 2031): 22.3%
Direct Energy Weapon Market - Report Scope:
Direct Energy Weapons encompass a range of technologies, including high-energy lasers (HELs) and high-power microwaves (HPMs), designed for various military applications such as missile defense, anti-aircraft systems, and counter-electronics. The shift towards DEWs reflects the growing emphasis on asymmetric warfare, where precision and speed are critical for maintaining strategic advantage.
Market Growth Drivers:
The DEW market is driven by several factors, including increasing investments in defense modernization programs by major military powers, technological advancements in laser and microwave technologies, and the growing threat of drone swarms, ballistic missiles, and unmanned aerial vehicles (UAVs). DEWs offer rapid response capabilities, enhanced precision, and reduced collateral damage compared to traditional kinetic weapons, making them attractive for military applications.
Furthermore, the integration of DEWs into existing defense systems, such as air and missile defense platforms, naval vessels, and ground-based installations, enhances overall military capabilities and deterrence posture. Additionally, the cost-effectiveness of DEWs in terms of operational and lifecycle costs compared to conventional weapons systems drives their adoption by defense agencies worldwide.
Market Restraints:
Despite its significant growth prospects, the DEW market faces challenges related to technological limitations, regulatory constraints, and operational requirements. Achieving high-power output and beam quality in HELs and HPMs remains a technical challenge, impacting their effectiveness and reliability in real-world scenarios.
Moreover, regulatory hurdles associated with the deployment and use of DEWs, including international treaties and conventions on arms control and non-proliferation, may limit market growth. Additionally, the operational complexities of integrating DEWs into existing military platforms and infrastructure require extensive testing, validation, and training, further slowing adoption rates.
Market Opportunities:
The DEW market presents numerous opportunities for innovation and expansion, particularly in the development of next-generation laser and microwave technologies, including solid-state lasers, fiber lasers, and phased-array antennas. Advances in beam control, power scaling, and thermal management will enhance the performance and reliability of DEWs, making them more viable for a wide range of military applications.
Furthermore, the increasing demand for directed energy capabilities in emerging domains such as space-based warfare, cyber defense, and electronic warfare presents new avenues for growth and diversification. Collaborations between defense contractors, research institutions, and government agencies will drive technological innovation and accelerate the adoption of DEWs in the global defense market.
Key Questions Addressed in the Report:
- What is the Expected Value CAGR of the Direct Energy Weapon Market from 2024 to 2031?
- What are the Key Factors Driving the Growth of the Direct Energy Weapon Market?
- Which Region Holds the Largest Market Share in the Direct Energy Weapon Market?
- Who are the Key Players in the Global Direct Energy Weapon Market?
- What Strategies are Adopted by Leading Companies to Sustain Growth in the Direct Energy Weapon Market?
Competitive Landscape and Business Strategies:
Leading players in the DEW market include Lockheed Martin Corporation, Northrop Grumman Corporation, Raytheon Technologies Corporation, and Boeing Company. These companies focus on research and development, strategic partnerships, and acquisitions to maintain their competitive edge and expand market presence.
Strategies such as collaboration with government agencies, technology licensing agreements, and joint ventures with international partners enable companies to access new markets and diversify their product portfolios. Additionally, investments in testing and validation facilities, training programs, and customer support services enhance customer satisfaction and loyalty.
Key Companies Profiled:
- Lockheed Martin Corporation
- Northrop Grumman Corporation
- Raytheon Technologies Corporation
- The Boeing Company
- BAE Systems plc
- Rheinmetall AG
- Kratos Defense & Security Solutions, Inc.
- L3Harris Technologies, Inc.
- Thales Group
- Leonardo S.p.A.
Direct Energy Weapon Market Segmentation:
Direct Energy Weapon Market by Technology
- Laser
High Energy
Low Energy
- Microwave
- Particle Beam
- Others
Direct Energy Weapon Market by Range
- Less Than 1 Mile
- More Than 1 Mile
Direct Energy Weapon Market by Application
- Ground
- Naval
- Airborne
Direct Energy Weapon Market by Platform
- Armored Vehicles
- Unmanned Systems
- Handheld Systems
- Aircraft Systems
- Ships and Submarines
- Others
By Region:
- North America
- Europe
- Asia Pacific
- Latin America
- Middle East & Africa
Table of Contents
1. Executive Summary
- 1.1. Global Market Outlook
- 1.2. Demand-side Trends
- 1.3. Supply-side Trends
- 1.4. Technology Roadmap Analysis
- 1.5. Analysis and Recommendations
2. Market Overview
- 2.1. Market Coverage / Taxonomy
- 2.2. Market Definition / Scope / Limitations
3. Market Background
- 3.1. Market Dynamics
- 3.1.1. Drivers
- 3.1.2. Restraints
- 3.1.3. Opportunity
- 3.1.4. Trends
- 3.2. Scenario Forecast
- 3.2.1. Demand in Optimistic Scenario
- 3.2.2. Demand in Likely Scenario
- 3.2.3. Demand in Conservative Scenario
- 3.3. Opportunity Map Analysis
- 3.4. Product Life Cycle Analysis
- 3.5. Supply Chain Analysis
- 3.5.1. Supply Side Participants and their Roles
- 3.5.1.1. Producers
- 3.5.1.2. Mid-Level Participants (Traders/ Agents/ Brokers)
- 3.5.1.3. Wholesalers and Distributors
- 3.5.2. Value Added and Value Created at Node in the Supply Chain
- 3.5.3. List of Raw Material Suppliers
- 3.5.4. List of Existing and Potential Buyer's
- 3.5.1. Supply Side Participants and their Roles
- 3.6. Investment Feasibility Matrix
- 3.7. Value Chain Analysis
- 3.7.1. Profit Margin Analysis
- 3.7.2. Wholesalers and Distributors
- 3.7.3. Retailers
- 3.8. PESTLE and Porter's Analysis
- 3.9. Regulatory Landscape
- 3.9.1. By Key Regions
- 3.9.2. By Key Countries
- 3.10. Regional Parent Market Outlook
- 3.11. Production and Consumption Statistics
- 3.12. Import and Export Statistics
4. Global Direct Energy Weapons Market Analysis 2019-2023 and Forecast, 2024-2031
- 4.1. Historical Market Size Value (US$ Mn) & Volume (Units) Analysis, 2019-2023
- 4.2. Current and Future Market Size Value (US$ Mn) & Volume (Units) Projections, 2024-2031
- 4.2.1. Y-o-Y Growth Trend Analysis
- 4.2.2. Absolute $ Opportunity Analysis
5. Global Direct Energy Weapons Market Analysis 2019-2023 and Forecast 2024-2031, By Technology
- 5.1. Introduction / Key Findings
- 5.2. Historical Market Size Value (US$ Mn) & Volume (Units) Analysis By Technology, 2019-2023
- 5.3. Current and Future Market Size Value (US$ Mn) & Volume (Units) Analysis and Forecast By Technology, 2024-2031
- 5.3.1. Laser
- 5.3.1.1. High Energy
- 5.3.1.2. Low Energy
- 5.3.2. Microwave
- 5.3.3. Particle Beam
- 5.3.4. Others
- 5.3.1. Laser
- 5.4. Y-o-Y Growth Trend Analysis By Technology, 2019-2023
- 5.5. Absolute $ Opportunity Analysis By Technology, 2024-2031
6. Global Direct Energy Weapons Market Analysis 2019-2023 and Forecast 2024-2031, By Range
- 6.1. Introduction / Key Findings
- 6.2. Historical Market Size Value (US$ Mn) & Volume (Units) Analysis By Range, 2019-2023
- 6.3. Current and Future Market Size Value (US$ Mn) & Volume (Units) Analysis and Forecast By Range, 2024-2031
- 6.3.1. Less than 1 Mile
- 6.3.2. More than 1 Mile
- 6.4. Y-o-Y Growth Trend Analysis By Range, 2019-2023
- 6.5. Absolute $ Opportunity Analysis By Range, 2024-2031
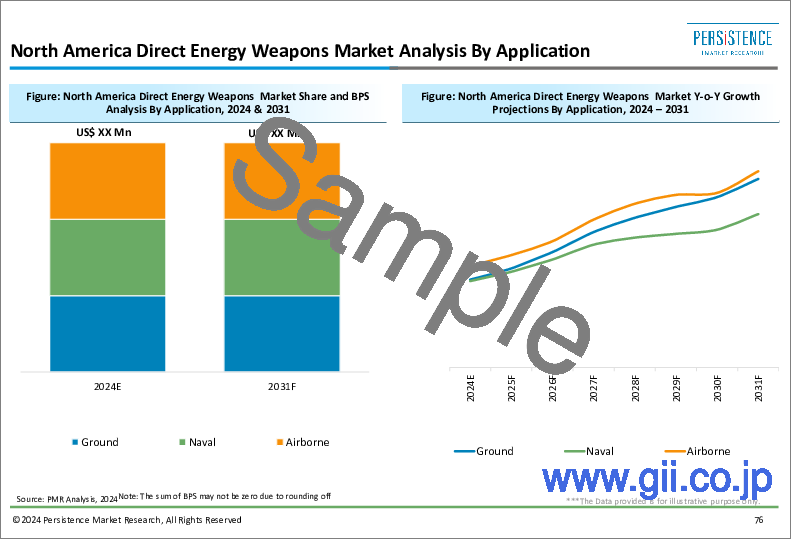
7. Global Direct Energy Weapons Market Analysis 2019-2023 and Forecast 2024-2031, By Application
- 7.1. Introduction / Key Findings
- 7.2. Historical Market Size Value (US$ Mn) & Volume (Units) Analysis By Application, 2019-2023
- 7.3. Current and Future Market Size Value (US$ Mn) & Volume (Units) Analysis and Forecast By Application, 2024-2031
- 7.3.1. Ground
- 7.3.2. Naval
- 7.3.3. Airborne
- 7.4. Y-o-Y Growth Trend Analysis By Application, 2019-2023
- 7.5. Absolute $ Opportunity Analysis By Application, 2024-2031
8. Global Direct Energy Weapons Market Analysis 2019-2023 and Forecast 2024-2031, By Platform
- 8.1. Introduction / Key Findings
- 8.2. Historical Market Size Value (US$ Mn) & Volume (Units) Analysis By Platform, 2019-2023
- 8.3. Current and Future Market Size Value (US$ Mn) & Volume (Units) Analysis and Forecast By Platform, 2024-2031
- 8.3.1. Armored Vehicles
- 8.3.2. Unmanned Systems
- 8.3.3. Handheld Systems
- 8.3.4. Aircraft Systems
- 8.3.5. Ships and Submarines
- 8.3.6. Others
- 8.4. Y-o-Y Growth Trend Analysis By Platform, 2019-2023
- 8.5. Absolute $ Opportunity Analysis By Platform, 2024-2031
9. Global Direct Energy Weapons Market Analysis 2019-2023 and Forecast 2024-2031, By Region
- 9.1. Introduction
- 9.2. Historical Market Size Value (US$ Mn) & Volume (Units) Analysis By Region, 2019-2023
- 9.3. Current Market Size Value (US$ Mn) & Volume (Units) Analysis and Forecast By Region, 2024-2031
- 9.3.1. North America
- 9.3.2. Latin America
- 9.3.3. Europe
- 9.3.4. Asia Pacific
- 9.3.5. MEA
- 9.4. Market Attractiveness Analysis By Region
10. North America Direct Energy Weapons Market Analysis 2019-2023 and Forecast 2024-2031, By Country
- 10.1. Historical Market Size Value (US$ Mn) & Volume (Units) Trend Analysis By Market Taxonomy, 2019-2023
- 10.2. Market Size Value (US$ Mn) & Volume (Units) Forecast By Market Taxonomy, 2024-2031
- 10.2.1. By Country
- 10.2.1.1. U.S.
- 10.2.1.2. Canada
- 10.2.2. By Technology
- 10.2.3. By Range
- 10.2.4. By Application
- 10.2.5. By Platform
- 10.2.1. By Country
- 10.3. Market Attractiveness Analysis
- 10.3.1. By Country
- 10.3.2. By Technology
- 10.3.3. By Range
- 10.3.4. By Application
- 10.3.5. By Platform
- 10.4. Key Takeaways
11. Latin America Direct Energy Weapons Market Analysis 2019-2023 and Forecast 2024-2031, By Country
- 11.1. Historical Market Size Value (US$ Mn) & Volume (Units) Trend Analysis By Market Taxonomy, 2019-2023
- 11.2. Market Size Value (US$ Mn) & Volume (Units) Forecast By Market Taxonomy, 2024-2031
- 11.2.1. By Country
- 11.2.1.1. Brazil
- 11.2.1.2. Mexico
- 11.2.1.3. Rest of Latin America
- 11.2.2. By Technology
- 11.2.3. By Range
- 11.2.4. By Application
- 11.2.5. By Platform
- 11.2.1. By Country
- 11.3. Market Attractiveness Analysis
- 11.3.1. By Country
- 11.3.2. By Technology
- 11.3.3. By Range
- 11.3.4. By Application
- 11.3.5. By Platform
- 11.4. Key Takeaways
12. Europe Direct Energy Weapons Market Analysis 2019-2023 and Forecast 2024-2031, By Country
- 12.1. Historical Market Size Value (US$ Mn) & Volume (Units) Trend Analysis By Market Taxonomy, 2019-2023
- 12.2. Market Size Value (US$ Mn) & Volume (Units) Forecast By Market Taxonomy, 2024-2031
- 12.2.1. By Country
- 12.2.1.1. Germany
- 12.2.1.2. U.K.
- 12.2.1.3. France
- 12.2.1.4. Spain
- 12.2.1.5. Italy
- 12.2.1.6. Rest of Europe
- 12.2.2. By Technology
- 12.2.3. By Range
- 12.2.4. By Application
- 12.2.5. By Platform
- 12.2.1. By Country
- 12.3. Market Attractiveness Analysis
- 12.3.1. By Country
- 12.3.2. By Technology
- 12.3.3. By Range
- 12.3.4. By Application
- 12.3.5. By Platform
- 12.4. Key Takeaways
13. Asia Pacific Direct Energy Weapons Market Analysis 2019-2023 and Forecast 2024-2031, By Country
- 13.1. Historical Market Size Value (US$ Mn) & Volume (Units) Trend Analysis By Market Taxonomy, 2019-2023
- 13.2. Market Size Value (US$ Mn) & Volume (Units) Forecast By Market Taxonomy, 2024-2031
- 13.2.1. By Country
- 13.2.1.1. China
- 13.2.1.2. Japan
- 13.2.1.3. South Korea
- 13.2.1.4. Singapore
- 13.2.1.5. Thailand
- 13.2.1.6. Indonesia
- 13.2.1.7. Australia
- 13.2.1.8. New Zealand
- 13.2.1.9. Rest of Asia Pacific
- 13.2.2. By Technology
- 13.2.3. By Range
- 13.2.4. By Application
- 13.2.5. By Platform
- 13.2.1. By Country
- 13.3. Market Attractiveness Analysis
- 13.3.1. By Country
- 13.3.2. By Technology
- 13.3.3. By Range
- 13.3.4. By Application
- 13.3.5. By Platform
- 13.4. Key Takeaways
14. MEA Direct Energy Weapons Market Analysis 2019-2023 and Forecast 2024-2031, By Country
- 14.1. Historical Market Size Value (US$ Mn) & Volume (Units) Trend Analysis By Market Taxonomy, 2019-2023
- 14.2. Market Size Value (US$ Mn) & Volume (Units) Forecast By Market Taxonomy, 2024-2031
- 14.2.1. By Country
- 14.2.1.1. GCC Countries
- 14.2.1.2. South Africa
- 14.2.1.3. Israel
- 14.2.1.4. Rest of MEA
- 14.2.2. By Technology
- 14.2.3. By Range
- 14.2.4. By Application
- 14.2.5. By Platform
- 14.2.1. By Country
- 14.3. Market Attractiveness Analysis
- 14.3.1. By Country
- 14.3.2. By Technology
- 14.3.3. By Range
- 14.3.4. By Application
- 14.3.5. By Platform
- 14.4. Key Takeaways
15. Key Countries Direct Energy Weapons Market Analysis
- 15.1. U.S.
- 15.1.1. Pricing Analysis
- 15.1.2. Market Share Analysis, 2024
- 15.1.2.1. By Technology
- 15.1.2.2. By Range
- 15.1.2.3. By Application
- 15.1.2.4. By Platform
- 15.2. Canada
- 15.2.1. Pricing Analysis
- 15.2.2. Market Share Analysis, 2024
- 15.2.2.1. By Technology
- 15.2.2.2. By Range
- 15.2.2.3. By Application
- 15.2.2.4. By Platform
- 15.3. Brazil
- 15.3.1. Pricing Analysis
- 15.3.2. Market Share Analysis, 2024
- 15.3.2.1. By Technology
- 15.3.2.2. By Range
- 15.3.2.3. By Application
- 15.3.2.4. By Platform
- 15.4. Mexico
- 15.4.1. Pricing Analysis
- 15.4.2. Market Share Analysis, 2024
- 15.4.2.1. By Technology
- 15.4.2.2. By Range
- 15.4.2.3. By Application
- 15.4.2.4. By Platform
- 15.5. Germany
- 15.5.1. Pricing Analysis
- 15.5.2. Market Share Analysis, 2024
- 15.5.2.1. By Technology
- 15.5.2.2. By Range
- 15.5.2.3. By Application
- 15.5.2.4. By Platform
- 15.6. U.K.
- 15.6.1. Pricing Analysis
- 15.6.2. Market Share Analysis, 2024
- 15.6.2.1. By Technology
- 15.6.2.2. By Range
- 15.6.2.3. By Application
- 15.6.2.4. By Platform
- 15.7. France
- 15.7.1. Pricing Analysis
- 15.7.2. Market Share Analysis, 2024
- 15.7.2.1. By Technology
- 15.7.2.2. By Range
- 15.7.2.3. By Application
- 15.7.2.4. By Platform
- 15.8. Spain
- 15.8.1. Pricing Analysis
- 15.8.2. Market Share Analysis, 2024
- 15.8.2.1. By Technology
- 15.8.2.2. By Range
- 15.8.2.3. By Application
- 15.8.2.4. By Platform
- 15.9. Italy
- 15.9.1. Pricing Analysis
- 15.9.2. Market Share Analysis, 2024
- 15.9.2.1. By Technology
- 15.9.2.2. By Range
- 15.9.2.3. By Application
- 15.9.2.4. By Platform
- 15.10. China
- 15.10.1. Pricing Analysis
- 15.10.2. Market Share Analysis, 2024
- 15.10.2.1. By Technology
- 15.10.2.2. By Range
- 15.10.2.3. By Application
- 15.10.2.4. By Platform
- 15.11. Japan
- 15.11.1. Pricing Analysis
- 15.11.2. Market Share Analysis, 2024
- 15.11.2.1. By Technology
- 15.11.2.2. By Range
- 15.11.2.3. By Application
- 15.11.2.4. By Platform
- 15.12. South Korea
- 15.12.1. Pricing Analysis
- 15.12.2. Market Share Analysis, 2024
- 15.12.2.1. By Technology
- 15.12.2.2. By Range
- 15.12.2.3. By Application
- 15.12.2.4. By Platform
- 15.13. Singapore
- 15.13.1. Pricing Analysis
- 15.13.2. Market Share Analysis, 2024
- 15.13.2.1. By Technology
- 15.13.2.2. By Range
- 15.13.2.3. By Application
- 15.13.2.4. By Platform
- 15.14. Thailand
- 15.14.1. Pricing Analysis
- 15.14.2. Market Share Analysis, 2024
- 15.14.2.1. By Technology
- 15.14.2.2. By Range
- 15.14.2.3. By Application
- 15.14.2.4. By Platform
- 15.15. Indonesia
- 15.15.1. Pricing Analysis
- 15.15.2. Market Share Analysis, 2024
- 15.15.2.1. By Technology
- 15.15.2.2. By Range
- 15.15.2.3. By Application
- 15.15.2.4. By Platform
- 15.16. Australia
- 15.16.1. Pricing Analysis
- 15.16.2. Market Share Analysis, 2024
- 15.16.2.1. By Technology
- 15.16.2.2. By Range
- 15.16.2.3. By Application
- 15.16.2.4. By Platform
- 15.17. New Zealand
- 15.17.1. Pricing Analysis
- 15.17.2. Market Share Analysis, 2024
- 15.17.2.1. By Technology
- 15.17.2.2. By Range
- 15.17.2.3. By Application
- 15.17.2.4. By Platform
- 15.18. GCC Countries
- 15.18.1. Pricing Analysis
- 15.18.2. Market Share Analysis, 2024
- 15.18.2.1. By Technology
- 15.18.2.2. By Range
- 15.18.2.3. By Application
- 15.18.2.4. By Platform
- 15.19. South Africa
- 15.19.1. Pricing Analysis
- 15.19.2. Market Share Analysis, 2024
- 15.19.2.1. By Technology
- 15.19.2.2. By Range
- 15.19.2.3. By Application
- 15.19.2.4. By Platform
- 15.20. Israel
- 15.20.1. Pricing Analysis
- 15.20.2. Market Share Analysis, 2024
- 15.20.2.1. By Technology
- 15.20.2.2. By Range
- 15.20.2.3. By Application
- 15.20.2.4. By Platform
16. Market Structure Analysis
- 16.1. Competition Dashboard
- 16.2. Competition Benchmarking
- 16.3. Market Share Analysis of Top Players
- 16.3.1. By Regional
- 16.3.2. By Technology
- 16.3.3. By Range
- 16.3.4. By Application
- 16.3.5. By Platform
17. Competition Analysis
- 17.1. Competition Deep Dive
- 17.1.1. Lockheed Martin Corporation
- 17.1.1.1. Overview
- 17.1.1.2. Product Portfolio
- 17.1.1.3. Profitability by Market Segments
- 17.1.1.4. Sales Footprint
- 17.1.1.5. Strategy Overview
- 17.1.1.5.1. Marketing Strategy
- 17.1.1.5.2. Product Strategy
- 17.1.1.5.3. Channel Strategy
- 17.1.2. Thales Group
- 17.1.2.1. Overview
- 17.1.2.2. Product Portfolio
- 17.1.2.3. Profitability by Market Segments
- 17.1.2.4. Sales Footprint
- 17.1.2.5. Strategy Overview
- 17.1.2.5.1. Marketing Strategy
- 17.1.2.5.2. Product Strategy
- 17.1.2.5.3. Channel Strategy
- 17.1.3. L3Harris Technologies, Inc.
- 17.1.3.1. Overview
- 17.1.3.2. Product Portfolio
- 17.1.3.3. Profitability by Market Segments
- 17.1.3.4. Sales Footprint
- 17.1.3.5. Strategy Overview
- 17.1.3.5.1. Marketing Strategy
- 17.1.3.5.2. Product Strategy
- 17.1.3.5.3. Channel Strategy
- 17.1.4. Elbit Systems Ltd.
- 17.1.4.1. Overview
- 17.1.4.2. Product Portfolio
- 17.1.4.3. Profitability by Market Segments
- 17.1.4.4. Sales Footprint
- 17.1.4.5. Strategy Overview
- 17.1.4.5.1. Marketing Strategy
- 17.1.4.5.2. Product Strategy
- 17.1.4.5.3. Channel Strategy
- 17.1.5. Raytheon Technologies Corporation
- 17.1.5.1. Overview
- 17.1.5.2. Product Portfolio
- 17.1.5.3. Profitability by Market Segments
- 17.1.5.4. Sales Footprint
- 17.1.5.5. Strategy Overview
- 17.1.5.5.1. Marketing Strategy
- 17.1.5.5.2. Product Strategy
- 17.1.5.5.3. Channel Strategy
- 17.1.6. BAE Systems
- 17.1.6.1. Overview
- 17.1.6.2. Product Portfolio
- 17.1.6.3. Profitability by Market Segments
- 17.1.6.4. Sales Footprint
- 17.1.6.5. Strategy Overview
- 17.1.6.5.1. Marketing Strategy
- 17.1.6.5.2. Product Strategy
- 17.1.6.5.3. Channel Strategy
- 17.1.7. Honeywell International Inc.
- 17.1.7.1. Overview
- 17.1.7.2. Product Portfolio
- 17.1.7.3. Profitability by Market Segments
- 17.1.7.4. Sales Footprint
- 17.1.7.5. Strategy Overview
- 17.1.7.5.1. Marketing Strategy
- 17.1.7.5.2. Product Strategy
- 17.1.7.5.3. Channel Strategy
- 17.1.8. Rheinmetall AG
- 17.1.8.1. Overview
- 17.1.8.2. Product Portfolio
- 17.1.8.3. Profitability by Market Segments
- 17.1.8.4. Sales Footprint
- 17.1.8.5. Strategy Overview
- 17.1.8.5.1. Marketing Strategy
- 17.1.8.5.2. Product Strategy
- 17.1.8.5.3. Channel Strategy
- 17.1.9. Moog, Inc.
- 17.1.9.1. Overview
- 17.1.9.2. Product Portfolio
- 17.1.9.3. Profitability by Market Segments
- 17.1.9.4. Sales Footprint
- 17.1.9.5. Strategy Overview
- 17.1.9.5.1. Marketing Strategy
- 17.1.9.5.2. Product Strategy
- 17.1.9.5.3. Channel Strategy
- 17.1.10. Boeing
- 17.1.10.1. Overview
- 17.1.10.2. Product Portfolio
- 17.1.10.3. Profitability by Market Segments
- 17.1.10.4. Sales Footprint
- 17.1.10.5. Strategy Overview
- 17.1.10.5.1. Marketing Strategy
- 17.1.10.5.2. Product Strategy
- 17.1.10.5.3. Channel Strategy
- 17.1.1. Lockheed Martin Corporation
