|
|
市場調査レポート
商品コード
1477983
3Dプリント金属市場:製品タイプ別、エンドユーザー別、地域別 - 世界の産業分析、規模、シェア、成長、動向、予測、2024年~2032年3D Printing Metal Market by Product Type, End-Users, and Geography (North America, Europe, Asia Pacific, Latin America, and the Middle East and Africa): Global Industry Analysis, Size, Share, Growth, Trends, and Forecast, 2024-2032 |
||||||

|
|||||||
カスタマイズ可能
|
|||||||

| 3Dプリント金属市場:製品タイプ別、エンドユーザー別、地域別 - 世界の産業分析、規模、シェア、成長、動向、予測、2024年~2032年 |
|
出版日: 2024年05月03日
発行: Persistence Market Research
ページ情報: 英文 230 Pages
納期: 2~5営業日
|

全表示
- 概要
- 目次
Persistence Market Research社の3Dプリント金属市場レポートでは、2024年から2032年までの市場力学、成長要因、課題、新興動向を詳細に分析しています。3Dプリント金属市場の現状と将来展望に関する洞察を提供します。
世界の3Dプリント金属市場は、2024年の4億2,290万米ドルから2032年には29億5,000万米ドルまで、CAGR21.4%で成長すると予測されています。
主な洞察
- 推定市場規模(2024年):4億2,290万米ドル
- 予測市場規模(2032年)29億5,000万米ドル
- 世界市場成長率(CAGR 2024年~2032年):21.4%
3Dプリント金属市場 - 調査範囲:
金属の3Dプリントは、レーザーまたは電子ビームをベースとした技術により、金属粉末を層ごとに溶融して固体部品にします。本レポートでは、航空宇宙、自動車、医療産業における用途の増加や、3Dプリント技術の進歩など、市場需要の主な促進要因に焦点を当てています。
市場促進要因:
航空宇宙分野では複雑なエンジン部品や軽量構造の製造に、自動車分野ではラピッドプロトタイピングや生産に、ヘルスケア分野ではカスタムインプラントや手術器具の製造に、3D金属プリントの利用が拡大していることが市場を牽引しています。さらに、金属粉末技術の進歩やプリントプロセスにおける機械学習の強化が市場を大きく押し上げます。
市場抑制要因:
堅調な成長にもかかわらず、市場は、金属の3Dプリントに関連する高コスト、金属粉末の限られた入手可能性、後処理の必要性などの課題に直面しています。さらに、プリント部品の最適な強度と精度を達成するための技術的な複雑さが、一部の産業での採用を制限する可能性があります。
市場機会:
3Dプリント金属市場の機会には、特定の産業用途向けに特性を強化した新しい改良型金属粉末の開発が含まれます。産業の成長と研究開発投資の増加による新興諸国での市場開拓は、大きな市場の可能性を示しています。さらに、インダストリー4.0やデジタル製造との統合は、生産プロセスや効率に革命をもたらす可能性があります。
本レポートで扱う主な質問
- 2024年から2032年までの3Dプリント金属市場の予想CAGRは?
- 3Dプリント金属市場の成長を促進する主な要因は何か?
- 3Dプリント金属市場で最大の市場シェアを占める金属タイプは?
- 世界の3Dプリント金属市場の主要企業は?
- 3Dプリント金属市場で競合を維持するために、主要企業はどのような戦略を採用しているか?
目次
第1章 エグゼクティブサマリー
第2章 市場概要
- 市場範囲/ 分類
- 市場の定義/ 範囲/ 制限
- 製品仕様:材料別
第3章 主要な市場動向
- 市場に影響を与える主な動向
- 製品イノベーション/開発動向
第4章 主要な成功要因
- 製品の採用/使用状況分析
- 製品のUSP/特徴
- 戦略的プロモーション戦略
第5章 世界市場の需要分析
- 過去の市場数量分析(2019年~2023年)
- 現在および将来の市場数量予測(2024年~2032年)
- 前年比成長動向分析
第6章 世界市場 - 価格分析
- 地域価格分析:材料別
- 世界平均価格分析ベンチマーク
- コスト分解分析
- 価格への影響要因
第7章 世界市場の需要分析
- 過去の市場価値分析(2019年~2023年)
- 現在および将来の市場価値予測(2024年~2032年)
- 前年比成長動向分析
- 絶対額の機会分析
第8章 市場背景
- マクロ経済要因
- 予測要因 - 関連性と影響
- 市場力学
- バリューチェーン分析
- 生産工程の展望
- 主な規制と認証
- COVID-19危機 - 影響評価
- 主な発展
- 世界需給分析
- 交差分析
- ポーターのファイブフォース分析
第9章 世界市場分析:材料別
- イントロダクション/主な調査結果
- 過去の市場規模と数量分析:材料別(2019年~2023年)
- 現在および将来の市場規模と数量の分析と予測:材料別(2024年~2032年)
- 金属粉末
- 金属合金粉末
- 材料別の市場魅力度分析
第10章 世界市場分析:形状別
- イントロダクション/主な調査結果
- 過去の市場規模と数量分析:形状別(2019年~2023年)
- 現在および将来の市場規模と数量の分析および予測:形状別(2024年~2032年)
- 非球状粉末
- 球状粉末
- 形状別の市場魅力度分析
第11章 世界市場分析:最終用途別
- イントロダクション/主な調査結果
- 過去の市場規模と数量分析:最終用途別(2019年~2023年)
- 現在および将来の市場規模と数量の分析および予測:最終用途別(2024年~2032年)
- 医療
- 航空宇宙
- 自動車・輸送
- 電力とエネルギー
- エレクトロニクス
- 産業機器
- 教育と調査
- その他
- 最終用途別の市場魅力度分析
第12章 世界市場分析:生産工程別
- イントロダクション/主な調査結果
- 過去の市場規模と数量分析:生産工程別(2019年~2023年)
- 現在および将来の市場規模と数量の分析および予測:生産工程別(2024年~2032年)
- パウダーベッドフュージョン
- 直接エネルギー蓄積
- マテリアルジェッティング
- バインダージェッティング
- 材料押し出し
- 光重合
- 電子ビーム溶解
- 直接金属レーザー焼結
- 生産工程別の市場魅力度分析
第13章 世界市場分析:地域別
- イントロダクション
- 過去の市場規模と数量分析:地域別(2019年~2023年)
- 現在および将来の市場規模と数量の分析および予測:地域別(2024年~2032年)
- 北米
- ラテンアメリカ
- 欧州
- 東アジア
- 南アジア・太平洋
- 中東・アフリカ
- 地域別市場魅力度分析
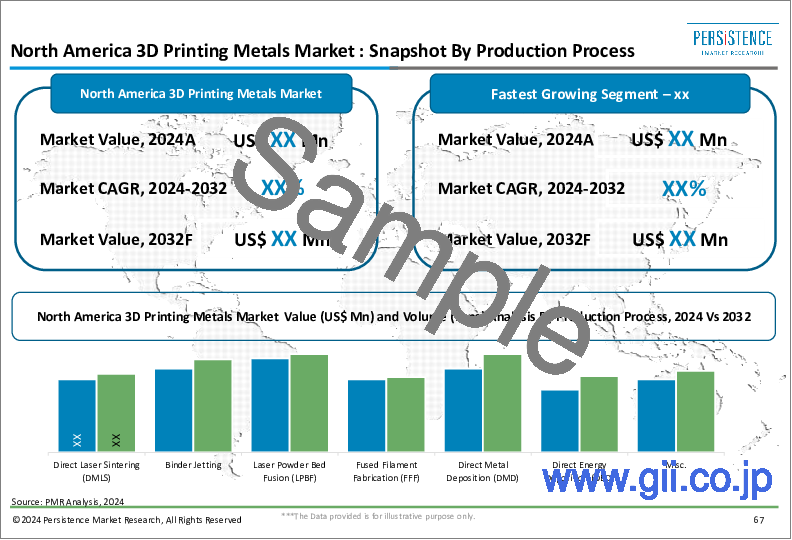
第14章 北米の市場分析
第15章 ラテンアメリカの市場分析
第16章 欧州の市場分析
第17章 南アジア・太平洋地域の市場分析
第18章 東アジアの市場分析
第19章 中東・アフリカの市場分析
第20章 南アフリカの市場分析
第21章 国別の市場分析(2024年~2032年)
- 米国
- カナダ
- メキシコ
- ブラジル
- ドイツ
- イタリア
- フランス
- 英国
- スペイン
- ロシア
- 中国
- 日本
- 韓国
- インド
- ASEAN
- オーストラリアとニュージーランド
- GCC諸国
- トルコ
第22章 市場構造分析
- 企業階層別の市場分析(積層造形用金属粉末および合金)
- 主要企業の市場シェア分析
- 見かけの生産能力
- 市場プレゼンス分析
第23章 競合分析
- 競合ダッシュボード
- 競合ベンチマーク
- 競合の詳細
- Sandvik AB
- ATI Powder Metals
- Advanced Metallurgical Group
- Rio Tinto
- American Axle &Manufacturing, Inc.
- Carpenter Powered Products
- Showa Denko Materials
- GKN PLC
- Praxair Surface Technologies Inc.
- Aubert &Duval
- Hoganas AB
- voestalpine BOHLER Edelstahl GmbH &Co KG
- Royal Metal Powders
- Australian Metal Powders Supplies Pty Ltd.
- CNPC Powder Group Co., Ltd.
- Renishaw
- Materialise NV
- Stratasys Ltd.
- Optomec, Inc
- 3D Systems Corporation
- Arcam AB
第24章 前提と頭字語
第25章 調査手法
The 3D Printing Metal Market report by Persistence Market Research offers an in-depth analysis of market dynamics, growth factors, challenges, and emerging trends from the period 2024 to 2032. It delivers insights into the current state and future prospects of the 3D Printing Metal Market.
The global 3D printing metal market is projected to grow at a compound annual growth rate (CAGR) of 21.4% from USD 422.9 million in 2024 to USD 2950 million by 2032.
Key Insights:
- Estimated Market Size (2024): USD 422.9 Million
- Projected Market Size (2032): USD 2950 Million
- Global Market Growth Rate (CAGR 2024 to 2032): 21.4%
3D Printing Metal Market - Report Scope:
3D printing with metals involves laser or electron beam based techniques to melt metal powders layer by layer into solid parts. This report focuses on key drivers for the market's demand such as increasing applications in aerospace, automotive, and medical industries, and the ongoing advancements in 3D printing technologies.
Market Growth Drivers:
The market is driven by the expanding use of 3D metal printing in aerospace for manufacturing complex engine components and lightweight structures, in automotive for rapid prototyping and production, and in healthcare for custom implants and surgical instruments. Additionally, advancements in metal powder technologies and machine learning enhancements in print processes significantly push the market forward.
Market Restraints:
Despite robust growth, the market faces challenges such as high costs associated with 3D printing metals, limited availability of metal powders, and the need for post-processing. Furthermore, technical complexities in achieving optimal strength and precision in printed parts may restrict the adoption across some industries.
Market Opportunities:
Opportunities in the 3D Printing Metal Market include development of new and improved metal powders with enhanced properties for specific industry applications. Expansion in developing countries, driven by industrial growth and increased R&D investments, presents substantial market potential. Additionally, integration with Industry 4.0 and digital manufacturing could revolutionize production processes and efficiency.
Key Questions Addressed in the Report:
- What is the Expected CAGR of the 3D Printing Metal Market from 2024 to 2032?
- What are the Key Factors Driving the Growth of the 3D Printing Metal Market?
- Which Metal Type Holds the Largest Market Share in the 3D Printing Metal Market?
- Who are the Key Players in the Global 3D Printing Metal Market?
- What Strategies are Adopted by Leading Companies to Stay Competitive in the 3D Printing Metal Market?
Competitive Landscape and Business Strategies:
Prominent players in the 3D Printing Metal Market include 3D Systems Corporation, EOS GmbH, GE Additive, and Stratasys Ltd. These companies focus on continuous innovation, strategic partnerships, and expanding their product offerings to maintain competitiveness. For instance, EOS GmbH offers a range of metal printing solutions that are leading in precision and scalability.
Key Companies Profiled:
- Sandvik AB
- ATI Powder Metals
- Advanced Metallurgical Group
- Rio Tinto
- American Axle & Manufacturing, Inc.
- Carpenter Powered Products
- Showa Denko Materials
- GKN PLC
- Praxair Surface Technologies Inc.
- Aubert & Duval
- Hoganas AB
- voestalpine BOHLER Edelstahl GmbH & Co KG
- Royal Metal Powders
- Australian Metal Powders Supplies Pty Ltd.
- CNPC Powder Group Co., Ltd.
- Renishaw
- Materialise NV
- Stratasys Ltd.
- Optomec, Inc
- 3D Systems Corporation
- Arcam AB
3D Printing Metal Market Segmentation:
3D Printing Metal Industry Research Segmentation
By Material:
- Metal Powder
Aluminum
Copper
Iron
Molybdenum
Nickel
Tungsten
Titanium
Others
- Metal Alloy Powder
Steel
Stainless Steel
Ni-Based
Cu-Based
Ti-Based
Others
By Shape:
Spherical
Non-Spherical
By Production Process:
Powder Bed Fusion
Directed Energy Deposition
Material Jetting
Binder Jetting
Metal Extrusion
Photo Polymerization
By End Use:
- Medical
Orthopedic Implant Devices
Dental Devices
Pre-surgery Models
General Tools
Prosthetics
Anatomical Models
Others
- Aerospace
ECS Ducting
Rocket Engine Components
Combustor Liners
Oil & Fuel Tanks
UAV Components
Others
- Automotive
Complex Ducts
Resilient Prototypes
Elastomeric Models
Grilles
Large Paneling
Others
- Electronics
Antennae
Interconnects
Capacitors
Radio Frequency Components
Sensors
Others
- Energy
Rotors and Stators
Turbine Nozzles
Down-hole Tool Components
Others
Industrial Equipment
Education and Research
Others
By Region:
- North America
- Latin America
- Europe
- East Asia
- South Asia & Pacific
- Middle East & Africa
Table of Contents
1. Executive Summary
- 1.1. Global Market Outlook
- 1.2. Demand Side Trends
- 1.3. Supply Side Trends
- 1.4. Technology Roadmap
- 1.5. Analysis and Recommendations
2. Market Overview
- 2.1. Market Coverage / Taxonomy
- 2.2. Market Definition / Scope / Limitations
- 2.3. Product Specifications by Material
3. Key Market Trends
- 3.1. Key Trends Impacting the Market
- 3.2. Product Innovation / Development Trends
4. Key Success Factors
- 4.1. Product Adoption / Usage Analysis
- 4.2. Product USPs / Features
- 4.3. Strategic Promotional Strategies
5. Global Market Demand Analysis 2019-2023 and Forecast, 2024-2032
- 5.1. Historical Market Volume (Tons) Analysis, 2019-2023
- 5.2. Current and Future Market Volume (Tons) Projections, 2024-2032
- 5.3. Y-o-Y Growth Trend Analysis
6. Global Market - Pricing Analysis
- 6.1. Regional Pricing Analysis By Material
- 6.2. Global Average Pricing Analysis Benchmark
- 6.3. Cost Teardown Analysis
- 6.4. Pricing Impact Factors
7. Global Market Demand (in Value or Size in US$ Mn) Analysis 2019-2023 and Forecast, 2024-2032
- 7.1. Historical Market Value (US$ Mn) Analysis, 2019-2023
- 7.2. Current and Future Market Value (US$ Mn) Projections, 2024-2032
- 7.2.1. Y-o-Y Growth Trend Analysis
- 7.2.2. Absolute $ Opportunity Analysis
8. Market Background
- 8.1. Macro-Economic Factors
- 8.1.1. Real GDP growth Outlook
- 8.1.2. Industry Value Added by Key Countries
- 8.1.3. Global Oil & Gas Consumption Forecast Outlook
- 8.1.4. Manufacturing Value Added by Key Countries
- 8.1.5. Construction Industry Outlook
- 8.1.6. Global Automotive Sector Outlook
- 8.1.7. Global Automotive Fleet On Road Outlook By Region
- 8.1.8. Parent Market Overview
- 8.1.9. Global Consumer Electronics Industry Overview
- 8.1.10. Global Electricity generation (TWh)
- 8.2. Forecast Factors - Relevance & Impact
- 8.2.1. GDP Growth
- 8.2.2. Industrial Growth
- 8.2.3. Increasing Vehicle Parc
- 8.2.4. Growing Aircraft Fleet
- 8.2.5. Industry Capacity and Production
- 8.2.6. R&D Spending
- 8.2.7. Oil and Gas Sector Growth
- 8.2.8. Technological Advancements
- 8.2.9. Cost of Materials
- 8.2.10. Increasing Export of Aerospace Products
- 8.2.11. Construction Industry Growth
- 8.2.12. Reducing Lead Time of Production
- 8.2.13. Demand From Medical Industry
- 8.2.14. Construction Industry Growth
- 8.2.15. Business Climate
- 8.3. Market Dynamics
- 8.3.1. Drivers
- 8.3.2. Restraints
- 8.3.3. Opportunity Analysis
- 8.4. Value Chain Analysis
- 8.4.1. List of Distributors
- 8.4.2. Product Manufacturers
- 8.4.3. Probable End Users
- 8.5. Production Process Outlook
- 8.6. Key Regulations & Certifications
- 8.7. COVID-19 Crisis - Impact Assessment
- 8.7.1. Current Statistics
- 8.7.2. Short-Mid-Long Term Outlook
- 8.7.3. Likely Rebound
- 8.8. Key Developments
- 8.9. Global Supply Demand Analysis
- 8.10. Criss-cross Analysis
- 8.11. Porter's Five Forces Analysis
9. Global Market Analysis 2019-2023 and Forecast 2024-2032, By Material
- 9.1. Introduction / Key Findings
- 9.2. Historical Market Size (US$ Mn) and Volume Analysis By Material, 2019-2023
- 9.3. Current and Future Market Size (US$ Mn) and Volume Analysis and Forecast By Material, 2024-2032
- 9.3.1. Metal Powder
- 9.3.1.1. Titanium
- 9.3.1.2. Aluminum
- 9.3.1.3. Copper
- 9.3.1.4. Nickel
- 9.3.1.5. Precious Metal
- 9.3.2. Metal Alloy Powder
- 9.3.2.1. Steel
- 9.3.2.2. Stainless Steel
- 9.3.2.3. Ni-based Superalloys
- 9.3.2.4. Copper Based Alloys
- 9.3.2.5. Titanium Based Alloys
- 9.3.2.6. Others
- 9.3.1. Metal Powder
- 9.4. Market Attractiveness Analysis By Material
10. Global Market Analysis 2019-2023 and Forecast 2024-2032, By Shape
- 10.1. Introduction / Key Findings
- 10.2. Historical Market Size (US$ Mn) and Volume Analysis By Shape, 2019-2023
- 10.3. Current and Future Market Size (US$ Mn) and Volume Analysis and Forecast By Shape, 2024-2032
- 10.3.1. Non-spherical Powders
- 10.3.2. Spherical Powders
- 10.4. Market Attractiveness Analysis By Shape
11. Global Market Analysis 2019-2023 and Forecast 2024-2032, By End Use
- 11.1. Introduction / Key Findings
- 11.2. Historical Market Size (US$ Mn) and Volume Analysis By End Use, 2019-2023
- 11.3. Current and Future Market Size (US$ Mn) and Volume Analysis and Forecast By End Use, 2024-2032
- 11.3.1. Medical
- 11.3.1.1. Orthopedic Implant Devices
- 11.3.1.2. Dental Devices
- 11.3.1.3. Pre-surgery Models
- 11.3.1.4. General Tools
- 11.3.1.5. Prosthetics
- 11.3.1.6. Anatomical Models
- 11.3.1.7. Others
- 11.3.2. Aerospace
- 11.3.2.1. Environmental Control Systems Ducting
- 11.3.2.2. Rocket Engine End Use
- 11.3.2.3. Combustor Liners
- 11.3.2.4. Oil & Fuel Tanks
- 11.3.2.5. UAV End Use
- 11.3.3. Automotive & Transportation
- 11.3.3.1. Complex Duct
- 11.3.3.2. Resilient Prototypes
- 11.3.3.3. Elastomeric Models
- 11.3.3.4. Grilles
- 11.3.3.5. Large Paneling
- 11.3.4. Power & Energy
- 11.3.4.1. Rotors & Stators
- 11.3.4.2. Turbine Nozzles
- 11.3.4.3. Down-hole Tool End Use
- 11.3.4.4. Others
- 11.3.5. Electronics
- 11.3.5.1. Antennae
- 11.3.5.2. Interconnects
- 11.3.5.3. Capacitors
- 11.3.5.4. Radio Frequency End Use
- 11.3.5.5. Sensors
- 11.3.5.6. Others
- 11.3.6. Industrial Equipment
- 11.3.7. Education and Research
- 11.3.8. Others
- 11.3.1. Medical
- 11.4. Market Attractiveness Analysis By End Use
12. Global Market Analysis 2019-2023 and Forecast 2024-2032, By Production Process
- 12.1. Introduction / Key Findings
- 12.2. Historical Market Size (US$ Mn) and Volume Analysis By Production Process, 2019-2023
- 12.3. Current and Future Market Size (US$ Mn) and Volume Analysis and Forecast By Production Process, 2024-2032
- 12.3.1. Powder Bed Fusion
- 12.3.2. Direct Energy Deposition
- 12.3.3. Material Jetting
- 12.3.4. Binder Jetting
- 12.3.5. Material Extrusion
- 12.3.6. Photo Polymerization
- 12.3.7. Electron Beam Melting
- 12.3.8. Direct Metal Laser Sintering
- 12.4. Market Attractiveness Analysis By Production Process
13. Global Market Analysis 2019-2023 and Forecast 2024-2032, by Region
- 13.1. Introduction
- 13.2. Historical Market Size (US$ Mn) and Volume Analysis By Region, 2019-2023
- 13.3. Current Market Size (US$ Mn) and Volume Analysis and Forecast By Region, 2024-2032
- 13.3.1. North America
- 13.3.2. Latin America
- 13.3.3. Europe
- 13.3.4. East Asia
- 13.3.5. South Asia and Pacific
- 13.3.6. Middle East & Africa
- 13.4. Market Attractiveness Analysis By Region
14. North America Market Analysis 2019-2023 and Forecast 2024-2032
- 14.1. Introduction
- 14.2. Pricing Analysis
- 14.3. Historical Market Size (US$ Mn) and Volume Trend Analysis By Market Taxonomy, 2019-2023
- 14.4. Market Size (US$ Mn) and Volume Forecast By Market Taxonomy, 2024-2032
- 14.4.1. By Country
- 14.4.1.1. U.S.
- 14.4.1.2. Canada
- 14.4.2. By Material
- 14.4.3. By Shape
- 14.4.4. By End Use
- 14.4.5. By Production Process
- 14.4.1. By Country
- 14.5. Market Attractiveness Analysis
- 14.5.1. By Country
- 14.5.2. By Material
- 14.5.3. By Shape
- 14.5.4. By End Use
- 14.5.5. By Production Process
- 14.6. Market Trends
- 14.7. Key Market Participants - Intensity Mapping
- 14.8. Drivers and Restraints - Impact Analysis
15. Latin America Market Analysis 2019-2023 and Forecast 2024-2032
- 15.1. Introduction
- 15.2. Pricing Analysis
- 15.3. Historical Market Size (US$ Mn) and Volume Trend Analysis By Market Taxonomy, 2019-2023
- 15.4. Market Size (US$ Mn) and Volume Forecast By Market Taxonomy, 2024-2032
- 15.4.1. By Country
- 15.4.1.1. Brazil
- 15.4.1.2. Mexico
- 15.4.1.3. Rest of Latin America
- 15.4.2. By Material
- 15.4.3. By Shape
- 15.4.4. By End Use
- 15.4.5. By Production Process
- 15.4.1. By Country
- 15.5. Market Attractiveness Analysis
- 15.5.1. By Country
- 15.5.2. By Material
- 15.5.3. By Shape
- 15.5.4. By End Use
- 15.5.5. By Production Process
- 15.6. Market Trends
- 15.7. Key Market Participants - Intensity Mapping
- 15.8. Drivers and Restraints - Impact Analysis
16. Europe Market Analysis 2019-2023 and Forecast 2024-2032
- 16.1. Introduction
- 16.2. Pricing Analysis
- 16.3. Historical Market Size (US$ Mn) and Volume Trend Analysis By Market Taxonomy, 2019-2023
- 16.4. Market Size (US$ Mn) and Volume Forecast By Market Taxonomy, 2024-2032
- 16.4.1. By Country
- 16.4.1.1. Germany
- 16.4.1.2. Italy
- 16.4.1.3. France
- 16.4.1.4. U.K.
- 16.4.1.5. Spain
- 16.4.1.6. BENELUX
- 16.4.1.7. Russia
- 16.4.1.8. Rest of Europe
- 16.4.2. By Material
- 16.4.3. By Shape
- 16.4.4. By End Use
- 16.4.5. By Production Process
- 16.4.1. By Country
- 16.5. Market Attractiveness Analysis
- 16.5.1. By Country
- 16.5.2. By Material
- 16.5.3. By Shape
- 16.5.4. By End Use
- 16.5.5. By Production Process
- 16.6. Market Trends
- 16.7. Key Market Participants - Intensity Mapping
- 16.8. Drivers and Restraints - Impact Analysis
17. South Asia and Pacific Market Analysis 2019-2023 and Forecast 2024-2032
- 17.1. Introduction
- 17.2. Pricing Analysis
- 17.3. Historical Market Size (US$ Mn) and Volume Trend Analysis By Market Taxonomy, 2019-2023
- 17.4. Market Size (US$ Mn) and Volume Forecast By Market Taxonomy, 2024-2032
- 17.4.1. By Country
- 17.4.1.1. India
- 17.4.1.2. ASEAN
- 17.4.1.3. Oceania
- 17.4.1.4. Rest of South Asia & Pacific
- 17.4.2. By Material
- 17.4.3. By Shape
- 17.4.4. By End Use
- 17.4.5. By Production Process
- 17.4.1. By Country
- 17.5. Market Attractiveness Analysis
- 17.5.1. By Country
- 17.5.2. By Material
- 17.5.3. By Shape
- 17.5.4. By End Use
- 17.5.5. By Production Process
- 17.6. Market Trends
- 17.7. Key Market Participants - Intensity Mapping
- 17.8. Drivers and Restraints - Impact Analysis
18. East Asia Market Analysis 2019-2023 and Forecast 2024-2032
- 18.1. Introduction
- 18.2. Pricing Analysis
- 18.3. Historical Market Size (US$ Mn) and Volume Trend Analysis By Market Taxonomy, 2019-2023
- 18.4. Market Size (US$ Mn) and Volume Forecast By Market Taxonomy, 2024-2032
- 18.4.1. By Country
- 18.4.1.1. China
- 18.4.1.2. Japan
- 18.4.1.3. South Korea
- 18.4.2. By Material
- 18.4.3. By Shape
- 18.4.4. By End Use
- 18.4.5. By Production Process
- 18.4.1. By Country
- 18.5. Market Attractiveness Analysis
- 18.5.1. By Country
- 18.5.2. By Material
- 18.5.3. By Shape
- 18.5.4. By End Use
- 18.5.5. By Production Process
- 18.6. Market Trends
- 18.7. Key Market Participants - Intensity Mapping
- 18.8. Drivers and Restraints - Impact Analysis
19. Middle East and Africa Market Analysis 2019-2023 and Forecast 2024-2032
- 19.1. Introduction
- 19.2. Pricing Analysis
- 19.3. Historical Market Size (US$ Mn) and Volume Trend Analysis By Market Taxonomy, 2019-2023
- 19.4. Market Size (US$ Mn) and Volume Forecast By Market Taxonomy, 2024-2032
- 19.4.1. By Country
- 19.4.1.1. GCC Countries
- 19.4.1.2. Turkey
- 19.4.1.3. Northern Africa
- 19.4.1.4. Rest of Middle East and Africa
- 19.4.2. By Material
- 19.4.3. By Shape
- 19.4.4. By End Use
- 19.4.5. By Production Process
- 19.4.1. By Country
- 19.5. Market Attractiveness Analysis
- 19.5.1. By Country
- 19.5.2. By Material
- 19.5.3. By Shape
- 19.5.4. By End Use
- 19.5.5. By Production Process
- 19.6. Market Trends
- 19.7. Key Market Participants - Intensity Mapping
- 19.8. Drivers and Restraints - Impact Analysis
20. South Africa Market Analysis 2019-2023 and Forecast 2024-2032
- 20.1. Introduction
- 20.2. Pricing Analysis
- 20.3. Historical Market Size (US$ Th) and Volume Trend Analysis By Market Taxonomy, 2019-2023
- 20.4. Market Size (US$ Th) and Volume Forecast By Market Taxonomy, 2024-2032
- 20.4.1. By Material
- 20.4.2. By Shape
- 20.4.3. By End Use
- 20.4.4. By Production Process
- 20.5. Market Attractiveness Analysis
- 20.5.1. By Material
- 20.5.2. By Shape
- 20.5.3. By End Use
- 20.5.4. By Production Process
- 20.6. Market Trends
- 20.7. Key Market Participants - Intensity Mapping
- 20.8. Drivers and Restraints - Impact Analysis
21. Country Wise Market Analysis 2024-2032
- 21.1. U.S. Market Analysis
- 21.1.1. By Material
- 21.1.2. By Shape
- 21.1.3. By End Use
- 21.1.4. By Production Process
- 21.2. Canada Market Analysis
- 21.2.1. By Material
- 21.2.2. By Shape
- 21.2.3. By End Use
- 21.2.4. By Production Process
- 21.3. Mexico Market Analysis
- 21.3.1. By Material
- 21.3.2. By Shape
- 21.3.3. By End Use
- 21.3.4. By Production Process
- 21.4. Brazil Market Analysis
- 21.4.1. By Material
- 21.4.2. By Shape
- 21.4.3. By End Use
- 21.4.4. By Production Process
- 21.5. Germany Market Analysis
- 21.5.1. By Material
- 21.5.2. By Shape
- 21.5.3. By End Use
- 21.5.4. By Production Process
- 21.6. Italy Market Analysis
- 21.6.1. By Material
- 21.6.2. By Shape
- 21.6.3. By End Use
- 21.6.4. By Production Process
- 21.7. France Market Analysis
- 21.7.1. By Material
- 21.7.2. By Shape
- 21.7.3. By End Use
- 21.7.4. By Production Process
- 21.8. U.K. Market Analysis
- 21.8.1. By Material
- 21.8.2. By Shape
- 21.8.3. By End Use
- 21.8.4. By Production Process
- 21.9. Spain Market Analysis
- 21.9.1. By Material
- 21.9.2. By Shape
- 21.9.3. By End Use
- 21.9.4. By Production Process
- 21.10. Russia Market Analysis
- 21.10.1. By Material
- 21.10.2. By Shape
- 21.10.3. By End Use
- 21.10.4. By Production Process
- 21.11. China Market Analysis
- 21.11.1. By Material
- 21.11.2. By Shape
- 21.11.3. By End Use
- 21.11.4. By Production Process
- 21.12. Japan Market Analysis
- 21.12.1. By Material
- 21.12.2. By Shape
- 21.12.3. By End Use
- 21.12.4. By Production Process
- 21.13. S. Korea Market Analysis
- 21.13.1. By Material
- 21.13.2. By Shape
- 21.13.3. By End Use
- 21.13.4. By Production Process
- 21.14. India Market Analysis
- 21.14.1. By Material
- 21.14.2. By Shape
- 21.14.3. By End Use
- 21.14.4. By Production Process
- 21.15. ASEAN Market Analysis
- 21.15.1. By Material
- 21.15.2. By Shape
- 21.15.3. By End Use
- 21.15.4. By Production Process
- 21.16. Australia and New Zealand Market Analysis
- 21.16.1. By Material
- 21.16.2. By Shape
- 21.16.3. By End Use
- 21.16.4. By Production Process
- 21.17. GCC Countries Market Analysis
- 21.17.1. By Material
- 21.17.2. By Shape
- 21.17.3. By End Use
- 21.17.4. By Production Process
- 21.18. Turkey Market Analysis
- 21.18.1. By Material
- 21.18.2. By Shape
- 21.18.3. By End Use
- 21.18.4. By Production Process
22. Market Structure Analysis
- 22.1. Market Analysis by Tier of Companies (Metal Powder & Alloy for Additive Manufacturing)
- 22.2. Market Share Analysis of Top Players
- 22.3. Apparent Production Capacities
- 22.4. Market Presence Analysis
- 22.4.1. By Material Type
- 22.4.2. By End Use
- 22.4.3. By Production Process
- 22.4.4. By Regional Footprint
23. Competition Analysis
- 23.1. Competition Dashboard
- 23.2. Competition Benchmarking
- 23.3. Competition Deep Dive
- 23.3.1. Sandvik AB
- 23.3.1.1. Company Overview
- 23.3.1.2. Product Portfolio
- 23.3.1.3. Profitability by Market Segments (Product/Channel/Region)
- 23.3.1.4. Sales Footprint
- 23.3.1.5. Strategy Overview
- 23.3.1.6. SWOT Analysis
- 23.3.1.7. Financial Statistics
- 23.3.1.8. Recent Developments
- 23.3.2. ATI Powder Metals
- 23.3.2.1. Company Overview
- 23.3.2.2. Product Portfolio
- 23.3.2.3. Profitability by Market Segments (Product/Channel/Region)
- 23.3.2.4. Sales Footprint
- 23.3.2.5. Strategy Overview
- 23.3.2.6. SWOT Analysis
- 23.3.2.7. Financial Statistics
- 23.3.2.8. Recent Developments
- 23.3.3. Advanced Metallurgical Group
- 23.3.3.1. Company Overview
- 23.3.3.2. Product Portfolio
- 23.3.3.3. Profitability by Market Segments (Product/Channel/Region)
- 23.3.3.4. Sales Footprint
- 23.3.3.5. Strategy Overview
- 23.3.3.6. SWOT Analysis
- 23.3.3.7. Financial Statistics
- 23.3.3.8. Recent Developments
- 23.3.4. Rio Tinto
- 23.3.4.1. Company Overview
- 23.3.4.2. Product Portfolio
- 23.3.4.3. Profitability by Market Segments (Product/Channel/Region)
- 23.3.4.4. Sales Footprint
- 23.3.4.5. Strategy Overview
- 23.3.4.6. SWOT Analysis
- 23.3.4.7. Financial Statistics
- 23.3.4.8. Recent Developments
- 23.3.5. American Axle & Manufacturing, Inc.
- 23.3.5.1. Company Overview
- 23.3.5.2. Product Portfolio
- 23.3.5.3. Profitability by Market Segments (Product/Channel/Region)
- 23.3.5.4. Sales Footprint
- 23.3.5.5. Strategy Overview
- 23.3.5.6. SWOT Analysis
- 23.3.5.7. Financial Statistics
- 23.3.5.8. Recent Developments
- 23.3.6. Carpenter Powered Products
- 23.3.6.1. Company Overview
- 23.3.6.2. Product Portfolio
- 23.3.6.3. Profitability by Market Segments (Product/Channel/Region)
- 23.3.6.4. Sales Footprint
- 23.3.6.5. Strategy Overview
- 23.3.6.6. SWOT Analysis
- 23.3.6.7. Financial Statistics
- 23.3.6.8. Recent Developments
- 23.3.7. Showa Denko Materials
- 23.3.7.1. Company Overview
- 23.3.7.2. Product Portfolio
- 23.3.7.3. Profitability by Market Segments (Product/Channel/Region)
- 23.3.7.4. Sales Footprint
- 23.3.7.5. Strategy Overview
- 23.3.7.6. SWOT Analysis
- 23.3.7.7. Financial Statistics
- 23.3.7.8. Recent Developments
- 23.3.8. GKN PLC
- 23.3.8.1. Company Overview
- 23.3.8.2. Product Portfolio
- 23.3.8.3. Profitability by Market Segments (Product/Channel/Region)
- 23.3.8.4. Sales Footprint
- 23.3.8.5. Strategy Overview
- 23.3.8.6. SWOT Analysis
- 23.3.8.7. Financial Statistics
- 23.3.8.8. Recent Developments
- 23.3.9. Praxair Surface Technologies Inc.
- 23.3.9.1. Company Overview
- 23.3.9.2. Product Portfolio
- 23.3.9.3. Profitability by Market Segments (Product/Channel/Region)
- 23.3.9.4. Sales Footprint
- 23.3.9.5. Strategy Overview
- 23.3.9.6. SWOT Analysis
- 23.3.9.7. Financial Statistics
- 23.3.9.8. Recent Developments
- 23.3.10. Aubert & Duval
- 23.3.10.1. Company Overview
- 23.3.10.2. Product Portfolio
- 23.3.10.3. Profitability by Market Segments (Product/Channel/Region)
- 23.3.10.4. Sales Footprint
- 23.3.10.5. Strategy Overview
- 23.3.10.6. SWOT Analysis
- 23.3.10.7. Financial Statistics
- 23.3.10.8. Recent Developments
- 23.3.11. Hoganas AB
- 23.3.11.1. Company Overview
- 23.3.11.2. Product Portfolio
- 23.3.11.3. Profitability by Market Segments (Product/Channel/Region)
- 23.3.11.4. Sales Footprint
- 23.3.11.5. Strategy Overview
- 23.3.11.6. SWOT Analysis
- 23.3.11.7. Financial Statistics
- 23.3.11.8. Recent Developments
- 23.3.12. voestalpine BOHLER Edelstahl GmbH & Co KG
- 23.3.12.1. Company Overview
- 23.3.12.2. Product Portfolio
- 23.3.12.3. Profitability by Market Segments (Product/Channel/Region)
- 23.3.12.4. Sales Footprint
- 23.3.12.5. Strategy Overview
- 23.3.12.6. SWOT Analysis
- 23.3.12.7. Financial Statistics
- 23.3.12.8. Recent Developments
- 23.3.13. Royal Metal Powders
- 23.3.13.1. Company Overview
- 23.3.13.2. Product Portfolio
- 23.3.13.3. Profitability by Market Segments (Product/Channel/Region)
- 23.3.13.4. Sales Footprint
- 23.3.13.5. Strategy Overview
- 23.3.13.6. SWOT Analysis
- 23.3.13.7. Financial Statistics
- 23.3.13.8. Recent Developments
- 23.3.14. Australian Metal Powders Supplies Pty Ltd.
- 23.3.14.1. Company Overview
- 23.3.14.2. Product Portfolio
- 23.3.14.3. Profitability by Market Segments (Product/Channel/Region)
- 23.3.14.4. Sales Footprint
- 23.3.14.5. Strategy Overview
- 23.3.14.6. SWOT Analysis
- 23.3.14.7. Financial Statistics
- 23.3.14.8. Recent Developments
- 23.3.15. CNPC Powder Group Co., Ltd.
- 23.3.15.1. Company Overview
- 23.3.15.2. Product Portfolio
- 23.3.15.3. Profitability by Market Segments (Product/Channel/Region)
- 23.3.15.4. Sales Footprint
- 23.3.15.5. Strategy Overview
- 23.3.15.6. SWOT Analysis
- 23.3.15.7. Financial Statistics
- 23.3.15.8. Recent Developments
- 23.3.16. Renishaw
- 23.3.16.1. Company Overview
- 23.3.16.2. Product Portfolio
- 23.3.16.3. Profitability by Market Segments (Product/Channel/Region)
- 23.3.16.4. Sales Footprint
- 23.3.16.5. Strategy Overview
- 23.3.16.6. SWOT Analysis
- 23.3.16.7. Financial Statistics
- 23.3.16.8. Recent Developments
- 23.3.17. Materialise NV
- 23.3.17.1. Company Overview
- 23.3.17.2. Product Portfolio
- 23.3.17.3. Profitability by Market Segments (Product/Channel/Region)
- 23.3.17.4. Sales Footprint
- 23.3.17.5. Strategy Overview
- 23.3.17.6. SWOT Analysis
- 23.3.17.7. Financial Statistics
- 23.3.17.8. Recent Developments
- 23.3.18. Stratasys Ltd.
- 23.3.18.1. Company Overview
- 23.3.18.2. Product Portfolio
- 23.3.18.3. Profitability by Market Segments (Product/Channel/Region)
- 23.3.18.4. Sales Footprint
- 23.3.18.5. Strategy Overview
- 23.3.18.6. SWOT Analysis
- 23.3.18.7. Financial Statistics
- 23.3.18.8. Recent Developments
- 23.3.19. Optomec, Inc
- 23.3.19.1. Company Overview
- 23.3.19.2. Product Portfolio
- 23.3.19.3. Profitability by Market Segments (Product/Channel/Region)
- 23.3.19.4. Sales Footprint
- 23.3.19.5. Strategy Overview
- 23.3.19.6. SWOT Analysis
- 23.3.19.7. Financial Statistics
- 23.3.19.8. Recent Developments
- 23.3.20. 3D Systems Corporation
- 23.3.20.1. Company Overview
- 23.3.20.2. Product Portfolio
- 23.3.20.3. Profitability by Market Segments (Product/Channel/Region)
- 23.3.20.4. Sales Footprint
- 23.3.20.5. Strategy Overview
- 23.3.20.6. SWOT Analysis
- 23.3.20.7. Financial Statistics
- 23.3.20.8. Recent Developments
- 23.3.21. Arcam AB
- 23.3.21.1. Company Overview
- 23.3.21.2. Product Portfolio
- 23.3.21.3. Profitability by Market Segments (Product/Channel/Region)
- 23.3.21.4. Sales Footprint
- 23.3.21.5. Strategy Overview
- 23.3.21.6. SWOT Analysis
- 23.3.21.7. Financial Statistics
- 23.3.21.8. Recent Developments
- 23.3.1. Sandvik AB
