|
|
市場調査レポート
商品コード
1508660
骨誘導再生市場:世界の産業分析、規模、シェア、成長、動向、予測、2024年~2033年Guided Bone Regeneration Market: Global Industry Analysis, Size, Share, Growth, Trends, and Forecast, 2024-2033 |
||||||
|
|||||||
カスタマイズ可能
|
|||||||

| 骨誘導再生市場:世界の産業分析、規模、シェア、成長、動向、予測、2024年~2033年 |
|
出版日: 2024年07月01日
発行: Persistence Market Research
ページ情報: 英文 302 Pages
納期: 2~5営業日
|

全表示
- 概要
- 目次
Persistence Market Researchはこのほど、骨誘導再生(GBR)市場に関する包括的なレポートを発表しました。当レポートでは、重要な市場ダイナミクスを詳細に分析し、市場展望を形成する促進要因、動向、機会、課題に関する洞察を提供しています。
主要な洞察
- 骨誘導再生市場規模(2024年):7億9,140万米ドル
- 予測市場金額(2033年):12億米ドル
- 世界市場成長率(CAGR 2024年~2033年):4.7%
骨誘導再生市場 - 調査範囲:
骨誘導再生(GBR)技術は、局所的な欠損部における骨組織の再生を促進することにより、再生歯科および整形外科において重要な役割を果たしています。これらの技術では、バリア膜や骨移植材を使用して骨成長に適した空間を形成し、骨の量やアーキテクチャを回復させます。GBR市場は、歯科医院、病院、整形外科センターにサービスを提供し、さまざまな臨床用途に合わせたさまざまな生体材料、メンブレン、手術器具を提供しています。
市場成長の促進要因:
世界の骨誘導再生市場は、歯周病の有病率の増加、外傷や疾患による骨欠損の発生率の上昇、骨関連疾患に罹患しやすい高齢化人口の増加など、いくつかの要因によって促進されています。生体材料、メンブレン設計、低侵襲手術技術における技術進歩は、治療結果と患者の回復を高め、市場拡大を促進します。さらに、歯科や整形外科の専門分野にとどまらず、顎顔面外科や獣医学へのGBR技術の応用拡大が、市場プレーヤーに新たな成長機会を生み出しています。
市場抑制要因:
有望な成長見通しにもかかわらず、骨誘導再生医療市場は、高額な治療費、限られた償還範囲、生体材料や医療機器の承認と商業化を管理する規制の複雑さに関連する課題に直面しています。厳しい規制要件や地域によって異なるヘルスケア政策は、メーカーや医療提供者にコンプライアンス上の負担を課し、市場浸透や事業戦略に影響を与えます。
市場機会:
骨誘導再生医療市場は、現在進行中の研究開発活動、戦略的提携、新興経済諸国におけるヘルスケアインフラの拡大が大きな成長機会をもたらしています。生体適合材料、カスタマイズインプラント用3Dプリンティング技術、デジタル歯科ソリューションの革新は、治療精度と患者の転帰を向上させ、市場の需要を刺激します。さらに、遠隔医療プラットフォームとデジタルヘルス技術の統合により、患者の遠隔モニタリングと術後ケア管理が容易になり、治療のアドヒアランスと臨床転帰が改善されます。
目次
第1章 エグゼクティブサマリー
第2章 市場概要
- 市場範囲/ 分類
- 市場の定義 / 範囲 / 制限
- 包含事項・除外事項
第3章 主要な市場動向
- 市場に影響を与える主要な動向
- 開発動向
第4章 主要な内容
- 製品採用分析:地域別
- 製品のUSP分析
- 主要なプロモーション戦略:メーカー別
- 規制シナリオ
- PESTLE分析
- ポーターの分析
- バリューチェーン分析
第5章 市場背景
- マクロ経済要因
- 予測要因 - 関連性と影響
- 市場力学
第6章 COVID-19危機分析
- 2024年の市場シナリオ
- COVID-19と影響分析
- 材料別
- 用途別
- エンドユーザー別
- 地域別
第7章 世界の骨誘導再生市場の需要(数量)分析
- 過去の市場数量分析、2019年~2023年
- 現在および将来の市場数量予測、2024年~2033年
- 前年比成長動向分析
第8章 世界の骨誘導再生市場 - 価格分析
- 地域別価格分析:材料別
- 価格の内訳
- メーカーレベル
- ディストリビューターレベル
- 世界平均価格分析ベンチマーク
- 価格設定の前提条件
第9章 世界の骨誘導再生市場の需要(金額または規模、百万米ドル)分析
- 過去の市場金額(百万米ドル)分析、2019年~2023年
- 現在および将来の市場金額(百万米ドル)予測、2024年~2033年
- 前年比成長動向分析
- 絶対額の機会分析
第10章 世界の骨誘導再生市場分析:材料別
- イントロダクション / 主要な調査結果
- 過去の市場規模(百万米ドル)と数量の分析:材料別、2019年~2023年
- 現在および将来の市場規模(百万米ドル)と数量の分析と予測:材料別、2024年~2033年
- 骨移植代替品
- バリア膜
- 市場の魅力分析:材料別
第11章 世界の骨誘導再生市場分析:用途別
- イントロダクション / 主要な調査結果
- 過去の市場規模(百万米ドル)の分析:用途別、2019年~2023年
- 現在および将来の市場規模(百万米ドル)の分析と予測:用途別、2024年~2033年
- インプラント学
- 歯周病学
- 口腔外科
- その他
- 市場の魅力分析:用途別
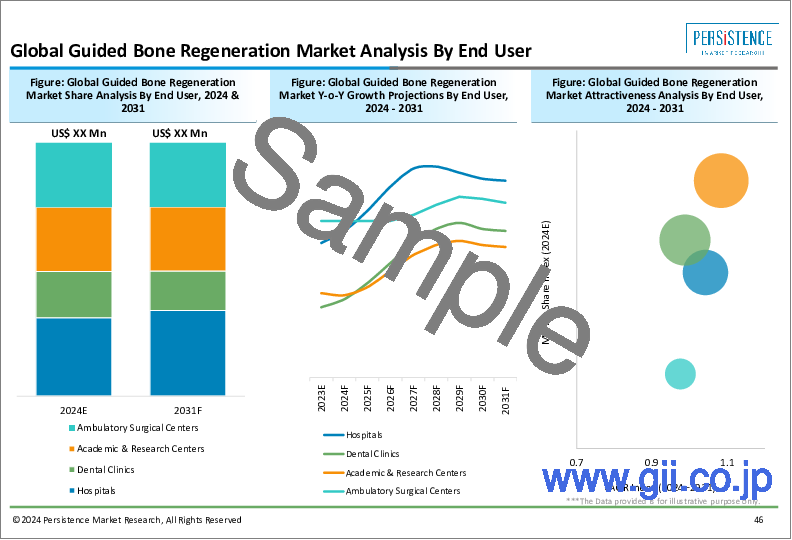
第12章 世界の骨誘導再生市場分析:エンドユーザー別
- イントロダクション / 主要な調査結果
- 過去の市場規模(百万米ドル)の分析:エンドユーザー別、2019~2023年
- 現在および将来の市場規模(百万米ドル)の分析と予測:エンドユーザー別、2024年~2033年
- 病院
- 歯科医院
- 学術研究センター
- 外来手術センター
- 市場の魅力分析:エンドユーザー別
第13章 世界の骨誘導再生市場分析:地域別
- イントロダクション
- 過去の市場規模(百万米ドル)と数量の分析:地域別、2019年~2023年
- 現在および将来の市場規模(百万米ドル)と数量の分析と予測:地域別、2024年~2033年
- 北米
- ラテンアメリカ
- 欧州
- 南アジア
- 東アジア
- オセアニア
- 中東・アフリカ
- 市場の魅力分析:地域別
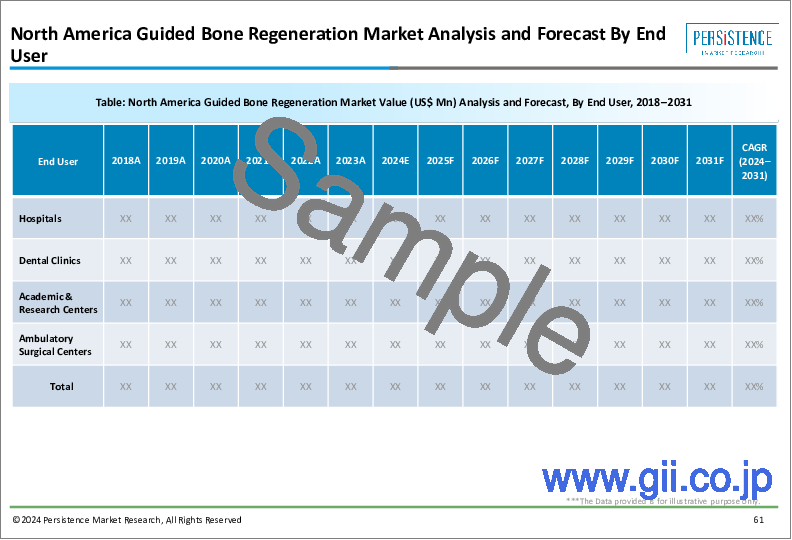
第14章 北米の骨誘導再生市場分析
第15章 ラテンアメリカの骨誘導再生市場分析
第16章 欧州の骨誘導再生市場分析
第17章 南アジアの骨誘導再生市場分析
第18章 東アジアの骨誘導再生市場分析
第19章 オセアニアの骨誘導再生市場分析
第20章 中東・アフリカ(MEA)の骨誘導再生市場分析
第21章 市場構造分析
- 市場分析:企業階層別
- 主要企業の市場シェア分析
- 市場プレゼンス分析
第22章 競合分析
- 競合ダッシュボード
- 競合ベンチマーク
- 競合の詳細情報
- Baxter International Inc.
- Medtronic
- Stryker Corp.
- Integra LifeSciences
- Zimmer Biomet Holdings
- Dentsply Sirona
- botiss biomaterials GmbH
- Geistlich Pharma AG
- Biotech Dental
- Dentegris GmbH
- GENOSS Co.,Ltd.
- Osstem Implant
第23章 使用される前提条件と頭字語
第24章 調査手法
Persistence Market Research has recently released a comprehensive report on the Guided Bone Regeneration (GBR) market. The report provides an in-depth analysis of crucial market dynamics, offering insights into drivers, trends, opportunities, and challenges shaping the market landscape.
Key Insights:
- Guided Bone Regeneration Market Size (2024E): USD 791.4 million
- Projected Market Value (2033F): USD 1,200.00 million
- Global Market Growth Rate (CAGR 2024 to 2033): 4.7%
Guided Bone Regeneration Market - Report Scope:
Guided Bone Regeneration (GBR) techniques play a critical role in regenerative dentistry and orthopedic surgery by facilitating the regeneration of bone tissue in localized defects. These techniques involve the use of barrier membranes and bone graft materials to create a space conducive to bone growth, thereby restoring bone volume and architecture. The GBR market serves dental clinics, hospitals, and orthopedic centers, offering a variety of biomaterials, membranes, and surgical instruments tailored for different clinical applications.
Market Growth Drivers:
The global Guided Bone Regeneration market is driven by several factors, including increasing prevalence of periodontal diseases, rising incidence of bone defects due to trauma or disease, and growing aging population susceptible to bone-related disorders. Technological advancements in biomaterials, membrane designs, and minimally invasive surgical techniques enhance treatment outcomes and patient recovery, fostering market expansion. Moreover, expanding applications of GBR techniques beyond dental and orthopedic specialties into maxillofacial surgery and veterinary medicine create new growth opportunities for market players.
Market Restraints:
Despite promising growth prospects, the Guided Bone Regeneration market faces challenges related to high treatment costs, limited reimbursement coverage, and regulatory complexities governing the approval and commercialization of biomaterials and medical devices. Stringent regulatory requirements and varying healthcare policies across regions impose compliance burdens on manufacturers and healthcare providers, influencing market penetration and operational strategies.
Market Opportunities:
The Guided Bone Regeneration market presents significant growth opportunities driven by ongoing research and development activities, strategic collaborations, and expanding healthcare infrastructure in emerging economies. Innovations in biocompatible materials, 3D printing technologies for customized implants, and digital dentistry solutions enhance treatment precision and patient outcomes, stimulating market demand. Furthermore, the integration of telemedicine platforms and digital health technologies facilitates remote patient monitoring and post-operative care management, improving treatment adherence and clinical outcomes.
Competitive Intelligence and Business Strategy:
Leading players in the global Guided Bone Regeneration market, such as Medtronic,Stryker Corp.,Integra LifeSciences, focus on product innovation, strategic partnerships, and market expansion initiatives to maintain competitive advantage. These companies invest in R&D to develop advanced biomaterials, biodegradable membranes, and patient-specific surgical kits, addressing diverse clinical needs and enhancing treatment efficacy. Collaborations with academic institutions, dental research centers, and regulatory agencies support technology adoption and market access, driving sustainable growth in the dynamic GBR landscape.
Key Questions Answered in the Report:
- What are the primary factors driving the growth of the Guided Bone Regeneration market globally?
- Which biomaterials and membrane technologies are driving adoption of GBR techniques across dental and orthopedic specialties?
- How are technological advancements reshaping the competitive landscape of the Guided Bone Regeneration market?
- Who are the key players contributing to the Guided Bone Regeneration market, and what strategies are they employing to sustain market leadership?
- What are the emerging trends and future prospects in the global Guided Bone Regeneration market?
Key Companies Profiled
- Baxter International Inc.
- Medtronic
- Stryker Corp.
- Integra LifeSciences
- Zimmer Biomet Holdings
- Dentsply Sirona
- botiss biomaterials GmbH
- Geistlich Pharma AG
- Biotech Dental
- Dentegris GmbH
- GENOSS Co., Ltd.
- Osstem Implant
Guided Bone Regeneration Industry Research Segmentation
By Material:
- Bone Graft Substitutes
- Barrier Membranes
By Application:
- Implantology
- Periodontology
- Oral and Maxillofacial Surgery
By End User:
- Hospitals
- Dental Clinics
- Academic & Research Centers
- Ambulatory Surgical Centers
By Region:
- North America
- Latin America
- Europe
- South Asia
- East Asia
- Oceania
- Middle East & Africa (MEA)
Table of Contents
1. Executive Summary
- 1.1. Global Market Outlook
- 1.2. Demand Side Trends
- 1.3. Supply Side Trends
- 1.4. Analysis and Recommendations
2. Market Overview
- 2.1. Market Coverage / Taxonomy
- 2.2. Market Definition / Scope / Limitations
- 2.3. Inclusion And Exclusions
3. Key Market Trends
- 3.1. Key Trends Impacting the Market
- 3.2. Development Trends
4. Key Inclusions
- 4.1. Product Adoption Analysis by Region
- 4.2. Product USP Analysis
- 4.3. Key Promotional Strategies by Manufacturers
- 4.4. Regulatory Scenario
- 4.5. PESTLE Analysis
- 4.6. Porter's Analysis
- 4.7. Value Chain Analysis
5. Market Background
- 5.1. Macro-Economic Factors
- 5.1.1. Global GDP Growth Outlook
- 5.1.2. Global Healthcare Industry Outlook
- 5.1.3. Global Bone Regeneration Market Overview
- 5.2. Forecast Factors - Relevance & Impact
- 5.2.1. Top Companies Historical Growth
- 5.2.2. Increasing Prevalence of Dental Diseases
- 5.2.3. Adoption of Minimally Invasive Procedures
- 5.2.4. Increasing Prevalence of Bone Related disorders
- 5.2.5. New Product launches and approvals
- 5.2.6. Regulatory Policies
- 5.2.7. Historic and Current Revenue of key players
- 5.2.8. Technology advancements
- 5.3. Market Dynamics
- 5.3.1. Drivers
- 5.3.2. Restraints
- 5.3.3. Opportunity Analysis
6. COVID-19 Crisis Analysis
- 6.1. 2024 Market Scenario
- 6.2. COVID-19 and Impact Analysis
- 6.2.1. By Material
- 6.2.2. By Application
- 6.2.3. By End User
- 6.2.4. By Region
7. Global Guided Bone Regeneration Market Demand (Volume) Analysis 2019-2023 and Forecast, 2024-2033
- 7.1. Historical Market Volume ('000 Units) Analysis, 2019-2023
- 7.2. Current and Future Market Volume ('000 Units) Projections, 2024-2033
- 7.2.1. Y-o-Y Growth Trend Analysis
8. Global Guided Bone Regeneration Market - Pricing Analysis
- 8.1. Regional Pricing Analysis By Material
- 8.2. Pricing Break Up
- 8.2.1. Manufacturer Level
- 8.2.2. Distributor Level
- 8.3. Global Average Pricing Analysis Benchmark
- 8.4. Pricing Assumptions
9. Global Guided Bone Regeneration Market Demand (in Value or Size in US$ Mn) Analysis 2019-2023 and Forecast, 2024-2033
- 9.1. Historical Market Value (US$ Mn) Analysis, 2019-2023
- 9.2. Current and Future Market Value (US$ Mn) Projections, 2024-2033
- 9.2.1. Y-o-Y Growth Trend Analysis
- 9.2.2. Absolute $ Opportunity Analysis
10. Global Guided Bone Regeneration Market Analysis 2019-2023 and Forecast 2024-2033, By Material
- 10.1. Introduction / Key Findings
- 10.2. Historical Market Size (US$ Mn) and Volume ('000 Units) Analysis By Material, 2019-2023
- 10.3. Current and Future Market Size (US$ Mn) and Volume ('000 Units) Analysis and Forecast By Material, 2024-2033
- 10.3.1. Bone Graft Substitutes
- 10.3.1.1. Allograft
- 10.3.1.2. Xenograft
- 10.3.1.3. Synthetic Bone Graft
- 10.3.1.4. Others
- 10.3.2. Barrier Membrane
- 10.3.2.1. Expanded polytetrafluoroethylene (e-PTFE)
- 10.3.2.2. High-density polytetrafluoroethylene (d-PTFE)
- 10.3.2.3. Titanium mesh and titanium-reinforced PTFE
- 10.3.1. Bone Graft Substitutes
- 10.4. Market Attractiveness Analysis By Material
11. Global Guided Bone Regeneration Market Analysis 2019-2023 and Forecast 2024-2033, By Application
- 11.1. Introduction / Key Findings
- 11.2. Historical Market Size (US$ Mn) Analysis By Application, 2019-2023
- 11.3. Current and Future Market Size (US$ Mn) Analysis and Forecast By Application, 2024-2033
- 11.3.1. Implantology
- 11.3.2. Periodontology
- 11.3.3. Oral and Maxillofacial surgery
- 11.3.4. Others
- 11.4. Market Attractiveness Analysis By Application
12. Global Guided Bone Regeneration Market Analysis 2019-2023 and Forecast 2024-2033, By End User
- 12.1. Introduction / Key Findings
- 12.2. Historical Market Size (US$ Mn) Analysis By End User, 2019-2023
- 12.3. Current and Future Market Size (US$ Mn) Analysis and Forecast By End User, 2024-2033
- 12.3.1. Hospitals
- 12.3.2. Dental Clinics
- 12.3.3. Academic & Research Centers
- 12.3.4. Ambulatory Surgical Centers
- 12.4. Market Attractiveness Analysis By End User
13. Global Guided Bone Regeneration Market Analysis 2019-2023 and Forecast 2024-2033, By Region
- 13.1. Introduction
- 13.2. Historical Market Size (US$ Mn) and Volume ('000 Units)Analysis By Region, 2019-2023
- 13.3. Current and Future Market Size (US$ Mn) and Volume ('000 Units) Analysis and Forecast By Region, 2024-2033
- 13.3.1. North America
- 13.3.2. Latin America
- 13.3.3. Europe
- 13.3.4. South Asia
- 13.3.5. East Asia
- 13.3.6. Oceania
- 13.3.7. Middle East and Africa
- 13.4. Market Attractiveness Analysis By Region
14. North America Guided Bone Regeneration Market Analysis 2019-2023 and Forecast 2024-2033
- 14.1. Introduction
- 14.2. Historical Market Size (US$ Mn) and Volume ('000 Units) Analysis By Market Taxonomy, 2019-2023
- 14.3. Current and Future Market Size (US$ Mn) and Volume ('000 Units) Analysis and Forecast By Market Taxonomy, 2024-2033
- 14.3.1. By Country
- 14.3.1.1. U.S.
- 14.3.1.2. Canada
- 14.3.2. By Material
- 14.3.3. By Application
- 14.3.4. By End User
- 14.3.1. By Country
- 14.4. Market Attractiveness Analysis
- 14.4.1. By Country
- 14.4.2. By Material
- 14.4.3. By Application
- 14.4.4. By End User
- 14.5. Key Market Participants - Intensity Mapping
- 14.6. Drivers and Restraints - Impact Analysis
- 14.7. Country Level Analysis & Forecast
- 14.7.1. U.S. Guided Bone Regeneration Market
- 14.7.1.1. Introduction
- 14.7.1.2. Market Analysis and Forecast by Market Taxonomy
- 14.7.1.2.1. By Material
- 14.7.1.2.2. By Application
- 14.7.1.2.3. By End User
- 14.7.2. Canada Guided Bone Regeneration Market
- 14.7.2.1. Introduction
- 14.7.2.2. Market Analysis and Forecast by Market Taxonomy
- 14.7.2.2.1. By Material
- 14.7.2.2.2. By Application
- 14.7.2.2.3. By End User
- 14.7.1. U.S. Guided Bone Regeneration Market
15. Latin America Guided Bone Regeneration Market Analysis 2019-2023 and Forecast 2024-2033
- 15.1. Introduction
- 15.2. Historical Market Size (US$ Mn) and Volume ('000 Units) Analysis By Market Taxonomy, 2019-2023
- 15.3. Current and Future Market Size (US$ Mn) and Volume ('000 Units) Analysis and Forecast By Market Taxonomy, 2024-2033
- 15.3.1. By Country
- 15.3.1.1. Brazil
- 15.3.1.2. Mexico
- 15.3.1.3. Argentina
- 15.3.1.4. Rest of Latin America
- 15.3.2. By Material
- 15.3.3. By Application
- 15.3.4. By End User
- 15.3.1. By Country
- 15.4. Market Attractiveness Analysis
- 15.4.1. By Country
- 15.4.2. By Material
- 15.4.3. By Application
- 15.4.4. By End User
- 15.5. Key Market Participants - Intensity Mapping
- 15.6. Drivers and Restraints - Impact Analysis
- 15.7. Country Level Analysis & Forecast
- 15.7.1. Brazil Guided Bone Regeneration Market
- 15.7.1.1. Introduction
- 15.7.1.2. Market Analysis and Forecast by Market Taxonomy
- 15.7.1.2.1. By Material
- 15.7.1.2.2. By Application
- 15.7.1.2.3. By End User
- 15.7.2. Mexico Portable Multi-Parameter Monitors Market
- 15.7.2.1. Introduction
- 15.7.2.2. Market Analysis and Forecast by Market Taxonomy
- 15.7.2.2.1. By Material
- 15.7.2.2.2. By Application
- 15.7.2.2.3. By End User
- 15.7.3. Argentina Guided Bone Regeneration Market
- 15.7.3.1. Introduction
- 15.7.3.2. Market Analysis and Forecast by Market Taxonomy
- 15.7.3.2.1. By Material
- 15.7.3.2.2. By Application
- 15.7.3.2.3. By End User
- 15.7.1. Brazil Guided Bone Regeneration Market
16. Europe Guided Bone Regeneration Market Analysis 2019-2023 and Forecast 2024-2033
- 16.1. Introduction
- 16.2. Historical Market Size (US$ Mn) and Volume ('000 Units) Analysis By Market Taxonomy, 2019-2023
- 16.3. Current and Future Market Size (US$ Mn) and Volume ('000 Units) Analysis and Forecast By Market Taxonomy, 2024-2033
- 16.3.1. By Country
- 16.3.1.1. Germany
- 16.3.1.2. Italy
- 16.3.1.3. France
- 16.3.1.4. U.K.
- 16.3.1.5. Spain
- 16.3.1.6. BENELUX
- 16.3.1.7. Russia
- 16.3.1.8. Nordic Countries
- 16.3.1.9. Rest of Europe
- 16.3.2. By Material
- 16.3.3. By Portability
- 16.3.4. By Application
- 16.3.5. By End User
- 16.3.1. By Country
- 16.4. Market Attractiveness Analysis
- 16.4.1. By Country
- 16.4.2. By Material
- 16.4.3. By Application
- 16.4.4. By End User
- 16.5. Key Market Participants - Intensity Mapping
- 16.6. Drivers and Restraints - Impact Analysis
- 16.7. Country Level Analysis & Forecast
- 16.7.1. Germany Guided Bone Regeneration Market
- 16.7.1.1. Introduction
- 16.7.1.2. Market Analysis and Forecast by Market Taxonomy
- 16.7.1.2.1. By Material
- 16.7.1.2.2. By Application
- 16.7.1.2.3. By End User
- 16.7.2. Italy Guided Bone Regeneration Market
- 16.7.2.1. Introduction
- 16.7.2.2. Market Analysis and Forecast by Market Taxonomy
- 16.7.2.2.1. By Material
- 16.7.2.2.2. By Application
- 16.7.2.2.3. By End User
- 16.7.3. France Guided Bone Regeneration Market
- 16.7.3.1. Introduction
- 16.7.3.2. Market Analysis and Forecast by Market Taxonomy
- 16.7.3.2.1. By Material
- 16.7.3.2.2. By Application
- 16.7.3.2.3. By End User
- 16.7.4. U.K. Guided Bone Regeneration Market
- 16.7.4.1. Introduction
- 16.7.4.2. Market Analysis and Forecast by Market Taxonomy
- 16.7.4.2.1. By Material
- 16.7.4.2.2. By Application
- 16.7.4.2.3. By End User
- 16.7.5. Spain Guided Bone Regeneration Market
- 16.7.5.1. Introduction
- 16.7.5.2. Market Analysis and Forecast by Market Taxonomy
- 16.7.5.2.1. By Material
- 16.7.5.2.2. By Application
- 16.7.5.2.3. By End User
- 16.7.6. BENULUX Guided Bone Regeneration Market
- 16.7.6.1. Introduction
- 16.7.6.2. Market Analysis and Forecast by Market Taxonomy
- 16.7.6.2.1. By Material
- 16.7.6.2.2. By Application
- 16.7.6.2.3. By End User
- 16.7.7. Russia Guided Bone Regeneration Market
- 16.7.7.1. Introduction
- 16.7.7.2. Market Analysis and Forecast by Market Taxonomy
- 16.7.7.2.1. By Material
- 16.7.7.2.2. By Application
- 16.7.7.2.3. By End User
- 16.7.8. Nordic Countries Guided Bone Regeneration Market
- 16.7.8.1. Introduction
- 16.7.8.2. Market Analysis and Forecast by Market Taxonomy
- 16.7.8.2.1. By Material
- 16.7.8.2.2. By Application
- 16.7.8.2.3. By End User
- 16.7.1. Germany Guided Bone Regeneration Market
17. South Asia Guided Bone Regeneration Market Analysis 2019-2023 and Forecast 2024-2033
- 17.1. Introduction
- 17.2. Historical Market Size (US$ Mn) and Volume ('000 Units) Analysis By Market Taxonomy, 2019-2023
- 17.3. Current and Future Market Size (US$ Mn) and Volume ('000 Units) Analysis and Forecast By Market Taxonomy, 2024-2033
- 17.3.1. By Country
- 17.3.1.1. India
- 17.3.1.2. Indonesia
- 17.3.1.3. Malaysia
- 17.3.1.4. Thailand
- 17.3.1.5. Rest of South Asia
- 17.3.2. By Material
- 17.3.3. By Application
- 17.3.4. By End User
- 17.3.1. By Country
- 17.4. Market Attractiveness Analysis
- 17.4.1. By Country
- 17.4.2. By Material
- 17.4.3. By Application
- 17.4.4. By End User
- 17.5. Key Market Participants - Intensity Mapping
- 17.6. Drivers and Restraints - Impact Analysis
- 17.7. Country Level Analysis & Forecast
- 17.7.1. India Guided Bone Regeneration Market
- 17.7.1.1. Introduction
- 17.7.1.2. Market Analysis and Forecast by Market Taxonomy
- 17.7.1.2.1. By Material
- 17.7.1.2.2. By Application
- 17.7.1.2.3. By End User
- 17.7.2. Indonesia Guided Bone Regeneration Market
- 17.7.2.1. Introduction
- 17.7.2.2. Market Analysis and Forecast by Market Taxonomy
- 17.7.2.2.1. By Material
- 17.7.2.2.2. By Application
- 17.7.2.2.3. By End User
- 17.7.3. Malaysia Guided Bone Regeneration Market
- 17.7.3.1. Introduction
- 17.7.3.2. Market Analysis and Forecast by Market Taxonomy
- 17.7.3.2.1. By Material
- 17.7.3.2.2. By Application
- 17.7.3.2.3. By End User
- 17.7.4. Thailand Guided Bone Regeneration Market
- 17.7.4.1. Introduction
- 17.7.4.2. Market Analysis and Forecast by Market Taxonomy
- 17.7.4.2.1. By Material
- 17.7.4.2.2. By Application
- 17.7.4.2.3. By End User
- 17.7.1. India Guided Bone Regeneration Market
18. East Asia Guided Bone Regeneration Market Analysis 2019-2023 and Forecast 2024-2033
- 18.1. Introduction
- 18.2. Historical Market Size (US$ Mn) and Volume ('000 Units) Analysis By Market Taxonomy, 2019-2023
- 18.3. Current and Future Market Size (US$ Mn) and Volume ('000 Units) Analysis and Forecast By Market Taxonomy, 2024-2033
- 18.3.1. By Country
- 18.3.1.1. China
- 18.3.1.2. Japan
- 18.3.1.3. South Korea
- 18.3.2. By Material
- 18.3.3. By Application
- 18.3.4. By End User
- 18.3.1. By Country
- 18.4. Market Attractiveness Analysis
- 18.4.1. By Country
- 18.4.2. By Material
- 18.4.3. By Application
- 18.4.4. By End User
- 18.5. Key Market Participants - Intensity Mapping
- 18.6. Drivers and Restraints - Impact Analysis
- 18.7. Country Level Analysis & Forecast
- 18.7.1. China Guided Bone Regeneration Market
- 18.7.1.1. Introduction
- 18.7.1.2. Market Analysis and Forecast by Market Taxonomy
- 18.7.1.2.1. By Material
- 18.7.1.2.2. By Application
- 18.7.1.2.3. By End User
- 18.7.2. Japan Guided Bone Regeneration Market
- 18.7.2.1. Introduction
- 18.7.2.2. Market Analysis and Forecast by Market Taxonomy
- 18.7.2.2.1. By Material
- 18.7.2.2.2. By Application
- 18.7.2.2.3. By End User
- 18.7.3. South Korea Guided Bone Regeneration Market
- 18.7.3.1. Introduction
- 18.7.3.2. Market Analysis and Forecast by Market Taxonomy
- 18.7.3.2.1. By Material
- 18.7.3.2.2. By Application
- 18.7.3.2.3. By End User
- 18.7.1. China Guided Bone Regeneration Market
19. Oceania Guided Bone Regeneration Market Analysis 2019-2023 and Forecast 2024-2033
- 19.1. Introduction
- 19.2. Historical Market Size (US$ Mn) and Volume ('000 Units) Analysis By Market Taxonomy, 2019-2023
- 19.3. Current and Future Market Size (US$ Mn) and Volume ('000 Units) Analysis and Forecast By Market Taxonomy, 2024-2033
- 19.3.1. By Country
- 19.3.1.1. Australia
- 19.3.1.2. New Zealand
- 19.3.2. By Material
- 19.3.3. By Application
- 19.3.4. By End User
- 19.3.1. By Country
- 19.4. Market Attractiveness Analysis
- 19.4.1. By Country
- 19.4.2. By Material
- 19.4.3. By Application
- 19.4.4. By End User
- 19.5. Key Market Participants - Intensity Mapping
- 19.6. Drivers and Restraints - Impact Analysis
- 19.7. Country Level Analysis & Forecast
- 19.7.1. Australia Guided Bone Regeneration Market
- 19.7.1.1. Introduction
- 19.7.1.2. Market Analysis and Forecast by Market Taxonomy
- 19.7.1.2.1. By Material
- 19.7.1.2.2. By Application
- 19.7.1.2.3. By End User
- 19.7.2. New Zealand Guided Bone Regeneration Market
- 19.7.2.1. Introduction
- 19.7.2.2. Market Analysis and Forecast by Market Taxonomy
- 19.7.2.2.1. By Material
- 19.7.2.2.2. By Application
- 19.7.2.2.3. By End User
- 19.7.1. Australia Guided Bone Regeneration Market
20. Middle East and Africa (MEA) Guided Bone Regeneration Market Analysis 2019-2023 and Forecast 2024-2033
- 20.1. Introduction
- 20.2. Historical Market Size (US$ Mn) and Volume ('000 Units) Analysis By Market Taxonomy, 2019-2023
- 20.3. Current and Future Market Size (US$ Mn) and Volume ('000 Units) Analysis and Forecast By Market Taxonomy, 2024-2033
- 20.3.1. By Country
- 20.3.1.1. GCC Countries
- 20.3.1.2. Turkey
- 20.3.1.3. North Africa
- 20.3.1.4. South Africa
- 20.3.1.5. Rest of Middle East and Africa
- 20.3.2. By Material
- 20.3.3. By Application
- 20.3.4. By End User
- 20.3.1. By Country
- 20.4. Market Attractiveness Analysis
- 20.4.1. By Country
- 20.4.2. By Material
- 20.4.3. By Application
- 20.4.4. By End User
- 20.5. Key Market Participants - Intensity Mapping
- 20.6. Drivers and Restraints - Impact Analysis
- 20.7. Country Level Analysis & Forecast
- 20.7.1. GCC Countries Guided Bone Regeneration Market
- 20.7.1.1. Introduction
- 20.7.1.2. Market Analysis and Forecast by Market Taxonomy
- 20.7.1.2.1. By Material
- 20.7.1.2.2. By Application
- 20.7.1.2.3. By End User
- 20.7.2. Turkey Guided Bone Regeneration Market
- 20.7.2.1. Introduction
- 20.7.2.2. Market Analysis and Forecast by Market Taxonomy
- 20.7.2.2.1. By Material
- 20.7.2.2.2. By Application
- 20.7.2.2.3. By End User
- 20.7.3. North Africa Guided Bone Regeneration Market
- 20.7.3.1. Introduction
- 20.7.3.2. Market Analysis and Forecast by Market Taxonomy
- 20.7.3.2.1. By Material
- 20.7.3.2.2. By Application
- 20.7.3.2.3. By End User
- 20.7.4. South Africa Guided Bone Regeneration Market
- 20.7.4.1. Introduction
- 20.7.4.2. Market Analysis and Forecast by Market Taxonomy
- 20.7.4.2.1. By Material
- 20.7.4.2.2. By Application
- 20.7.4.2.3. By End User
- 20.7.1. GCC Countries Guided Bone Regeneration Market
21. Market Structure Analysis
- 21.1. Market Analysis by Tier of Companies
- 21.2. Market Share Analysis of Top Players
- 21.3. Market Presence Analysis
- 21.3.1. Regional footprint of Players
- 21.3.2. Material footprint by Players
- 21.3.3. Channel footprint by Players
22. Competition Analysis
- 22.1. Competition Dashboard
- 22.2. Competition Benchmarking
- 22.3. Competition Deep Dive
- 22.3.1. Baxter International Inc.
- 22.3.1.1. Overview
- 22.3.1.2. Product Portfolio
- 22.3.1.3. Key Financials by Market Segments (Product/Channel/Region)
- 22.3.1.4. Sales Footprint
- 22.3.1.5. SWOT Analysis
- 22.3.1.6. Key Developments
- 22.3.1.7. Strategy Overview
- 22.3.1.7.1. Channel Strategy
- 22.3.1.7.2. Marketing Strategy
- 22.3.1.7.3. Material Strategy
- 22.3.2. Medtronic
- 22.3.2.1. Overview
- 22.3.2.2. Product Portfolio
- 22.3.2.3. Key Financials by Market Segments (Product/Channel/Region)
- 22.3.2.4. Sales Footprint
- 22.3.2.5. SWOT Analysis
- 22.3.2.6. Key Developments
- 22.3.2.7. Strategy Overview
- 22.3.2.7.1. Channel Strategy
- 22.3.2.7.2. Marketing Strategy
- 22.3.2.7.3. Material Strategy
- 22.3.3. Stryker Corp.
- 22.3.3.1. Overview
- 22.3.3.2. Product Portfolio
- 22.3.3.3. Key Financials by Market Segments (Product/Channel/Region)
- 22.3.3.4. Sales Footprint
- 22.3.3.5. SWOT Analysis
- 22.3.3.6. Key Developments
- 22.3.3.7. Strategy Overview
- 22.3.3.7.1. Channel Strategy
- 22.3.3.7.2. Marketing Strategy
- 22.3.3.7.3. Material Strategy
- 22.3.4. Integra LifeSciences
- 22.3.4.1. Overview
- 22.3.4.2. Product Portfolio
- 22.3.4.3. Key Financials by Market Segments (Product/Channel/Region)
- 22.3.4.4. Sales Footprint
- 22.3.4.5. SWOT Analysis
- 22.3.4.6. Key Developments
- 22.3.4.7. Strategy Overview
- 22.3.4.7.1. Channel Strategy
- 22.3.4.7.2. Marketing Strategy
- 22.3.4.7.3. Material Strategy
- 22.3.5. Zimmer Biomet Holdings
- 22.3.5.1. Overview
- 22.3.5.2. Product Portfolio
- 22.3.5.3. Key Financials by Market Segments (Product/Channel/Region)
- 22.3.5.4. Sales Footprint
- 22.3.5.5. SWOT Analysis
- 22.3.5.6. Key Developments
- 22.3.5.7. Strategy Overview
- 22.3.5.7.1. Channel Strategy
- 22.3.5.7.2. Marketing Strategy
- 22.3.5.7.3. Material Strategy
- 22.3.6. Dentsply Sirona
- 22.3.6.1. Overview
- 22.3.6.2. Product Portfolio
- 22.3.6.3. Key Financials by Market Segments (Product/Channel/Region)
- 22.3.6.4. Sales Footprint
- 22.3.6.5. SWOT Analysis
- 22.3.6.6. Key Developments
- 22.3.6.7. Strategy Overview
- 22.3.6.7.1. Channel Strategy
- 22.3.6.7.2. Marketing Strategy
- 22.3.6.7.3. Material Strategy
- 22.3.7. botiss biomaterials GmbH
- 22.3.7.1. Overview
- 22.3.7.2. Product Portfolio
- 22.3.7.3. Key Financials by Market Segments (Product/Channel/Region)
- 22.3.7.4. Sales Footprint
- 22.3.7.5. SWOT Analysis
- 22.3.7.6. Key Developments
- 22.3.7.7. Strategy Overview
- 22.3.7.7.1. Channel Strategy
- 22.3.7.7.2. Marketing Strategy
- 22.3.7.7.3. Material Strategy
- 22.3.8. Geistlich Pharma AG
- 22.3.8.1. Overview
- 22.3.8.2. Product Portfolio
- 22.3.8.3. Key Financials by Market Segments (Product/Channel/Region)
- 22.3.8.4. Sales Footprint
- 22.3.8.5. SWOT Analysis
- 22.3.8.6. Key Developments
- 22.3.8.7. Strategy Overview
- 22.3.8.7.1. Channel Strategy
- 22.3.8.7.2. Marketing Strategy
- 22.3.8.7.3. Material Strategy
- 22.3.9. Biotech Dental
- 22.3.9.1. Overview
- 22.3.9.2. Product Portfolio
- 22.3.9.3. Key Financials by Market Segments (Product/Channel/Region)
- 22.3.9.4. Sales Footprint
- 22.3.9.5. SWOT Analysis
- 22.3.9.6. Key Developments
- 22.3.9.7. Strategy Overview
- 22.3.9.7.1. Channel Strategy
- 22.3.9.7.2. Marketing Strategy
- 22.3.9.7.3. Material Strategy
- 22.3.10. Dentegris GmbH
- 22.3.10.1. Overview
- 22.3.10.2. Product Portfolio
- 22.3.10.3. Key Financials by Market Segments (Product/Channel/Region)
- 22.3.10.4. Sales Footprint
- 22.3.10.5. SWOT Analysis
- 22.3.10.6. Key Developments
- 22.3.10.7. Strategy Overview
- 22.3.10.7.1. Channel Strategy
- 22.3.10.7.2. Marketing Strategy
- 22.3.10.7.3. Material Strategy
- 22.3.11. GENOSS Co.,Ltd.
- 22.3.11.1. Overview
- 22.3.11.2. Product Portfolio
- 22.3.11.3. Key Financials by Market Segments (Product/Channel/Region)
- 22.3.11.4. Sales Footprint
- 22.3.11.5. SWOT Analysis
- 22.3.11.6. Key Developments
- 22.3.11.7. Strategy Overview
- 22.3.11.7.1. Channel Strategy
- 22.3.11.7.2. Marketing Strategy
- 22.3.11.7.3. Material Strategy
- 22.3.12. Osstem Implant
- 22.3.12.1. Overview
- 22.3.12.2. Product Portfolio
- 22.3.12.3. Key Financials by Market Segments (Product/Channel/Region)
- 22.3.12.4. Sales Footprint
- 22.3.12.5. SWOT Analysis
- 22.3.12.6. Key Developments
- 22.3.12.7. Strategy Overview
- 22.3.12.7.1. Channel Strategy
- 22.3.12.7.2. Marketing Strategy
- 22.3.12.7.3. Material Strategy
- 22.3.1. Baxter International Inc.

