|
|
市場調査レポート
商品コード
1701650
PCAポンプの世界市場:産業分析、規模、シェア、成長、動向、予測(2025年~2032年)Patient-controlled Analgesic Pumps Market: Global Industry Analysis, Size, Share, Growth, Trends, and Forecast, 2025 - 2032 |
||||||
カスタマイズ可能
|
|||||||
| PCAポンプの世界市場:産業分析、規模、シェア、成長、動向、予測(2025年~2032年) |
|
出版日: 2025年04月07日
発行: Persistence Market Research
ページ情報: 英文 250 Pages
納期: 2~5営業日
|
全表示
- 概要
- 目次
主な調査結果
- PCAポンプの市場規模:7億800万米ドル(2025年)
- 予測される市場金額:24億3,510万米ドル(2032年)
- 世界市場の成長率:19.3%(2025年~2032年のCAGR)
PCAポンプ市場:レポート範囲
PCAポンプは、患者が必要に応じて用量を調節した鎮痛薬を自己投与できるようにする医療機器です。これらのポンプは、病院、外来患者施設、在宅ケア環境で、術後疼痛、慢性疼痛状態、緩和ケアの管理に広く使用されています。PCAポンプは患者の快適性を向上させ、医療提供者への依存を減らし、疼痛管理の効率を高めます。慢性疾患の有病率の増加、効果的な疼痛管理ソリューションに対する需要の高まり、輸液ポンプ技術の進歩が市場成長の促進要因となっています。
市場成長の促進要因
世界のPCAポンプ市場は、外科手術の増加、老年人口の拡大、関節炎やがん性疼痛などの慢性疼痛疾患の患者の増加によって牽引されています。自動ドラッグデリバリーとリアルタイムモニタリングを備えたスマート輸液システムなどの技術の進歩は、患者の安全性と治療効果を高めます。さらに、医療費の増加と疼痛管理に対する規制枠組みが、市場の拡大にさらに寄与しています。在宅疼痛管理ソリューションや遠隔医療サービスへのシフトも、PCAポンプメーカーに新たな成長の道をもたらしています。
市場抑制要因
有望な成長見通しにもかかわらず、PCAポンプ市場は、機器の高いコスト、投薬ミスのリスク、厳しい規制承認などの課題に直面しています。患者の誤操作やポンプの故障による過多投与や過少投与のリスクは安全性への懸念を高め、採用率を制限しています。さらに、新興経済圏における償還上の制約や予算上の制限が、先進のPCAポンプへの幅広いアクセスを妨げています。これらの課題に対処するには、機器設計の継続的な改良、医療提供者に対するトレーニングの強化、より手頃な価格設定戦略が必要です。
市場機会
PCAポンプ市場は、無線接続、ドラッグデリバリーの精度、ユーザーフレンドリーなインターフェースの革新により、大きな成長機会をもたらします。AIを活用した分析と遠隔モニタリング機能の統合は、リアルタイムの疼痛管理を強化し、再入院を減らし、患者の転帰を改善します。小児医療や緩和ケアにおける利用の拡大、医療機器企業と医療提供者との連携の増加が、市場の将来性をさらに高めています。さらに、個別化医療と患者中心のケアモデルの動向の高まりは、カスタマイズされたPCAポンプソリューションの新たな可能性を開きます。
当レポートでは、世界のPCAポンプ市場について調査し、成長促進要因、動向、機会、課題などの市場力学の詳細な分析を提供しています。
目次
第1章 エグゼクティブサマリー
第2章 市場の概要
- 市場の範囲/分類
- 市場の定義/範囲/制限
第3章 市場の背景
- 市場力学
- シナリオ予測
- 機会マップ分析
- 製品ライフサイクル分析
- サプライチェーン分析
- 投資実現可能性マトリクス
- バリューチェーン分析
- PESTLEとポーター分析
- 規制情勢
- 地域の親市場の見通し
- 生産と消費の統計
- 輸入と輸出の統計
第4章 PCAポンプ市場の分析(2019年~2032年)
- 市場規模(金額と数量)の実績の分析(2019年~2024年)
- 現在と将来の市場規模(金額と数量)の予測(2025年~2032年)
- 前年比成長動向の分析
- 絶対的収益機会の分析
第5章 PCAポンプ市場の分析:タイプ別(2019年~2032年)
- イントロダクション/主な調査結果
- 市場規模(金額と数量)の実績の分析:タイプ別(2019年~2024年)
- 現在と将来の市場規模(金額と数量)の分析と予測:タイプ別(2025年~2032年)
- 電子式
- 機械式
- 前年比成長動向の分析:タイプ別(2019年~2024年)
- タイプ絶対的収益機会の分析(2025年~2032年)
第6章 PCAポンプ市場の分析:用途別(2019年~2032年)
- イントロダクション/主な調査結果
- 市場規模(金額と数量)の実績の分析:用途別(2019年~2024年)
- 現在と将来の市場規模(金額と数量)の分析と予測:用途別(2025年~2032年)
- 糖尿病
- 腫瘍
- 消化器
- 血液
- その他の用途
- 前年比成長動向の分析:用途別(2019年~2024年)
- 用途絶対的収益機会の分析(2025年~2032年)
第7章 PCAポンプ市場の分析:最終用途別(2019年~2032年)
- イントロダクション/主な調査結果
- 市場規模(金額と数量)の実績の分析:最終用途別(2019年~2024年)
- 現在と将来の市場規模(金額と数量)の分析と予測:最終用途別(2025年~2032年)
- 病院
- 専門クリニック
- 外来手術センター
- 在宅ケア環境
- 前年比成長動向の分析:最終用途別(2019年~2024年)
- 最終用途絶対的収益機会の分析(2025年~2032年)
第8章 PCAポンプ市場の分析:地域別(2019年~2032年)
- イントロダクション
- 市場規模(金額と数量)の実績の分析:地域別(2019年~2024年)
- 現在の市場規模(金額と数量)の分析と予測:地域別(2025年~2032年)
- 北米
- ラテンアメリカ
- 欧州
- アジア太平洋
- 中東・アフリカ
- 市場の魅力分析:地域別
第9章 北米のPCAポンプ市場の分析:国別(2019年~2032年)
第10章 ラテンアメリカのPCAポンプ市場の分析:国別(2019年~2032年)
第11章 欧州のPCAポンプ市場の分析:国別(2019年~2032年)
第12章 アジア太平洋のPCAポンプ市場の分析:国別(2019年~2032年)
第13章 中東・アフリカのPCAポンプ市場の分析:国別(2019年~2032年)
第14章 主要国のPCAポンプ市場の分析
- 米国
- カナダ
- ブラジル
- メキシコ
- ドイツ
- 英国
- フランス
- スペイン
- イタリア
- ロシア
- 中国
- 日本
- インド
- 韓国
- オーストラリア
- 南アフリカ
- サウジアラビア
- アラブ首長国連邦
- イスラエル
第15章 市場構造の分析
- 競合ダッシュボード
- 競合ベンチマーク
- 主要企業の市場シェアの分析
第16章 競合分析
- 競合の詳細
- Smiths Group plc
- Fresenius SE & Co KGaA
- B. Braun Melsungen AG
- Baxter International Inc.
- Becton, Dickinson and Company
- ICU Medical, Inc.
- ACE Medical
- Terumo Corporation
- Pfizer Inc
第17章 前提条件と使用される頭字語
第18章 調査手法
Persistence Market Research has recently released a comprehensive report on the worldwide market for patient-controlled analgesic (PCA) pumps. The report offers a thorough assessment of crucial market dynamics, including drivers, trends, opportunities, and challenges, providing detailed insights into the market structure. This research publication presents exclusive data and statistics outlining the anticipated growth trajectory of the global patient-controlled analgesic pumps market from 2025 to 2032.
Key Insights:
- Patient-Controlled Analgesic Pumps Market Size (2025E): USD 708.0 Million
- Projected Market Value (2032F): USD 2,435.1 Million
- Global Market Growth Rate (CAGR 2025 to 2032): 19.3%
Patient-Controlled Analgesic Pumps Market - Report Scope:
Patient-controlled analgesic pumps are medical devices that allow patients to self-administer controlled doses of pain medication as needed. These pumps are widely used in hospitals, outpatient facilities, and homecare settings to manage post-surgical pain, chronic pain conditions, and palliative care. PCA pumps help improve patient comfort, reduce dependency on healthcare providers, and enhance pain management efficiency. The increasing prevalence of chronic diseases, rising demand for effective pain management solutions, and advancements in infusion pump technology are driving market growth.
Market Growth Drivers:
The global PCA pumps market is driven by the rising incidence of surgical procedures, the growing elderly population, and increasing cases of chronic pain conditions such as arthritis and cancer-related pain. Technological advancements, including smart infusion systems with automated drug delivery and real-time monitoring, enhance patient safety and treatment efficacy. Additionally, increasing healthcare expenditures, along with supportive regulatory frameworks for pain management, further contribute to market expansion. The shift towards home-based pain management solutions and telehealth services also presents new growth avenues for PCA pump manufacturers.
Market Restraints:
Despite the promising growth outlook, the PCA pumps market faces challenges such as high device costs, risks of medication errors, and stringent regulatory approvals. The risk of overdose or underdose due to patient mismanagement and pump malfunctions raises safety concerns, limiting adoption rates. Additionally, reimbursement constraints and budget limitations in developing economies hinder widespread access to advanced PCA pumps. Addressing these challenges requires continuous improvements in device design, enhanced training for healthcare providers, and more affordable pricing strategies.
Market Opportunities:
The PCA pumps market presents significant growth opportunities through innovations in wireless connectivity, drug delivery precision, and user-friendly interfaces. The integration of AI-powered analytics and remote monitoring capabilities enhances real-time pain management, reducing hospital readmissions and improving patient outcomes. Expanding applications in pediatric and palliative care, along with increasing collaborations between medical device companies and healthcare providers, further boost market potential. Additionally, the growing trend of personalized medicine and patient-centric care models opens new possibilities for customized PCA pump solutions.
Key Questions Answered in the Report:
- What are the primary factors driving the growth of the patient-controlled analgesic pumps market globally?
- How are technological advancements influencing the competitive landscape of PCA pumps?
- What challenges exist in ensuring patient safety and regulatory compliance for PCA pumps?
- Who are the key players in the PCA pumps market, and what strategies are they employing to maintain market relevance?
- What are the emerging trends and future prospects in the global PCA pumps market?
Competitive Intelligence and Business Strategy:
Leading players in the global PCA pumps market, including Becton, Dickinson and Company (BD), Baxter International, Smiths Medical, and ICU Medical, focus on innovation, product safety, and strategic collaborations to strengthen their market presence. These companies invest in R&D to develop advanced PCA pumps with improved accuracy, smart infusion technology, and integrated patient monitoring systems. Strategic partnerships with hospitals, research institutions, and pain management specialists enhance product adoption and market penetration. Additionally, investments in training programs and awareness campaigns help drive demand for PCA pumps in both developed and emerging markets.
Key Companies Profiled:
- Smiths Group plc.
- Fresenius Kabi Group
- Hospira
- Micrel Medical Devices,
- Ace Medical Co. Ltd.
- Terumo Corporation
- B.Braun Melsungen AG
- Baxter International
- Becton Dickinson and Company
- ICU Medical
Market Segments Covered in Patient-controlled Analgesic Pumps Market Analysis
By End Use
- Hospitals
- Specialty Clinics
- Ambulatory Surgical Centers
- Home Care Settings
By Type
- Electronic
- Mechanical
By Application
- Diabetes
- Oncology
- Gastroenterology
- Hematology
- Other Applications
By Region
- North America
- Latin America
- Europe
- APAC
- MEA
Table of Contents
1. Executive Summary
- 1.1. Global Market Outlook
- 1.2. Demand-side Trends
- 1.3. Supply-side Trends
- 1.4. Technology Roadmap Analysis
- 1.5. Analysis and Recommendations
2. Market Overview
- 2.1. Market Coverage / Taxonomy
- 2.2. Market Definition / Scope / Limitations
3. Market Background
- 3.1. Market Dynamics
- 3.1.1. Drivers
- 3.1.2. Restraints
- 3.1.3. Opportunity
- 3.1.4. Trends
- 3.2. Scenario Forecast
- 3.2.1. Demand in Optimistic Scenario
- 3.2.2. Demand in Likely Scenario
- 3.2.3. Demand in Conservative Scenario
- 3.3. Opportunity Map Analysis
- 3.4. Product Life Cycle Analysis
- 3.5. Supply Chain Analysis
- 3.5.1. Supply Side Participants and their Roles
- 3.5.1.1. Producers
- 3.5.1.2. Mid-Level Participants (Traders/ Agents/ Brokers)
- 3.5.1.3. Wholesalers and Distributors
- 3.5.2. Value Added and Value Created at Node in the Supply Chain
- 3.5.3. List of Raw Material Suppliers
- 3.5.4. List of Existing and Potential Buyer's
- 3.5.1. Supply Side Participants and their Roles
- 3.6. Investment Feasibility Matrix
- 3.7. Value Chain Analysis
- 3.7.1. Profit Margin Analysis
- 3.7.2. Wholesalers and Distributors
- 3.7.3. Retailers
- 3.8. PESTLE and Porter's Analysis
- 3.9. Regulatory Landscape
- 3.9.1. By Key Regions
- 3.9.2. By Key Countries
- 3.10. Regional Parent Market Outlook
- 3.11. Production and Consumption Statistics
- 3.12. Import and Export Statistics
4. Global Patient-controlled Analgesic Pumps Market Analysis 2019-2032
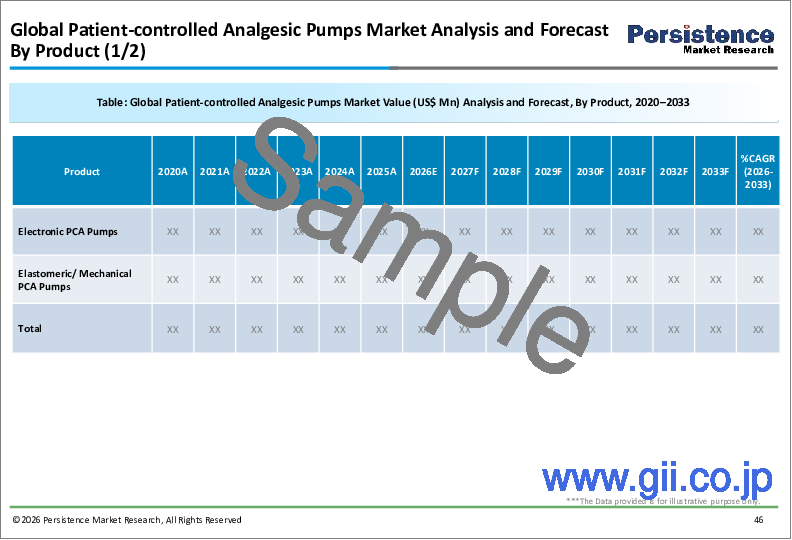
- 4.1. Historical Market Size Value (US$ Mn) & Volume (Units) Analysis, 2019-2024
- 4.2. Current and Future Market Size Value (US$ Mn) & Volume (Units) Projections, 2025-2032
- 4.2.1. Y-o-Y Growth Trend Analysis
- 4.2.2. Absolute $ Opportunity Analysis
5. Global Patient-controlled Analgesic Pumps Market Analysis 2019-2032, By Type
- 5.1. Introduction / Key Findings
- 5.2. Historical Market Size Value (US$ Mn) & Volume (Units) Analysis By Type, 2019-2024
- 5.3. Current and Future Market Size Value (US$ Mn) & Volume (Units) Analysis and Forecast By Type, 2025-2032
- 5.3.1. Electronic
- 5.3.2. Mechanical
- 5.4. Y-o-Y Growth Trend Analysis By Type, 2019-2024
- 5.5. Absolute $ Opportunity Analysis By Type, 2025-2032
6. Global Patient-controlled Analgesic Pumps Market Analysis 2019-2032, By Application
- 6.1. Introduction / Key Findings
- 6.2. Historical Market Size Value (US$ Mn) & Volume (Units) Analysis By Application, 2019-2024
- 6.3. Current and Future Market Size Value (US$ Mn) & Volume (Units) Analysis and Forecast By Application, 2025-2032
- 6.3.1. Diabetes
- 6.3.2. Oncology
- 6.3.3. Gastroenterology
- 6.3.4. Hematology
- 6.3.5. Other Applications
- 6.4. Y-o-Y Growth Trend Analysis By Application, 2019-2024
- 6.5. Absolute $ Opportunity Analysis By Application, 2025-2032
7. Global Patient-controlled Analgesic Pumps Market Analysis 2019-2032, By End-use
- 7.1. Introduction / Key Findings
- 7.2. Historical Market Size Value (US$ Mn) & Volume (Units) Analysis By End-use, 2019-2024
- 7.3. Current and Future Market Size Value (US$ Mn) & Volume (Units) Analysis and Forecast By End-use, 2025-2032
- 7.3.1. Hospitals
- 7.3.2. Specialty Clinics
- 7.3.3. Ambulatory Surgical Centers
- 7.3.4. Home Care Settings
- 7.4. Y-o-Y Growth Trend Analysis By End-use, 2019-2024
- 7.5. Absolute $ Opportunity Analysis By End-use, 2025-2032
8. Global Patient-controlled Analgesic Pumps Market Analysis 2019-2032, By Region
- 8.1. Introduction
- 8.2. Historical Market Size Value (US$ Mn) & Volume (Units) Analysis By Region, 2019-2024
- 8.3. Current Market Size Value (US$ Mn) & Volume (Units) Analysis and Forecast By Region, 2025-2032
- 8.3.1. North America
- 8.3.2. Latin America
- 8.3.3. Europe
- 8.3.4. Asia Pacific
- 8.3.5. MEA
- 8.4. Market Attractiveness Analysis By Region
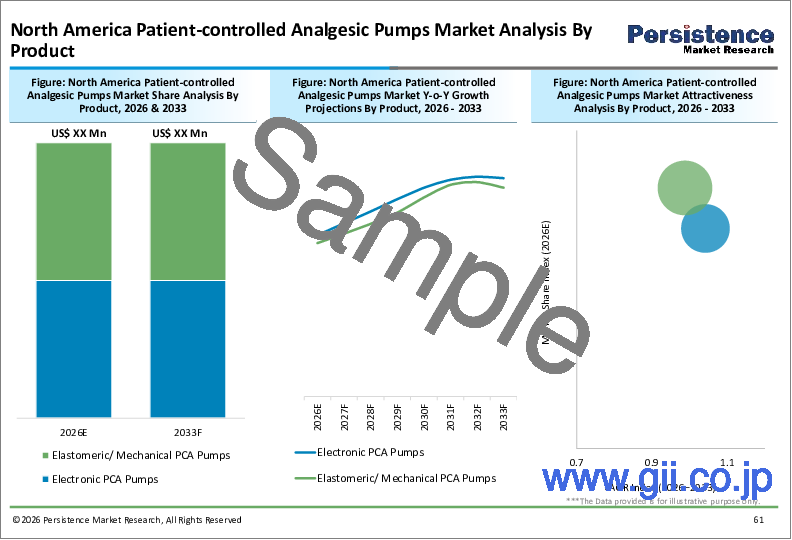
9. North America Patient-controlled Analgesic Pumps Market Analysis 2019-2032, By Country
- 9.1. Historical Market Size Value (US$ Mn) & Volume (Units) Trend Analysis By Market Taxonomy, 2019-2024
- 9.2. Market Size Value (US$ Mn) & Volume (Units) Forecast By Market Taxonomy, 2025-2032
- 9.2.1. By Country
- 9.2.1.1. Value (US$ Mn) & Volume (Units)ed States
- 9.2.1.2. Canada
- 9.2.2. By Type
- 9.2.3. By Application
- 9.2.4. By End-use
- 9.2.1. By Country
- 9.3. Market Attractiveness Analysis
- 9.3.1. By Country
- 9.3.2. By Type
- 9.3.3. By Application
- 9.3.4. By End-use
- 9.4. Key Takeaways
10. Latin America Patient-controlled Analgesic Pumps Market Analysis 2019-2032, By Country
- 10.1. Historical Market Size Value (US$ Mn) & Volume (Units) Trend Analysis By Market Taxonomy, 2019-2024
- 10.2. Market Size Value (US$ Mn) & Volume (Units) Forecast By Market Taxonomy, 2025-2032
- 10.2.1. By Country
- 10.2.1.1. Brazil
- 10.2.1.2. Mexico
- 10.2.1.3. Rest of Latin America
- 10.2.2. By Type
- 10.2.3. By Application
- 10.2.4. By End-use
- 10.2.1. By Country
- 10.3. Market Attractiveness Analysis
- 10.3.1. By Country
- 10.3.2. By Type
- 10.3.3. By Application
- 10.3.4. By End-use
- 10.4. Key Takeaways
11. Europe Patient-controlled Analgesic Pumps Market Analysis 2019-2032, By Country
- 11.1. Historical Market Size Value (US$ Mn) & Volume (Units) Trend Analysis By Market Taxonomy, 2019-2024
- 11.2. Market Size Value (US$ Mn) & Volume (Units) Forecast By Market Taxonomy, 2025-2032
- 11.2.1. By Country
- 11.2.1.1. Germany
- 11.2.1.2. U.K.
- 11.2.1.3. France
- 11.2.1.4. Spain
- 11.2.1.5. Italy
- 11.2.1.6. Russia
- 11.2.1.7. Rest of Europe
- 11.2.2. By Type
- 11.2.3. By Application
- 11.2.4. By End-use
- 11.2.1. By Country
- 11.3. Market Attractiveness Analysis
- 11.3.1. By Country
- 11.3.2. By Type
- 11.3.3. By Application
- 11.3.4. By End-use
- 11.4. Key Takeaways
12. Asia Pacific Patient-controlled Analgesic Pumps Market Analysis 2019-2032, By Country
- 12.1. Historical Market Size Value (US$ Mn) & Volume (Units) Trend Analysis By Market Taxonomy, 2019-2024
- 12.2. Market Size Value (US$ Mn) & Volume (Units) Forecast By Market Taxonomy, 2025-2032
- 12.2.1. By Country
- 12.2.1.1. China
- 12.2.1.2. Japan
- 12.2.1.3. India
- 12.2.1.4. South Korea
- 12.2.1.5. Australia
- 12.2.1.6. Rest of APAC
- 12.2.2. By Type
- 12.2.3. By Application
- 12.2.4. By End-use
- 12.2.1. By Country
- 12.3. Market Attractiveness Analysis
- 12.3.1. By Country
- 12.3.2. By Type
- 12.3.3. By Application
- 12.3.4. By End-use
- 12.4. Key Takeaways
13. MEA Patient-controlled Analgesic Pumps Market Analysis 2019-2032, By Country
- 13.1. Historical Market Size Value (US$ Mn) & Volume (Units) Trend Analysis By Market Taxonomy, 2019-2024
- 13.2. Market Size Value (US$ Mn) & Volume (Units) Forecast By Market Taxonomy, 2025-2032
- 13.2.1. By Country
- 13.2.1.1. South Africa
- 13.2.1.2. Saudi Arabia
- 13.2.1.3. UAE
- 13.2.1.4. Israel
- 13.2.1.5. Rest of MEA
- 13.2.2. By Type
- 13.2.3. By Application
- 13.2.4. By End-use
- 13.2.1. By Country
- 13.3. Market Attractiveness Analysis
- 13.3.1. By Country
- 13.3.2. By Type
- 13.3.3. By Application
- 13.3.4. By End-use
- 13.4. Key Takeaways
14. Key Countries Patient-controlled Analgesic Pumps Market Analysis
- 14.1. Value (US$ Mn) & Volume (Units)ed States
- 14.1.1. Pricing Analysis
- 14.1.2. Market Share Analysis, 2025
- 14.1.2.1. By Type
- 14.1.2.2. By Application
- 14.1.2.3. By End-use
- 14.2. Canada
- 14.2.1. Pricing Analysis
- 14.2.2. Market Share Analysis, 2025
- 14.2.2.1. By Type
- 14.2.2.2. By Application
- 14.2.2.3. By End-use
- 14.3. Brazil
- 14.3.1. Pricing Analysis
- 14.3.2. Market Share Analysis, 2025
- 14.3.2.1. By Type
- 14.3.2.2. By Application
- 14.3.2.3. By End-use
- 14.4. Mexico
- 14.4.1. Pricing Analysis
- 14.4.2. Market Share Analysis, 2025
- 14.4.2.1. By Type
- 14.4.2.2. By Application
- 14.4.2.3. By End-use
- 14.5. Germany
- 14.5.1. Pricing Analysis
- 14.5.2. Market Share Analysis, 2025
- 14.5.2.1. By Type
- 14.5.2.2. By Application
- 14.5.2.3. By End-use
- 14.6. U.K.
- 14.6.1. Pricing Analysis
- 14.6.2. Market Share Analysis, 2025
- 14.6.2.1. By Type
- 14.6.2.2. By Application
- 14.6.2.3. By End-use
- 14.7. France
- 14.7.1. Pricing Analysis
- 14.7.2. Market Share Analysis, 2025
- 14.7.2.1. By Type
- 14.7.2.2. By Application
- 14.7.2.3. By End-use
- 14.8. Spain
- 14.8.1. Pricing Analysis
- 14.8.2. Market Share Analysis, 2025
- 14.8.2.1. By Type
- 14.8.2.2. By Application
- 14.8.2.3. By End-use
- 14.9. Italy
- 14.9.1. Pricing Analysis
- 14.9.2. Market Share Analysis, 2025
- 14.9.2.1. By Type
- 14.9.2.2. By Application
- 14.9.2.3. By End-use
- 14.10. Russia
- 14.10.1. Pricing Analysis
- 14.10.2. Market Share Analysis, 2025
- 14.10.2.1. By Type
- 14.10.2.2. By Application
- 14.10.2.3. By End-use
- 14.11. China
- 14.11.1. Pricing Analysis
- 14.11.2. Market Share Analysis, 2025
- 14.11.2.1. By Type
- 14.11.2.2. By Application
- 14.11.2.3. By End-use
- 14.12. Japan
- 14.12.1. Pricing Analysis
- 14.12.2. Market Share Analysis, 2025
- 14.12.2.1. By Type
- 14.12.2.2. By Application
- 14.12.2.3. By End-use
- 14.13. India
- 14.13.1. Pricing Analysis
- 14.13.2. Market Share Analysis, 2025
- 14.13.2.1. By Type
- 14.13.2.2. By Application
- 14.13.2.3. By End-use
- 14.14. South Korea
- 14.14.1. Pricing Analysis
- 14.14.2. Market Share Analysis, 2025
- 14.14.2.1. By Type
- 14.14.2.2. By Application
- 14.14.2.3. By End-use
- 14.15. Australia
- 14.15.1. Pricing Analysis
- 14.15.2. Market Share Analysis, 2025
- 14.15.2.1. By Type
- 14.15.2.2. By Application
- 14.15.2.3. By End-use
- 14.16. South Africa
- 14.16.1. Pricing Analysis
- 14.16.2. Market Share Analysis, 2025
- 14.16.2.1. By Type
- 14.16.2.2. By Application
- 14.16.2.3. By End-use
- 14.17. Saudi Arabia
- 14.17.1. Pricing Analysis
- 14.17.2. Market Share Analysis, 2025
- 14.17.2.1. By Type
- 14.17.2.2. By Application
- 14.17.2.3. By End-use
- 14.18. UAE
- 14.18.1. Pricing Analysis
- 14.18.2. Market Share Analysis, 2025
- 14.18.2.1. By Type
- 14.18.2.2. By Application
- 14.18.2.3. By End-use
- 14.19. Israel
- 14.19.1. Pricing Analysis
- 14.19.2. Market Share Analysis, 2025
- 14.19.2.1. By Type
- 14.19.2.2. By Application
- 14.19.2.3. By End-use
15. Market Structure Analysis
- 15.1. Competition Dashboard
- 15.2. Competition Benchmarking
- 15.3. Market Share Analysis of Top Players
- 15.3.1. By Regional
- 15.3.2. By Type
- 15.3.3. By Application
- 15.3.4. By End-use
16. Competition Analysis
- 16.1. Competition Deep Dive
- 16.1.1. Smiths Group plc
- 16.1.1.1. Overview
- 16.1.1.2. Product Portfolio
- 16.1.1.3. Profitability by Market Segments
- 16.1.1.4. Sales Footprint
- 16.1.1.5. Strategy Overview
- 16.1.1.5.1. Marketing Strategy
- 16.1.1.5.2. Product Strategy
- 16.1.1.5.3. Channel Strategy
- 16.1.2. Fresenius SE & Co KGaA
- 16.1.2.1. Overview
- 16.1.2.2. Product Portfolio
- 16.1.2.3. Profitability by Market Segments
- 16.1.2.4. Sales Footprint
- 16.1.2.5. Strategy Overview
- 16.1.2.5.1. Marketing Strategy
- 16.1.2.5.2. Product Strategy
- 16.1.2.5.3. Channel Strategy
- 16.1.3. B. Braun Melsungen AG
- 16.1.3.1. Overview
- 16.1.3.2. Product Portfolio
- 16.1.3.3. Profitability by Market Segments
- 16.1.3.4. Sales Footprint
- 16.1.3.5. Strategy Overview
- 16.1.3.5.1. Marketing Strategy
- 16.1.3.5.2. Product Strategy
- 16.1.3.5.3. Channel Strategy
- 16.1.4. Baxter International Inc.
- 16.1.4.1. Overview
- 16.1.4.2. Product Portfolio
- 16.1.4.3. Profitability by Market Segments
- 16.1.4.4. Sales Footprint
- 16.1.4.5. Strategy Overview
- 16.1.4.5.1. Marketing Strategy
- 16.1.4.5.2. Product Strategy
- 16.1.4.5.3. Channel Strategy
- 16.1.5. Becton, Dickinson and Company
- 16.1.5.1. Overview
- 16.1.5.2. Product Portfolio
- 16.1.5.3. Profitability by Market Segments
- 16.1.5.4. Sales Footprint
- 16.1.5.5. Strategy Overview
- 16.1.5.5.1. Marketing Strategy
- 16.1.5.5.2. Product Strategy
- 16.1.5.5.3. Channel Strategy
- 16.1.6. ICU Medical, Inc.
- 16.1.6.1. Overview
- 16.1.6.2. Product Portfolio
- 16.1.6.3. Profitability by Market Segments
- 16.1.6.4. Sales Footprint
- 16.1.6.5. Strategy Overview
- 16.1.6.5.1. Marketing Strategy
- 16.1.6.5.2. Product Strategy
- 16.1.6.5.3. Channel Strategy
- 16.1.7. ACE Medical
- 16.1.7.1. Overview
- 16.1.7.2. Product Portfolio
- 16.1.7.3. Profitability by Market Segments
- 16.1.7.4. Sales Footprint
- 16.1.7.5. Strategy Overview
- 16.1.7.5.1. Marketing Strategy
- 16.1.7.5.2. Product Strategy
- 16.1.7.5.3. Channel Strategy
- 16.1.8. Terumo Corporation
- 16.1.8.1. Overview
- 16.1.8.2. Product Portfolio
- 16.1.8.3. Profitability by Market Segments
- 16.1.8.4. Sales Footprint
- 16.1.8.5. Strategy Overview
- 16.1.8.5.1. Marketing Strategy
- 16.1.8.5.2. Product Strategy
- 16.1.8.5.3. Channel Strategy
- 16.1.9. Pfizer Inc
- 16.1.9.1. Overview
- 16.1.9.2. Product Portfolio
- 16.1.9.3. Profitability by Market Segments
- 16.1.9.4. Sales Footprint
- 16.1.9.5. Strategy Overview
- 16.1.9.5.1. Marketing Strategy
- 16.1.9.5.2. Product Strategy
- 16.1.9.5.3. Channel Strategy
- 16.1.1. Smiths Group plc


