|
|
市場調査レポート
商品コード
1233460
防弾複合材料の世界市場調査:軍事費の急増により防弾複合材料需要の大きな成長が見込まれるGlobal Market Study on Ballistic Composites: Surging Military expenditure promises significant growth in demand for Ballistic Composites |
||||||
|
|
|||||||
|
● お客様のご希望に応じて、既存データの加工や未掲載情報(例:国別セグメント)の追加などの対応が可能です。 詳細はお問い合わせください。 |
|||||||


| 防弾複合材料の世界市場調査:軍事費の急増により防弾複合材料需要の大きな成長が見込まれる |
|
出版日: 2023年01月16日
発行: Persistence Market Research
ページ情報: 英文 250 Pages
納期: 2~5営業日
|
- 全表示
- 概要
- 図表
- 目次
当レポートでは、世界の防弾複合材料市場について調査分析し、市場動向、地域とセグメントごとの分析と予測、競合分析などを提供しています。
目次
第1章 エグゼクティブサマリー
第2章 市場の概要
- 市場の範囲/分類法
- 市場の定義/範囲/制限
第3章 市場の背景
- 市場力学
- 促進要因
- 抑制要因
- 機会
- 動向
- シナリオ予測
- 楽観的なシナリオでの需要
- 可能性の高いシナリオでの需要
- 保守的なシナリオでの需要
- 機会マップ分析
- 製品ライフサイクル分析
- サプライチェーン分析
- サプライサイドの参入企業とその役割
- サプライチェーンのノードにおいて創出される価値と付加される価値
- 原材料サプライヤーのリスト
- 既存および潜在的なバイヤーのリスト
- 投資実現可能性マトリックス
- バリューチェーン分析
- 利益率分析
- 卸売業者・売業者
- 小売業者
- PESTLE・ポーターのファイブフォース分析
- 規制情勢
- 地域の親市場の見通し
- 生産と消費の統計
- 輸入と輸出の統計
第4章 世界の防弾複合材料市場の分析と予測
- 過去の市場規模と分析
- 現在と将来の市場規模と予測
- 前年比成長動向の分析
第5章 世界の防弾複合材料市場の分析と予測:繊維タイプ別
- イントロダクション/主な調査結果
- 過去の市場規模と分析:繊維タイプ別
- 現在と将来の市場規模、分析、予測:繊維タイプ別
- アラミド繊維
- UHMPE
- ガラス
- その他の繊維タイプ
- 前年比成長動向の分析:繊維タイプ別
第6章 世界の防弾複合材料市場の分析と予測:マトリックスタイプ別
- イントロダクション/主な調査結果
- 過去の市場規模と分析:マトリックスタイプ別
- 現在と将来の市場規模、分析、予測:マトリックスタイプ別
- ポリマーマトリックス
- ポリマーセラミック
- メタルマトリックス
- 前年比成長動向の分析:マトリックスタイプ別
第7章 世界の防弾複合材料市場の分析と予測:用途別
- イントロダクション/主な調査結果
- 過去の市場規模と分析:用途別
- 現在と将来の市場規模、分析、予測:用途別
- 車両の装甲
- 胴体の装甲
- ヘルメット、顔の保護
- その他の用途
- 前年比成長動向の分析:用途別
第8章 世界の防弾複合材料市場の分析と予測:地域別
- イントロダクション
- 過去の市場規模と分析:地域別
- 現在の市場規模、分析、予測:地域別
- 北米
- ラテンアメリカ
- 欧州
- アジア太平洋
- 中東・アフリカ
- 市場魅力の分析:地域別
第9章 北米の防弾複合材料市場の分析と予測:国別
- 過去の市場規模と動向の分析:市場分類別
- 市場規模と予測:市場分類別
- 市場魅力の分析
- 重要事項
第10章 ラテンアメリカの防弾複合材料市場の分析と予測:国別
- 過去の市場規模と動向の分析:市場分類別
- 市場規模と予測:市場分類別
- 市場魅力の分析
- 重要事項
第11章 欧州の防弾複合材料市場の分析と予測:国別
- 過去の市場規模と動向の分析:市場分類別
- 市場規模と予測:市場分類別
- 市場魅力の分析
- 重要事項
第12章 アジア太平洋の防弾複合材料市場の分析と予測:国別
- 過去の市場規模と動向の分析:市場分類別
- 市場規模と予測:市場分類別
- 市場魅力の分析
- 重要事項
第13章 中東・アフリカの防弾複合材料市場の分析と予測:国別
- 過去の市場規模と動向の分析:市場分類別
- 市場規模と予測:市場分類別
- 市場魅力の分析
- 重要事項
第14章 主要国の防弾複合材料市場の分析
- 米国
- カナダ
- ブラジル
- メキシコ
- ドイツ
- 英国
- フランス
- スペイン
- イタリア
- 中国
- 日本
- 韓国
- マレーシア
- シンガポール
- オーストラリア
- ニュージーランド
- GCC諸国
- 南アフリカ
- イスラエル
第15章 市場構造分析
- 競合ダッシュボード
- 競合ベンチマーク
- 主要企業の市場シェアの分析
第16章 競合分析
- 競合の詳細
- Honeywell International Inc
- BAE Systems
- DSM
- Morgan Advanced Materials
- Gaffco ballistic
- Teijin Aramid B.V.
- DuPont
- Barrday Inc
- Plastic Reinforcement Fabrics Ltd
- M Cubed Technologies
第17章 前提条件と頭字語の使用
第18章 調査手法
List of Tables
- Table 1: Global Ballistic Composites Market Value (US$ Mn) Forecast by Region, 2018-2033
- Table 2: Global Ballistic Composites Market Volume (Mole) Forecast by Region, 2018-2033
- Table 3: Global Ballistic Composites Market Value (US$ Mn) Forecast by Fiber Type, 2018-2033
- Table 4: Global Ballistic Composites Market Volume (Mole) Forecast by Fiber Type, 2018-2033
- Table 5: Global Ballistic Composites Market Value (US$ Mn) Forecast by Matrix Type, 2018-2033
- Table 6: Global Ballistic Composites Market Volume (Mole) Forecast by Matrix Type, 2018-2033
- Table 7: Global Ballistic Composites Market Value (US$ Mn) Forecast by Application, 2018-2033
- Table 8: Global Ballistic Composites Market Volume (Mole) Forecast by Application, 2018-2033
- Table 9: North America Ballistic Composites Market Value (US$ Mn) Forecast by Country, 2018-2033
- Table 10: North America Ballistic Composites Market Volume (Mole) Forecast by Country, 2018-2033
- Table 11: North America Ballistic Composites Market Value (US$ Mn) Forecast by Fiber Type, 2018-2033
- Table 12: North America Ballistic Composites Market Volume (Mole) Forecast by Fiber Type, 2018-2033
- Table 13: North America Ballistic Composites Market Value (US$ Mn) Forecast by Matrix Type, 2018-2033
- Table 14: North America Ballistic Composites Market Volume (Mole) Forecast by Matrix Type, 2018-2033
- Table 15: North America Ballistic Composites Market Value (US$ Mn) Forecast by Application, 2018-2033
- Table 16: North America Ballistic Composites Market Volume (Mole) Forecast by Application, 2018-2033
- Table 17: Latin America Ballistic Composites Market Value (US$ Mn) Forecast by Country, 2018-2033
- Table 18: Latin America Ballistic Composites Market Volume (Mole) Forecast by Country, 2018-2033
- Table 19: Latin America Ballistic Composites Market Value (US$ Mn) Forecast by Fiber Type, 2018-2033
- Table 20: Latin America Ballistic Composites Market Volume (Mole) Forecast by Fiber Type, 2018-2033
- Table 21: Latin America Ballistic Composites Market Value (US$ Mn) Forecast by Matrix Type, 2018-2033
- Table 22: Latin America Ballistic Composites Market Volume (Mole) Forecast by Matrix Type, 2018-2033
- Table 23: Latin America Ballistic Composites Market Value (US$ Mn) Forecast by Application, 2018-2033
- Table 24: Latin America Ballistic Composites Market Volume (Mole) Forecast by Application, 2018-2033
- Table 25: Europe Ballistic Composites Market Value (US$ Mn) Forecast by Country, 2018-2033
- Table 26: Europe Ballistic Composites Market Volume (Mole) Forecast by Country, 2018-2033
- Table 27: Europe Ballistic Composites Market Value (US$ Mn) Forecast by Fiber Type, 2018-2033
- Table 28: Europe Ballistic Composites Market Volume (Mole) Forecast by Fiber Type, 2018-2033
- Table 29: Europe Ballistic Composites Market Value (US$ Mn) Forecast by Matrix Type, 2018-2033
- Table 30: Europe Ballistic Composites Market Volume (Mole) Forecast by Matrix Type, 2018-2033
- Table 31: Europe Ballistic Composites Market Value (US$ Mn) Forecast by Application, 2018-2033
- Table 32: Europe Ballistic Composites Market Volume (Mole) Forecast by Application, 2018-2033
- Table 33: Asia Pacific Ballistic Composites Market Value (US$ Mn) Forecast by Country, 2018-2033
- Table 34: Asia Pacific Ballistic Composites Market Volume (Mole) Forecast by Country, 2018-2033
- Table 35: Asia Pacific Ballistic Composites Market Value (US$ Mn) Forecast by Fiber Type, 2018-2033
- Table 36: Asia Pacific Ballistic Composites Market Volume (Mole) Forecast by Fiber Type, 2018-2033
- Table 37: Asia Pacific Ballistic Composites Market Value (US$ Mn) Forecast by Matrix Type, 2018-2033
- Table 38: Asia Pacific Ballistic Composites Market Volume (Mole) Forecast by Matrix Type, 2018-2033
- Table 39: Asia Pacific Ballistic Composites Market Value (US$ Mn) Forecast by Application, 2018-2033
- Table 40: Asia Pacific Ballistic Composites Market Volume (Mole) Forecast by Application, 2018-2033
- Table 41: MEA Ballistic Composites Market Value (US$ Mn) Forecast by Country, 2018-2033
- Table 42: MEA Ballistic Composites Market Volume (Mole) Forecast by Country, 2018-2033
- Table 43: MEA Ballistic Composites Market Value (US$ Mn) Forecast by Fiber Type, 2018-2033
- Table 44: MEA Ballistic Composites Market Volume (Mole) Forecast by Fiber Type, 2018-2033
- Table 45: MEA Ballistic Composites Market Value (US$ Mn) Forecast by Matrix Type, 2018-2033
- Table 46: MEA Ballistic Composites Market Volume (Mole) Forecast by Matrix Type, 2018-2033
- Table 47: MEA Ballistic Composites Market Value (US$ Mn) Forecast by Application, 2018-2033
- Table 48: MEA Ballistic Composites Market Volume (Mole) Forecast by Application, 2018-2033
List of Figures
- Figure 1: Global Ballistic Composites Market Value (US$ Mn) by Fiber Type, 2023-2033
- Figure 2: Global Ballistic Composites Market Value (US$ Mn) by Matrix Type, 2023-2033
- Figure 3: Global Ballistic Composites Market Value (US$ Mn) by Application, 2023-2033
- Figure 4: Global Ballistic Composites Market Value (US$ Mn) by Region, 2023-2033
- Figure 5: Global Ballistic Composites Market Value (US$ Mn) Analysis by Region, 2018-2033
- Figure 6: Global Ballistic Composites Market Volume (Mole) Analysis by Region, 2018-2033
- Figure 7: Global Ballistic Composites Market Value Share (%) and BPS Analysis by Region, 2023-2033
- Figure 8: Global Ballistic Composites Market Y-o-Y Growth (%) Projections by Region, 2023-2033
- Figure 9: Global Ballistic Composites Market Value (US$ Mn) Analysis by Fiber Type, 2018-2033
- Figure 10: Global Ballistic Composites Market Volume (Mole) Analysis by Fiber Type, 2018-2033
- Figure 11: Global Ballistic Composites Market Value Share (%) and BPS Analysis by Fiber Type, 2023-2033
- Figure 12: Global Ballistic Composites Market Y-o-Y Growth (%) Projections by Fiber Type, 2023-2033
- Figure 13: Global Ballistic Composites Market Value (US$ Mn) Analysis by Matrix Type, 2018-2033
- Figure 14: Global Ballistic Composites Market Volume (Mole) Analysis by Matrix Type, 2018-2033
- Figure 15: Global Ballistic Composites Market Value Share (%) and BPS Analysis by Matrix Type, 2023-2033
- Figure 16: Global Ballistic Composites Market Y-o-Y Growth (%) Projections by Matrix Type, 2023-2033
- Figure 17: Global Ballistic Composites Market Value (US$ Mn) Analysis by Application, 2018-2033
- Figure 18: Global Ballistic Composites Market Volume (Mole) Analysis by Application, 2018-2033
- Figure 19: Global Ballistic Composites Market Value Share (%) and BPS Analysis by Application, 2023-2033
- Figure 20: Global Ballistic Composites Market Y-o-Y Growth (%) Projections by Application, 2023-2033
- Figure 21: Global Ballistic Composites Market Attractiveness by Fiber Type, 2023-2033
- Figure 22: Global Ballistic Composites Market Attractiveness by Matrix Type, 2023-2033
- Figure 23: Global Ballistic Composites Market Attractiveness by Application, 2023-2033
- Figure 24: Global Ballistic Composites Market Attractiveness by Region, 2023-2033
- Figure 25: North America Ballistic Composites Market Value (US$ Mn) by Fiber Type, 2023-2033
- Figure 26: North America Ballistic Composites Market Value (US$ Mn) by Matrix Type, 2023-2033
- Figure 27: North America Ballistic Composites Market Value (US$ Mn) by Application, 2023-2033
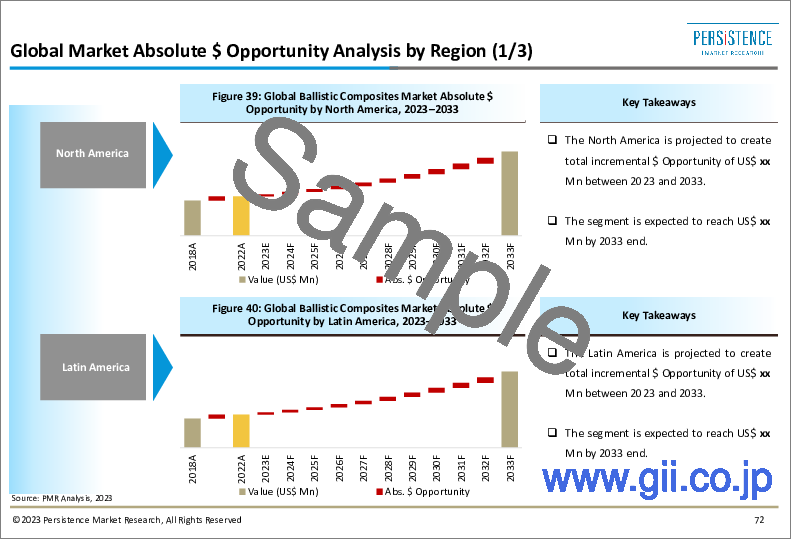
- Figure 28: North America Ballistic Composites Market Value (US$ Mn) by Country, 2023-2033
- Figure 29: North America Ballistic Composites Market Value (US$ Mn) Analysis by Country, 2018-2033
- Figure 30: North America Ballistic Composites Market Volume (Mole) Analysis by Country, 2018-2033
- Figure 31: North America Ballistic Composites Market Value Share (%) and BPS Analysis by Country, 2023-2033
- Figure 32: North America Ballistic Composites Market Y-o-Y Growth (%) Projections by Country, 2023-2033
- Figure 33: North America Ballistic Composites Market Value (US$ Mn) Analysis by Fiber Type, 2018-2033
- Figure 34: North America Ballistic Composites Market Volume (Mole) Analysis by Fiber Type, 2018-2033
- Figure 35: North America Ballistic Composites Market Value Share (%) and BPS Analysis by Fiber Type, 2023-2033
- Figure 36: North America Ballistic Composites Market Y-o-Y Growth (%) Projections by Fiber Type, 2023-2033
- Figure 37: North America Ballistic Composites Market Value (US$ Mn) Analysis by Matrix Type, 2018-2033
- Figure 38: North America Ballistic Composites Market Volume (Mole) Analysis by Matrix Type, 2018-2033
- Figure 39: North America Ballistic Composites Market Value Share (%) and BPS Analysis by Matrix Type, 2023-2033
- Figure 40: North America Ballistic Composites Market Y-o-Y Growth (%) Projections by Matrix Type, 2023-2033
- Figure 41: North America Ballistic Composites Market Value (US$ Mn) Analysis by Application, 2018-2033
- Figure 42: North America Ballistic Composites Market Volume (Mole) Analysis by Application, 2018-2033
- Figure 43: North America Ballistic Composites Market Value Share (%) and BPS Analysis by Application, 2023-2033
- Figure 44: North America Ballistic Composites Market Y-o-Y Growth (%) Projections by Application, 2023-2033
- Figure 45: North America Ballistic Composites Market Attractiveness by Fiber Type, 2023-2033
- Figure 46: North America Ballistic Composites Market Attractiveness by Matrix Type, 2023-2033
- Figure 47: North America Ballistic Composites Market Attractiveness by Application, 2023-2033
- Figure 48: North America Ballistic Composites Market Attractiveness by Country, 2023-2033
- Figure 49: Latin America Ballistic Composites Market Value (US$ Mn) by Fiber Type, 2023-2033
- Figure 50: Latin America Ballistic Composites Market Value (US$ Mn) by Matrix Type, 2023-2033
- Figure 51: Latin America Ballistic Composites Market Value (US$ Mn) by Application, 2023-2033
- Figure 52: Latin America Ballistic Composites Market Value (US$ Mn) by Country, 2023-2033
- Figure 53: Latin America Ballistic Composites Market Value (US$ Mn) Analysis by Country, 2018-2033
- Figure 54: Latin America Ballistic Composites Market Volume (Mole) Analysis by Country, 2018-2033
- Figure 55: Latin America Ballistic Composites Market Value Share (%) and BPS Analysis by Country, 2023-2033
- Figure 56: Latin America Ballistic Composites Market Y-o-Y Growth (%) Projections by Country, 2023-2033
- Figure 57: Latin America Ballistic Composites Market Value (US$ Mn) Analysis by Fiber Type, 2018-2033
- Figure 58: Latin America Ballistic Composites Market Volume (Mole) Analysis by Fiber Type, 2018-2033
- Figure 59: Latin America Ballistic Composites Market Value Share (%) and BPS Analysis by Fiber Type, 2023-2033
- Figure 60: Latin America Ballistic Composites Market Y-o-Y Growth (%) Projections by Fiber Type, 2023-2033
- Figure 61: Latin America Ballistic Composites Market Value (US$ Mn) Analysis by Matrix Type, 2018-2033
- Figure 62: Latin America Ballistic Composites Market Volume (Mole) Analysis by Matrix Type, 2018-2033
- Figure 63: Latin America Ballistic Composites Market Value Share (%) and BPS Analysis by Matrix Type, 2023-2033
- Figure 64: Latin America Ballistic Composites Market Y-o-Y Growth (%) Projections by Matrix Type, 2023-2033
- Figure 65: Latin America Ballistic Composites Market Value (US$ Mn) Analysis by Application, 2018-2033
- Figure 66: Latin America Ballistic Composites Market Volume (Mole) Analysis by Application, 2018-2033
- Figure 67: Latin America Ballistic Composites Market Value Share (%) and BPS Analysis by Application, 2023-2033
- Figure 68: Latin America Ballistic Composites Market Y-o-Y Growth (%) Projections by Application, 2023-2033
- Figure 69: Latin America Ballistic Composites Market Attractiveness by Fiber Type, 2023-2033
- Figure 70: Latin America Ballistic Composites Market Attractiveness by Matrix Type, 2023-2033
- Figure 71: Latin America Ballistic Composites Market Attractiveness by Application, 2023-2033
- Figure 72: Latin America Ballistic Composites Market Attractiveness by Country, 2023-2033
- Figure 73: Europe Ballistic Composites Market Value (US$ Mn) by Fiber Type, 2023-2033
- Figure 74: Europe Ballistic Composites Market Value (US$ Mn) by Matrix Type, 2023-2033
- Figure 75: Europe Ballistic Composites Market Value (US$ Mn) by Application, 2023-2033
- Figure 76: Europe Ballistic Composites Market Value (US$ Mn) by Country, 2023-2033
- Figure 77: Europe Ballistic Composites Market Value (US$ Mn) Analysis by Country, 2018-2033
- Figure 78: Europe Ballistic Composites Market Volume (Mole) Analysis by Country, 2018-2033
- Figure 79: Europe Ballistic Composites Market Value Share (%) and BPS Analysis by Country, 2023-2033
- Figure 80: Europe Ballistic Composites Market Y-o-Y Growth (%) Projections by Country, 2023-2033
- Figure 81: Europe Ballistic Composites Market Value (US$ Mn) Analysis by Fiber Type, 2018-2033
- Figure 82: Europe Ballistic Composites Market Volume (Mole) Analysis by Fiber Type, 2018-2033
- Figure 83: Europe Ballistic Composites Market Value Share (%) and BPS Analysis by Fiber Type, 2023-2033
- Figure 84: Europe Ballistic Composites Market Y-o-Y Growth (%) Projections by Fiber Type, 2023-2033
- Figure 85: Europe Ballistic Composites Market Value (US$ Mn) Analysis by Matrix Type, 2018-2033
- Figure 86: Europe Ballistic Composites Market Volume (Mole) Analysis by Matrix Type, 2018-2033
- Figure 87: Europe Ballistic Composites Market Value Share (%) and BPS Analysis by Matrix Type, 2023-2033
- Figure 88: Europe Ballistic Composites Market Y-o-Y Growth (%) Projections by Matrix Type, 2023-2033
- Figure 89: Europe Ballistic Composites Market Value (US$ Mn) Analysis by Application, 2018-2033
- Figure 90: Europe Ballistic Composites Market Volume (Mole) Analysis by Application, 2018-2033
- Figure 91: Europe Ballistic Composites Market Value Share (%) and BPS Analysis by Application, 2023-2033
- Figure 92: Europe Ballistic Composites Market Y-o-Y Growth (%) Projections by Application, 2023-2033
- Figure 93: Europe Ballistic Composites Market Attractiveness by Fiber Type, 2023-2033
- Figure 94: Europe Ballistic Composites Market Attractiveness by Matrix Type, 2023-2033
- Figure 95: Europe Ballistic Composites Market Attractiveness by Application, 2023-2033
- Figure 96: Europe Ballistic Composites Market Attractiveness by Country, 2023-2033
- Figure 97: Asia Pacific Ballistic Composites Market Value (US$ Mn) by Fiber Type, 2023-2033
- Figure 98: Asia Pacific Ballistic Composites Market Value (US$ Mn) by Matrix Type, 2023-2033
- Figure 99: Asia Pacific Ballistic Composites Market Value (US$ Mn) by Application, 2023-2033
- Figure 100: Asia Pacific Ballistic Composites Market Value (US$ Mn) by Country, 2023-2033
- Figure 101: Asia Pacific Ballistic Composites Market Value (US$ Mn) Analysis by Country, 2018-2033
- Figure 102: Asia Pacific Ballistic Composites Market Volume (Mole) Analysis by Country, 2018-2033
- Figure 103: Asia Pacific Ballistic Composites Market Value Share (%) and BPS Analysis by Country, 2023-2033
- Figure 104: Asia Pacific Ballistic Composites Market Y-o-Y Growth (%) Projections by Country, 2023-2033
- Figure 105: Asia Pacific Ballistic Composites Market Value (US$ Mn) Analysis by Fiber Type, 2018-2033
- Figure 106: Asia Pacific Ballistic Composites Market Volume (Mole) Analysis by Fiber Type, 2018-2033
- Figure 107: Asia Pacific Ballistic Composites Market Value Share (%) and BPS Analysis by Fiber Type, 2023-2033
- Figure 108: Asia Pacific Ballistic Composites Market Y-o-Y Growth (%) Projections by Fiber Type, 2023-2033
- Figure 109: Asia Pacific Ballistic Composites Market Value (US$ Mn) Analysis by Matrix Type, 2018-2033
- Figure 110: Asia Pacific Ballistic Composites Market Volume (Mole) Analysis by Matrix Type, 2018-2033
- Figure 111: Asia Pacific Ballistic Composites Market Value Share (%) and BPS Analysis by Matrix Type, 2023-2033
- Figure 112: Asia Pacific Ballistic Composites Market Y-o-Y Growth (%) Projections by Matrix Type, 2023-2033
- Figure 113: Asia Pacific Ballistic Composites Market Value (US$ Mn) Analysis by Application, 2018-2033
- Figure 114: Asia Pacific Ballistic Composites Market Volume (Mole) Analysis by Application, 2018-2033
- Figure 115: Asia Pacific Ballistic Composites Market Value Share (%) and BPS Analysis by Application, 2023-2033
- Figure 116: Asia Pacific Ballistic Composites Market Y-o-Y Growth (%) Projections by Application, 2023-2033
- Figure 117: Asia Pacific Ballistic Composites Market Attractiveness by Fiber Type, 2023-2033
- Figure 118: Asia Pacific Ballistic Composites Market Attractiveness by Matrix Type, 2023-2033
- Figure 119: Asia Pacific Ballistic Composites Market Attractiveness by Application, 2023-2033
- Figure 120: Asia Pacific Ballistic Composites Market Attractiveness by Country, 2023-2033
- Figure 121: MEA Ballistic Composites Market Value (US$ Mn) by Fiber Type, 2023-2033
- Figure 122: MEA Ballistic Composites Market Value (US$ Mn) by Matrix Type, 2023-2033
- Figure 123: MEA Ballistic Composites Market Value (US$ Mn) by Application, 2023-2033
- Figure 124: MEA Ballistic Composites Market Value (US$ Mn) by Country, 2023-2033
- Figure 125: MEA Ballistic Composites Market Value (US$ Mn) Analysis by Country, 2018-2033
- Figure 126: MEA Ballistic Composites Market Volume (Mole) Analysis by Country, 2018-2033
- Figure 127: MEA Ballistic Composites Market Value Share (%) and BPS Analysis by Country, 2023-2033
- Figure 128: MEA Ballistic Composites Market Y-o-Y Growth (%) Projections by Country, 2023-2033
- Figure 129: MEA Ballistic Composites Market Value (US$ Mn) Analysis by Fiber Type, 2018-2033
- Figure 130: MEA Ballistic Composites Market Volume (Mole) Analysis by Fiber Type, 2018-2033
- Figure 131: MEA Ballistic Composites Market Value Share (%) and BPS Analysis by Fiber Type, 2023-2033
- Figure 132: MEA Ballistic Composites Market Y-o-Y Growth (%) Projections by Fiber Type, 2023-2033
- Figure 133: MEA Ballistic Composites Market Value (US$ Mn) Analysis by Matrix Type, 2018-2033
- Figure 134: MEA Ballistic Composites Market Volume (Mole) Analysis by Matrix Type, 2018-2033
- Figure 135: MEA Ballistic Composites Market Value Share (%) and BPS Analysis by Matrix Type, 2023-2033
- Figure 136: MEA Ballistic Composites Market Y-o-Y Growth (%) Projections by Matrix Type, 2023-2033
- Figure 137: MEA Ballistic Composites Market Value (US$ Mn) Analysis by Application, 2018-2033
- Figure 138: MEA Ballistic Composites Market Volume (Mole) Analysis by Application, 2018-2033
- Figure 139: MEA Ballistic Composites Market Value Share (%) and BPS Analysis by Application, 2023-2033
- Figure 140: MEA Ballistic Composites Market Y-o-Y Growth (%) Projections by Application, 2023-2033
- Figure 141: MEA Ballistic Composites Market Attractiveness by Fiber Type, 2023-2033
- Figure 142: MEA Ballistic Composites Market Attractiveness by Matrix Type, 2023-2033
- Figure 143: MEA Ballistic Composites Market Attractiveness by Application, 2023-2033
- Figure 144: MEA Ballistic Composites Market Attractiveness by Country, 2023-2033
Global Ballistic Composites Market: Global Industry Analysis 2018-2022 and Opportunity Assessment 2023-2033
A recent market study published by Persistence Market Research on the Ballistic composites market offers global industry analysis for 2018-2022 and opportunity assessment for 2023-2033. The study offers a comprehensive assessment of the most important market dynamics. After conducting a thorough research on the historical, as well as current growth parameters, the growth prospects of the market are obtained with maximum precision.
Market Segmentation
The global Ballistic composites market is segmented in detail to cover every aspect of the market and present complete market intelligence to readers.
By Fiber Type
Aramid Fibers
UHMPE
Glass
Other Fiber Types
By Matrix Type
Polymer Matrix
Polymer Ceramic
Metal Matrix
By Application
Vehicle Armor
Body Armor
Helmet & Face Protection
Other Applications
By Region
North America
Latin America
Europe
Asia Pacific
Middle East and Africa
Report Chapters:
Chapter 01 - Executive Summary
- The executive summary of the Ballistic composites market includes the global market analysis, proprietary wheel of fortune, demand-side and supply-side trends, opportunity assessment, and recommendations on the global Ballistic composites market.
Chapter 02 - Market Overview
- Readers can find the detailed segmentation and definition of the Ballistic composites market in this chapter, which will help them understand basic information about the Ballistic composites market. This section also highlights the inclusions and exclusions, which help the reader to understand the scope of the Ballistic composites market report.
Chapter 03 - Market Background
- The associated industry assessment of the global Ballistic composites market is carried out in this section. In addition, this chapter explains key macroeconomic factors that are expected to influence the growth of the global Ballistic composites market over the forecast period. Along with macroeconomic factors, this section also highlights the opportunity analysis, social media sentiment analysis, and consumer behavior analysis for the market. It provides key market dynamics of the Ballistic composites market, which include drivers, restraints, and opportunities.
Chapter 04 - Global Ballistic Composites Market Demand Analysis 2018-2022 and Forecast, 2023-2033
- This section provides detailed analysis of the historical custom Ballistic composites market value, along with an opportunity analysis of the future. Readers can also find the incremental opportunity for the current year (2022-2023) and an absolute opportunity for the forecast period (2023-2033).
Chapter 05 - Global Ballistic Composites Market Analysis 2018-2022 and Forecast 2023-2033, by Product Type
- Based on Fiber Type, the Ballistic composites market is segmented into Aramid, UHMPE, Glass, and other Fiber types. In this chapter, readers can find market attractiveness analysis, based on product type.
Chapter 06 - Global Ballistic Composites Market Analysis 2018-2022 and Forecast 2023-2033, by Application
- This chapter provides details about the Ballistic composites market on the basis of application which is segmented into Vehicle Armor, Body Armor, Helmet & Face Protection, and other application with market attractiveness analysis.
Chapter 07 - Global Security Market Analysis 2018-2022 and Opportunity Assessment 2023-2033 by Region
- This chapter explains how the Ballistic composites market will grow across various geographic regions, such as North America, Latin America, Europe, Asia Pacific, and the Middle East and Africa (MEA).
Chapter 08 - North America Ballistic Composites Market Analysis 2018-2022 and Forecast 2023-2033
- This chapter includes a detailed analysis of the growth of the Ballistic composites market in the North America region, along with a country-wise assessment that includes the U.S. and Canada. Readers can also find regional trends, opportunities, and market growth in the North America region.
Chapter 09 - Latin America Ballistic Composites Market Analysis 2018-2022 and Forecast 2023-2033
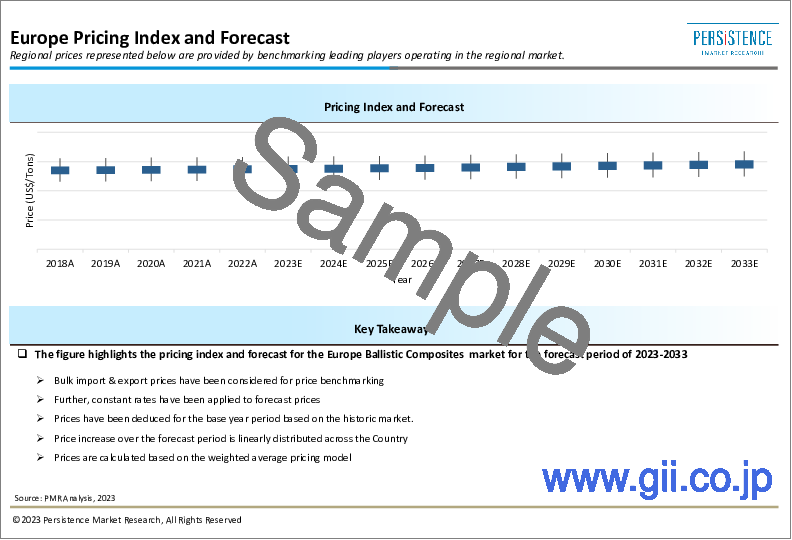
- Readers can find detailed information about several factors, such as the pricing analysis and regional trends, which are impacting growth of the Ballistic composites market in the Latin America region. This chapter also includes growth prospects of the Ballistic composites market in leading LATAM countries such as Brazil, Mexico, Argentina and Rest of Latin America.
Chapter 10 - Europe Ballistic Composites Market Analysis 2018-2022 and Forecast 2023-2033
- Important growth prospects of the Ballistic composites market in several countries such as Germany, Italy, France, U.K., Spain, Belgium and Rest of Europe are included in this chapter.
Chapter 11 -Asia Pacific Ballistic Composites Market Analysis 2018-2022 and Forecast 2023-2033
- This chapter includes a detailed analysis of the growth of the Ballistic composites market in the Asia Pacific region, along with a country-wise assessment that includes, China, Japan, South Korea, India, Australia and rest of Asia Pacific. Readers can also find regional trends, restraints, and market growth of countries in the Asia Pacific region.
Chapter 12 - Middle East and Africa Ballistic Composites Market Analysis 2018-2022 and Forecast 2023-2033
- This chapter offers insights into how the Ballistic composites market is expected to grow in major countries in the MEA region such as South Africa, Saudi Arabia, UAE and Rest of MEA, during the forecast period 2023-2033.
Chapter 13 - Key Countries Ballistic Composites Market Analysis
- This chapter offers insights into how the Ballistic composites market is expected to grow in key countries such as U.S., Canada, Brazil, Mexico, Argentina, Germany, Italy, France, U.K., Spain, Belgium, China, Japan, South Korea, India, Australia, Saudi Arabia, South Africa, U.A.E. during the forecast period 2023-2033.
Chapter 14 - Market Structure Analysis
- In this chapter, readers can find detailed information about tier analysis and market concentration of the key players in the Ballistic composites market along with their market presence analysis by region and product portfolio.
Chapter 15 - Competition Analysis
- In this chapter, readers can find a comprehensive list of manufacturers/ players in Ballistic composites market, along with detailed information about each company, which includes company overview, revenue shares, strategic overview, and recent company developments. Some of the market players featured in the report are Honeywell International Inc, BAE Systems, DSM, Morgan Advanced Materials, and Gaffco Ballistic.
Chapter 16 - Assumptions and Acronyms
- This chapter includes a list of acronyms and assumptions that provide a based to the information and statistics included in the Ballistic Composites market report.
Chapter 17 - Research Methodology
- This chapter helps readers understand the research methodology followed to obtain various conclusions, as well as important qualitative and quantitative information, on the Ballistic composites market.
Table of Contents
1. Executive Summary
- 1.1. Global Market Outlook
- 1.2. Demand-side Trends
- 1.3. Supply-side Trends
- 1.4. Technology Roadmap Analysis
- 1.5. Analysis and Recommendations
2. Market Overview
- 2.1. Market Coverage / Taxonomy
- 2.2. Market Definition / Scope / Limitations
3. Market Background
- 3.1. Market Dynamics
- 3.1.1. Drivers
- 3.1.2. Restraints
- 3.1.3. Opportunity
- 3.1.4. Trends
- 3.2. Scenario Forecast
- 3.2.1. Demand in Optimistic Scenario
- 3.2.2. Demand in Likely Scenario
- 3.2.3. Demand in Conservative Scenario
- 3.3. Opportunity Map Analysis
- 3.4. Product Life Cycle Analysis
- 3.5. Supply Chain Analysis
- 3.5.1. Supply Side Participants and their Roles
- 3.5.1.1. Producers
- 3.5.1.2. Mid-Level Participants (Traders/ Agents/ Brokers)
- 3.5.1.3. Wholesalers and Distributors
- 3.5.2. Value Added and Value Created at Node in the Supply Chain
- 3.5.3. List of Raw Material Suppliers
- 3.5.4. List of Existing and Potential Buyer's
- 3.5.1. Supply Side Participants and their Roles
- 3.6. Investment Feasibility Matrix
- 3.7. Value Chain Analysis
- 3.7.1. Profit Margin Analysis
- 3.7.2. Wholesalers and Distributors
- 3.7.3. Retailers
- 3.8. PESTLE and Porter's Analysis
- 3.9. Regulatory Landscape
- 3.9.1. By Key Regions
- 3.9.2. By Key Countries
- 3.10. Regional Parent Market Outlook
- 3.11. Production and Consumption Statistics
- 3.12. Import and Export Statistics
4. Global Ballistic Composites Market Analysis 2018-2022 and Forecast, 2023-2033
- 4.1. Historical Market Size Value (US$ Mn) & Volume (Mole) Analysis, 2018-2022
- 4.2. Current and Future Market Size Value (US$ Mn) & Volume (Mole) Projections, 2023-2033
- 4.2.1. Y-o-Y Growth Trend Analysis
- 4.2.2. Absolute $ Opportunity Analysis
5. Global Ballistic Composites Market Analysis 2018-2022 and Forecast 2023-2033, By Fiber Type
- 5.1. Introduction / Key Findings
- 5.2. Historical Market Size Value (US$ Mn) & Volume (Mole) Analysis By Fiber Type, 2018-2022
- 5.3. Current and Future Market Size Value (US$ Mn) & Volume (Mole) Analysis and Forecast By Fiber Type, 2023-2033
- 5.3.1. Aramid Fibers
- 5.3.2. UHMPE
- 5.3.3. Glass
- 5.3.4. Other Fiber Types
- 5.4. Y-o-Y Growth Trend Analysis By Fiber Type, 2018-2022
- 5.5. Absolute $ Opportunity Analysis By Fiber Type, 2023-2033
6. Global Ballistic Composites Market Analysis 2018-2022 and Forecast 2023-2033, By Matrix Type
- 6.1. Introduction / Key Findings
- 6.2. Historical Market Size Value (US$ Mn) & Volume (Mole) Analysis By Matrix Type, 2018-2022
- 6.3. Current and Future Market Size Value (US$ Mn) & Volume (Mole) Analysis and Forecast By Matrix Type, 2023-2033
- 6.3.1. Polymer Matrix
- 6.3.2. Polymer Ceramic
- 6.3.3. Metal Matrix
- 6.4. Y-o-Y Growth Trend Analysis By Matrix Type, 2018-2022
- 6.5. Absolute $ Opportunity Analysis By Matrix Type, 2023-2033
7. Global Ballistic Composites Market Analysis 2018-2022 and Forecast 2023-2033, By Application
- 7.1. Introduction / Key Findings
- 7.2. Historical Market Size Value (US$ Mn) & Volume (Mole) Analysis By Application, 2018-2022
- 7.3. Current and Future Market Size Value (US$ Mn) & Volume (Mole) Analysis and Forecast By Application, 2023-2033
- 7.3.1. Vehicle Armor
- 7.3.2. Body Armor
- 7.3.3. Helmet & Face Protection
- 7.3.4. Other Applications
- 7.4. Y-o-Y Growth Trend Analysis By Application, 2018-2022
- 7.5. Absolute $ Opportunity Analysis By Application, 2023-2033
8. Global Ballistic Composites Market Analysis 2018-2022 and Forecast 2023-2033, By Region
- 8.1. Introduction
- 8.2. Historical Market Size Value (US$ Mn) & Volume (Mole) Analysis By Region, 2018-2022
- 8.3. Current Market Size Value (US$ Mn) & Volume (Mole) Analysis and Forecast By Region, 2023-2033
- 8.3.1. North America
- 8.3.2. Latin America
- 8.3.3. Europe
- 8.3.4. Asia Pacific
- 8.3.5. MEA
- 8.4. Market Attractiveness Analysis By Region
9. North America Ballistic Composites Market Analysis 2018-2022 and Forecast 2023-2033, By Country
- 9.1. Historical Market Size Value (US$ Mn) & Volume (Mole) Trend Analysis By Market Taxonomy, 2018-2022
- 9.2. Market Size Value (US$ Mn) & Volume (Mole) Forecast By Market Taxonomy, 2023-2033
- 9.2.1. By Country
- 9.2.1.1. U.S.
- 9.2.1.2. Canada
- 9.2.2. By Fiber Type
- 9.2.3. By Matrix Type
- 9.2.4. By Application
- 9.2.1. By Country
- 9.3. Market Attractiveness Analysis
- 9.3.1. By Country
- 9.3.2. By Fiber Type
- 9.3.3. By Matrix Type
- 9.3.4. By Application
- 9.4. Key Takeaways
10. Latin America Ballistic Composites Market Analysis 2018-2022 and Forecast 2023-2033, By Country
- 10.1. Historical Market Size Value (US$ Mn) & Volume (Mole) Trend Analysis By Market Taxonomy, 2018-2022
- 10.2. Market Size Value (US$ Mn) & Volume (Mole) Forecast By Market Taxonomy, 2023-2033
- 10.2.1. By Country
- 10.2.1.1. Brazil
- 10.2.1.2. Mexico
- 10.2.1.3. Rest of Latin America
- 10.2.2. By Fiber Type
- 10.2.3. By Matrix Type
- 10.2.4. By Application
- 10.2.1. By Country
- 10.3. Market Attractiveness Analysis
- 10.3.1. By Country
- 10.3.2. By Fiber Type
- 10.3.3. By Matrix Type
- 10.3.4. By Application
- 10.4. Key Takeaways
11. Europe Ballistic Composites Market Analysis 2018-2022 and Forecast 2023-2033, By Country
- 11.1. Historical Market Size Value (US$ Mn) & Volume (Mole) Trend Analysis By Market Taxonomy, 2018-2022
- 11.2. Market Size Value (US$ Mn) & Volume (Mole) Forecast By Market Taxonomy, 2023-2033
- 11.2.1. By Country
- 11.2.1.1. Germany
- 11.2.1.2. U.K.
- 11.2.1.3. France
- 11.2.1.4. Spain
- 11.2.1.5. Italy
- 11.2.1.6. Rest of Europe
- 11.2.2. By Fiber Type
- 11.2.3. By Matrix Type
- 11.2.4. By Application
- 11.2.1. By Country
- 11.3. Market Attractiveness Analysis
- 11.3.1. By Country
- 11.3.2. By Fiber Type
- 11.3.3. By Matrix Type
- 11.3.4. By Application
- 11.4. Key Takeaways
12. Asia Pacific Ballistic Composites Market Analysis 2018-2022 and Forecast 2023-2033, By Country
- 12.1. Historical Market Size Value (US$ Mn) & Volume (Mole) Trend Analysis By Market Taxonomy, 2018-2022
- 12.2. Market Size Value (US$ Mn) & Volume (Mole) Forecast By Market Taxonomy, 2023-2033
- 12.2.1. By Country
- 12.2.1.1. China
- 12.2.1.2. Japan
- 12.2.1.3. South Korea
- 12.2.1.4. Malaysia
- 12.2.1.5. Singapore
- 12.2.1.6. Australia
- 12.2.1.7. New Zealand
- 12.2.1.8. Rest of APAC
- 12.2.2. By Fiber Type
- 12.2.3. By Matrix Type
- 12.2.4. By Application
- 12.2.1. By Country
- 12.3. Market Attractiveness Analysis
- 12.3.1. By Country
- 12.3.2. By Fiber Type
- 12.3.3. By Matrix Type
- 12.3.4. By Application
- 12.4. Key Takeaways
13. MEA Ballistic Composites Market Analysis 2018-2022 and Forecast 2023-2033, By Country
- 13.1. Historical Market Size Value (US$ Mn) & Volume (Mole) Trend Analysis By Market Taxonomy, 2018-2022
- 13.2. Market Size Value (US$ Mn) & Volume (Mole) Forecast By Market Taxonomy, 2023-2033
- 13.2.1. By Country
- 13.2.1.1. GCC Countries
- 13.2.1.2. South Africa
- 13.2.1.3. Israel
- 13.2.1.4. Rest of MEA
- 13.2.2. By Fiber Type
- 13.2.3. By Matrix Type
- 13.2.4. By Application
- 13.2.1. By Country
- 13.3. Market Attractiveness Analysis
- 13.3.1. By Country
- 13.3.2. By Fiber Type
- 13.3.3. By Matrix Type
- 13.3.4. By Application
- 13.4. Key Takeaways
14. Key Countries Ballistic Composites Market Analysis
- 14.1. U.S.
- 14.1.1. Pricing Analysis
- 14.1.2. Market Share Analysis, 2022
- 14.1.2.1. By Fiber Type
- 14.1.2.2. By Matrix Type
- 14.1.2.3. By Application
- 14.2. Canada
- 14.2.1. Pricing Analysis
- 14.2.2. Market Share Analysis, 2022
- 14.2.2.1. By Fiber Type
- 14.2.2.2. By Matrix Type
- 14.2.2.3. By Application
- 14.3. Brazil
- 14.3.1. Pricing Analysis
- 14.3.2. Market Share Analysis, 2022
- 14.3.2.1. By Fiber Type
- 14.3.2.2. By Matrix Type
- 14.3.2.3. By Application
- 14.4. Mexico
- 14.4.1. Pricing Analysis
- 14.4.2. Market Share Analysis, 2022
- 14.4.2.1. By Fiber Type
- 14.4.2.2. By Matrix Type
- 14.4.2.3. By Application
- 14.5. Germany
- 14.5.1. Pricing Analysis
- 14.5.2. Market Share Analysis, 2022
- 14.5.2.1. By Fiber Type
- 14.5.2.2. By Matrix Type
- 14.5.2.3. By Application
- 14.6. U.K.
- 14.6.1. Pricing Analysis
- 14.6.2. Market Share Analysis, 2022
- 14.6.2.1. By Fiber Type
- 14.6.2.2. By Matrix Type
- 14.6.2.3. By Application
- 14.7. France
- 14.7.1. Pricing Analysis
- 14.7.2. Market Share Analysis, 2022
- 14.7.2.1. By Fiber Type
- 14.7.2.2. By Matrix Type
- 14.7.2.3. By Application
- 14.8. Spain
- 14.8.1. Pricing Analysis
- 14.8.2. Market Share Analysis, 2022
- 14.8.2.1. By Fiber Type
- 14.8.2.2. By Matrix Type
- 14.8.2.3. By Application
- 14.9. Italy
- 14.9.1. Pricing Analysis
- 14.9.2. Market Share Analysis, 2022
- 14.9.2.1. By Fiber Type
- 14.9.2.2. By Matrix Type
- 14.9.2.3. By Application
- 14.10. China
- 14.10.1. Pricing Analysis
- 14.10.2. Market Share Analysis, 2022
- 14.10.2.1. By Fiber Type
- 14.10.2.2. By Matrix Type
- 14.10.2.3. By Application
- 14.11. Japan
- 14.11.1. Pricing Analysis
- 14.11.2. Market Share Analysis, 2022
- 14.11.2.1. By Fiber Type
- 14.11.2.2. By Matrix Type
- 14.11.2.3. By Application
- 14.12. South Korea
- 14.12.1. Pricing Analysis
- 14.12.2. Market Share Analysis, 2022
- 14.12.2.1. By Fiber Type
- 14.12.2.2. By Matrix Type
- 14.12.2.3. By Application
- 14.13. Malaysia
- 14.13.1. Pricing Analysis
- 14.13.2. Market Share Analysis, 2022
- 14.13.2.1. By Fiber Type
- 14.13.2.2. By Matrix Type
- 14.13.2.3. By Application
- 14.14. Singapore
- 14.14.1. Pricing Analysis
- 14.14.2. Market Share Analysis, 2022
- 14.14.2.1. By Fiber Type
- 14.14.2.2. By Matrix Type
- 14.14.2.3. By Application
- 14.15. Australia
- 14.15.1. Pricing Analysis
- 14.15.2. Market Share Analysis, 2022
- 14.15.2.1. By Fiber Type
- 14.15.2.2. By Matrix Type
- 14.15.2.3. By Application
- 14.16. New Zealand
- 14.16.1. Pricing Analysis
- 14.16.2. Market Share Analysis, 2022
- 14.16.2.1. By Fiber Type
- 14.16.2.2. By Matrix Type
- 14.16.2.3. By Application
- 14.17. GCC Countries
- 14.17.1. Pricing Analysis
- 14.17.2. Market Share Analysis, 2022
- 14.17.2.1. By Fiber Type
- 14.17.2.2. By Matrix Type
- 14.17.2.3. By Application
- 14.18. South Africa
- 14.18.1. Pricing Analysis
- 14.18.2. Market Share Analysis, 2022
- 14.18.2.1. By Fiber Type
- 14.18.2.2. By Matrix Type
- 14.18.2.3. By Application
- 14.19. Israel
- 14.19.1. Pricing Analysis
- 14.19.2. Market Share Analysis, 2022
- 14.19.2.1. By Fiber Type
- 14.19.2.2. By Matrix Type
- 14.19.2.3. By Application
15. Market Structure Analysis
- 15.1. Competition Dashboard
- 15.2. Competition Benchmarking
- 15.3. Market Share Analysis of Top Players
- 15.3.1. By Regional
- 15.3.2. By Fiber Type
- 15.3.3. By Matrix Type
- 15.3.4. By Application
16. Competition Analysis
- 16.1. Competition Deep Dive
- 16.1.1. Honeywell International Inc
- 16.1.1.1. Overview
- 16.1.1.2. Product Portfolio
- 16.1.1.3. Profitability by Market Segments
- 16.1.1.4. Sales Footprint
- 16.1.1.5. Strategy Overview
- 16.1.1.5.1. Marketing Strategy
- 16.1.1.5.2. Product Strategy
- 16.1.1.5.3. Channel Strategy
- 16.1.2. BAE Systems
- 16.1.2.1. Overview
- 16.1.2.2. Product Portfolio
- 16.1.2.3. Profitability by Market Segments
- 16.1.2.4. Sales Footprint
- 16.1.2.5. Strategy Overview
- 16.1.2.5.1. Marketing Strategy
- 16.1.2.5.2. Product Strategy
- 16.1.2.5.3. Channel Strategy
- 16.1.3. DSM
- 16.1.3.1. Overview
- 16.1.3.2. Product Portfolio
- 16.1.3.3. Profitability by Market Segments
- 16.1.3.4. Sales Footprint
- 16.1.3.5. Strategy Overview
- 16.1.3.5.1. Marketing Strategy
- 16.1.3.5.2. Product Strategy
- 16.1.3.5.3. Channel Strategy
- 16.1.4. Morgan Advanced Materials
- 16.1.4.1. Overview
- 16.1.4.2. Product Portfolio
- 16.1.4.3. Profitability by Market Segments
- 16.1.4.4. Sales Footprint
- 16.1.4.5. Strategy Overview
- 16.1.4.5.1. Marketing Strategy
- 16.1.4.5.2. Product Strategy
- 16.1.4.5.3. Channel Strategy
- 16.1.5. Gaffco ballistic
- 16.1.5.1. Overview
- 16.1.5.2. Product Portfolio
- 16.1.5.3. Profitability by Market Segments
- 16.1.5.4. Sales Footprint
- 16.1.5.5. Strategy Overview
- 16.1.5.5.1. Marketing Strategy
- 16.1.5.5.2. Product Strategy
- 16.1.5.5.3. Channel Strategy
- 16.1.6. Teijin Aramid B.V.
- 16.1.6.1. Overview
- 16.1.6.2. Product Portfolio
- 16.1.6.3. Profitability by Market Segments
- 16.1.6.4. Sales Footprint
- 16.1.6.5. Strategy Overview
- 16.1.6.5.1. Marketing Strategy
- 16.1.6.5.2. Product Strategy
- 16.1.6.5.3. Channel Strategy
- 16.1.7. DuPont
- 16.1.7.1. Overview
- 16.1.7.2. Product Portfolio
- 16.1.7.3. Profitability by Market Segments
- 16.1.7.4. Sales Footprint
- 16.1.7.5. Strategy Overview
- 16.1.7.5.1. Marketing Strategy
- 16.1.7.5.2. Product Strategy
- 16.1.7.5.3. Channel Strategy
- 16.1.8. Barrday Inc
- 16.1.8.1. Overview
- 16.1.8.2. Product Portfolio
- 16.1.8.3. Profitability by Market Segments
- 16.1.8.4. Sales Footprint
- 16.1.8.5. Strategy Overview
- 16.1.8.5.1. Marketing Strategy
- 16.1.8.5.2. Product Strategy
- 16.1.8.5.3. Channel Strategy
- 16.1.9. Plastic Reinforcement Fabrics Ltd
- 16.1.9.1. Overview
- 16.1.9.2. Product Portfolio
- 16.1.9.3. Profitability by Market Segments
- 16.1.9.4. Sales Footprint
- 16.1.9.5. Strategy Overview
- 16.1.9.5.1. Marketing Strategy
- 16.1.9.5.2. Product Strategy
- 16.1.9.5.3. Channel Strategy
- 16.1.10. M Cubed Technologies
- 16.1.10.1. Overview
- 16.1.10.2. Product Portfolio
- 16.1.10.3. Profitability by Market Segments
- 16.1.10.4. Sales Footprint
- 16.1.10.5. Strategy Overview
- 16.1.10.5.1. Marketing Strategy
- 16.1.10.5.2. Product Strategy
- 16.1.10.5.3. Channel Strategy
- 16.1.1. Honeywell International Inc