|
|
市場調査レポート
商品コード
1220898
ADASアフターマーケットの世界市場:駐車支援システムの需要は10年以上にわたって最高水準で推移Market Study on ADAS Aftermarket: Demand for Park Assist Systems to Remain Highest Over Decade |
||||||
|
|
|||||||
|
● お客様のご希望に応じて、既存データの加工や未掲載情報(例:国別セグメント)の追加などの対応が可能です。 詳細はお問い合わせください。 |
|||||||


| ADASアフターマーケットの世界市場:駐車支援システムの需要は10年以上にわたって最高水準で推移 |
|
出版日: 2022年12月16日
発行: Persistence Market Research
ページ情報: 英文 322 Pages
納期: 2~5営業日
|
- 全表示
- 概要
- 図表
- 目次
当レポートでは、世界のADASアフターマーケット市場を調査し、市場の概要や動向、成功要因、市場の背景、セグメント別・地域別の市場分析と予測、競合情勢などをまとめています。
目次
第1章 エグゼクティブサマリー
第2章 市場概要
- 市場範囲/分類法
- 市場の定義/範囲/制限
第3章 主要な市場動向
- 市場に影響を与える主要な動向
第4章 主な成功要因
第5章 世界のアフターマーケット市場の需要分析と予測
- 過去の市場分析
- 現在および将来の市場予測
- 前年比成長動向分析
第6章 世界のアフターマーケット市場 - 価格分析
- 地域別価格分析:システムタイプ別
- 世界の平均価格分析ベンチマーク
第7章 世界のアフターマーケット市場の需要(金額または規模)の分析と予測
- 過去の市場分析
- 現在および将来の市場予測
- 前年比成長動向分析
第8章 市場の背景
- マクロ経済要因
- 世界経済成長の見通し
- 実質GDP成長率
- 業界の付加価値
- 都市人口
- 世界の自動車産業の見通し
- 予測要因 - 関連性と影響
- GDP成長率
- 輸送ネットワーク
- 自動車製造業の成長
- 商業の成長
- 都市化の動向
- 車載センサーシステムの予測
- バリューチェーン
- メーカーリスト
- COVID-19危機 - 影響評価
- 現在の統計
- 短中長期の見通し
- 回復の可能性
- 市場力学
- 促進要因
- 抑制要因
- 機会分析
- 米国電気工業会規格
第9章 世界のアフターマーケット市場の分析と予測:システムタイプ別
- イントロダクション/主な調査結果
- 過去の市場と数量の分析:システムタイプ別
- 現在および将来の市場と数量の分析と予測:システムタイプ別
- アダプティブクルーズコントロール
- アダプティブフロントライト
- 自動緊急ブレーキ
- 死角検出
- ドライバー監視システム
- 前方衝突警報
- 車線逸脱警報/車線維持支援
- 駐車支援
- タイヤ空気圧監視システム
- 暗視システム
- 市場の魅力度分析:システムタイプ別
第10章 世界のアフターマーケット市場の分析と予測:技術別
- イントロダクション/主な調査結果
- 過去の市場と数量の分析:技術別
- 現在および将来の市場と数量の分析と予測:技術別
- 超音波センサー
- LiDARセンサー
- レーダーセンサー
- カメラセンサー
- 赤外線センサー
- 圧力センサー
- 市場の魅力度分析:技術別
第11章 世界のアフターマーケット市場の分析と予測:車両タイプ別
- イントロダクション/主な調査結果
- 過去の市場と数量の分析:車両タイプ別
- 現在および将来の市場と数量の分析と予測:車両タイプ別
- 乗用車
- 小型商用車
- 大型商用車
- 市場の魅力度分析:車両タイプ別
第12章 世界のアフターマーケット市場の分析と予測:販売チャネル別
- イントロダクション/主な調査結果
- 過去の市場と数量の分析:販売チャネル別
- 現在および将来の市場と数量の分析と予測:販売チャネル別
- OES(相手先ブランド供給業者)
- IAM(独立系アフターマーケット)
- 市場の魅力度分析:販売チャネル別
第13章 世界のアフターマーケット市場の分析と予測:地域別
- イントロダクション
- 過去の市場と数量の分析:地域別
- 現在の市場と数量の分析と予測:地域別
- 北米
- ラテンアメリカ
- 欧州
- 東アジア
- 南アジア・太平洋地域
- 中東・アフリカ
- 市場の魅力度分析:地域別
第14章 北米のアフターマーケット市場の分析と予測
- イントロダクション
- 過去の市場と数量の動向分析:市場分類別
- 市場と数量の予測:市場分類別
- 国別
- システムタイプ別
- 技術別
- 車両タイプ別
- 販売チャネル別
- 市場の魅力度分析
- 国別
- システムタイプ別
- 技術別
- 車両タイプ別
- 販売チャネル別
第15章 ラテンアメリカのアフターマーケット市場の分析と予測
- イントロダクション
- 過去の市場と数量の動向分析:市場分類別
- 市場と数量の予測:市場分類別
- 国別
- システムタイプ別
- 技術別
- 車両タイプ別
- 販売チャネル別
- 市場の魅力度分析
- 国別
- システムタイプ別
- 技術別
- 車両タイプ別
- 販売チャネル別
第16章 欧州のアフターマーケット市場の分析と予測
- イントロダクション
- 過去の市場と数量の動向分析:市場分類別
- 市場と数量の予測:市場分類別
- 国別
- システムタイプ別
- 技術別
- 車両タイプ別
- 販売チャネル別
- 市場の魅力度分析
- 国別
- システムタイプ別
- 技術別
- 車両タイプ別
- 販売チャネル別
第17章 東アジアのアフターマーケット市場の分析と予測
- イントロダクション
- 過去の市場と数量の動向分析:市場分類別
- 市場と数量の予測:市場分類別
- 国別
- システムタイプ別
- 技術別
- 車両タイプ別
- 販売チャネル別
- 市場の魅力度分析
- 国別
- システムタイプ別
- 技術別
- 車両タイプ別
- 販売チャネル別
第18章 南アジア・太平洋地域のアフターマーケット市場の分析と予測
- イントロダクション
- 過去の市場と数量の動向分析:市場分類別
- 市場と数量の予測:市場分類別
- 国別
- システムタイプ別
- 技術別
- 車両タイプ別
- 販売チャネル別
- 市場の魅力度分析
- 国別
- システムタイプ別
- 技術別
- 車両タイプ別
- 販売チャネル別
第19章 中東・アフリカのアフターマーケット市場の分析と予測
- イントロダクション
- 過去の市場と数量の動向分析:市場分類別
- 市場と数量の予測:市場分類別
- 国別
- システムタイプ別
- 技術別
- 車両タイプ別
- 販売チャネル別
- 市場の魅力度分析
- 国別
- システムタイプ別
- 技術別
- 車両タイプ別
- 販売チャネル別
第20章 国別のアフターマーケット市場の分析
- 米国のアフターマーケット市場分析
- システムタイプ別
- 技術別
- 車両タイプ別
- 販売チャネル別
- カナダのアフターマーケット市場分析
- システムタイプ別
- 技術別
- 車両タイプ別
- 販売チャネル別
- メキシコのアフターマーケット市場分析
- システムタイプ別
- 技術別
- 車両タイプ別
- 販売チャネル別
- ブラジルのアフターマーケット市場分析
- システムタイプ別
- 技術別
- 車両タイプ別
- 販売チャネル別
- ドイツのアフターマーケット市場分析
- システムタイプ別
- 技術別
- 車両タイプ別
- 販売チャネル別
- イタリアのアフターマーケット市場分析
- システムタイプ別
- 技術別
- 車両タイプ別
- 販売チャネル別
- フランスのアフターマーケット市場分析
- システムタイプ別
- 技術別
- 車両タイプ別
- 販売チャネル別
- 英国のアフターマーケット市場分析
- システムタイプ別
- 技術別
- 車両タイプ別
- 販売チャネル別
- スペインのアフターマーケット市場分析
- システムタイプ別
- 技術別
- 車両タイプ別
- 販売チャネル別
- ベネルクス諸国のアフターマーケット市場分析
- システムタイプ別
- 技術別
- 車両タイプ別
- 販売チャネル別
- ロシアのアフターマーケット市場分析
- システムタイプ別
- 技術別
- 車両タイプ別
- 販売チャネル別
- 中国のアフターマーケット市場分析
- システムタイプ別
- 技術別
- 車両タイプ別
- 販売チャネル別
- 日本のアフターマーケット市場分析
- システムタイプ別
- 技術別
- 車両タイプ別
- 販売チャネル別
- 韓国のアフターマーケット市場分析
- システムタイプ別
- 技術別
- 車両タイプ別
- 販売チャネル別
- インドのアフターマーケット市場分析
- システムタイプ別
- 技術別
- 車両タイプ別
- 販売チャネル別
- ASEAN諸国のアフターマーケット市場分析
- システムタイプ別
- 技術別
- 車両タイプ別
- 販売チャネル別
- オーストラリア・ニュージーランドのアフターマーケット市場分析
- システムタイプ別
- 技術別
- 車両タイプ別
- 販売チャネル別
- GCC諸国のアフターマーケット市場分析
- システムタイプ別
- 技術別
- 車両タイプ別
- 販売チャネル別
- トルコのアフターマーケット市場分析
- システムタイプ別
- 技術別
- 車両タイプ別
- 販売チャネル別
- 北アフリカのアフターマーケット市場分析
- システムタイプ別
- 技術別
- 車両タイプ別
- 販売チャネル別
- 南アフリカのアフターマーケット市場分析
- システムタイプ別
- 技術別
- 車両タイプ別
- 販売チャネル別
第21章 市場構造分析
- 市場分析:企業階層別(ADASアフターマーケット)
- 主要企業の市場シェア分析
- 市場プレゼンス分析
第22章 競合分析
- 競合ダッシュボード
- 競合のベンチマーク
- 競合の詳細
- Robert Bosch GmbH
- Continental AG
- ZF Friedrichshafen AG
- Denso Corp.
- Aptiv plc
- Valeo SA
- Magna International Inc.
- Veoneer Inc.
- Aisin Corporation
- Hitachi Astemo, Ltd.
- Nidec Corporation
- Infineon Technologies AG
- Ficosa Internacional SA
- Hella KGaA Hueck & Co.
- Pacific Industrial Co., Ltd.
- Mobileye
第23章 前提と使用される頭字語
第24章 一次調査分析
第25章 調査手法
List of Tables
- Table 01: Global ADAS Aftermarket Volume (Units) and Value (US$ Mn) Forecast by System Type, 2017 - 2033
- Table 02: Global ADAS Aftermarket Volume (Units) and Value (US$ Mn) Forecast by Technology, 2017 - 2033
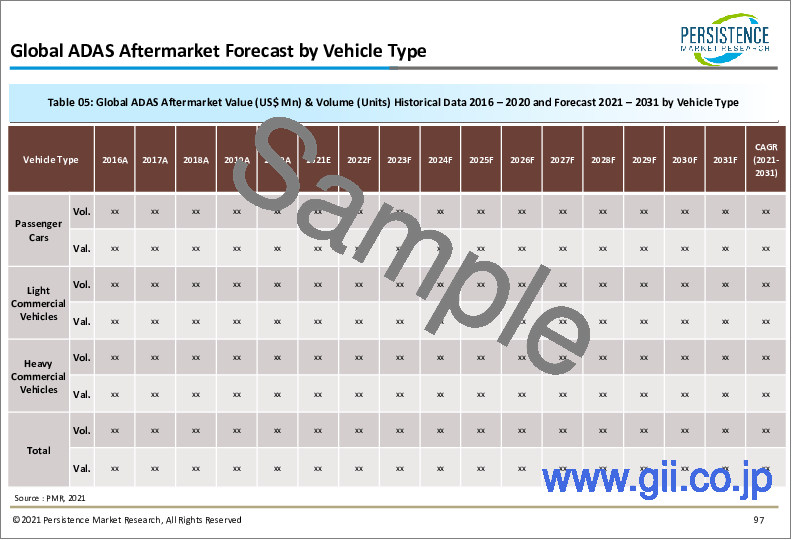
- Table 03: Global ADAS Aftermarket Volume (Units) and Value (US$ Mn) Forecast by Vehicle Type, 2017 - 2033
- Table 04: Global ADAS Aftermarket Volume (Units) and Value (US$ Mn) Forecast by Sales-Channel, 2017 - 2033
- Table 05: Global ADAS Aftermarket Volume (Units) and Value (US$ Mn) Forecast by Region, 2017 - 2033
- Table 06: North America ADAS Aftermarket Volume (Units) and Value (US$ Mn) Forecast by Country, 2017 - 2033
- Table 07: North America ADAS Aftermarket Volume (Units) and Value (US$ Mn) Forecast by System Type, 2017 - 2033
- Table 08: North America ADAS Aftermarket Volume (Units) and Value (US$ Mn) Forecast by Technology, 2017 - 2033
- Table 09: North America ADAS Aftermarket Volume (Units) and Value (US$ Mn) Forecast by Vehicle Type, 2017 - 2033
- Table 10: North America ADAS Aftermarket Volume (Units) and Value (US$ Mn) Forecast by Sales-Channel, 2017 - 2033
- Table 11: Latin America ADAS Aftermarket Volume (Units) and Value (US$ Mn) Forecast by Country, 2017 - 2033
- Table 12: Latin America ADAS Aftermarket Volume (Units) and Value (US$ Mn) Forecast by System Type, 2017 - 2033
- Table 13: Latin America ADAS Aftermarket Volume (Units) and Value (US$ Mn) Forecast by Technology, 2017 - 2033
- Table 14: Latin America ADAS Aftermarket Volume (Units) and Value (US$ Mn) Forecast by Vehicle Type, 2017 - 2033
- Table 15: Latin America ADAS Aftermarket Volume (Units) and Value (US$ Mn) Forecast by Sales-Channel, 2017 - 2033
- Table 16: Europe ADAS Aftermarket Volume (Units) Forecast by Country, 2017 - 2033
- Table 17: Europe ADAS Aftermarket Value (US$ Mn) Forecast by Country, 2017 - 2033
- Table 18: Europe ADAS Aftermarket Volume (Units) and Value (US$ Mn) Forecast by System Type, 2017 - 2033
- Table 19: Europe ADAS Aftermarket Volume (Units) and Value (US$ Mn) Forecast by Technology, 2017 - 2033
- Table 20: Europe ADAS Aftermarket Volume (Units) and Value (US$ Mn) Forecast by Vehicle Type, 2017 - 2033
- Table 21: Europe ADAS Aftermarket Volume (Units) and Value (US$ Mn) Forecast by Sales-Channel, 2017 - 2033
- Table 22: East Asia ADAS Aftermarket Volume (Units) and Value (US$ Mn) Forecast by Country, 2017 - 2033
- Table 23: East Asia ADAS Aftermarket Volume (Units) and Value (US$ Mn) Forecast by System Type, 2017 - 2033
- Table 24: East Asia ADAS Aftermarket Volume (Units) and Value (US$ Mn) Forecast by Technology, 2017 - 2033
- Table 25: East Asia ADAS Aftermarket Volume (Units) and Value (US$ Mn) Forecast by Vehicle Type, 2017 - 2033
- Table 26: East Asia ADAS Aftermarket Volume (Units) and Value (US$ Mn) Forecast by Sales-Channel, 2017 - 2033
- Table 27: South Asia & Pacific ADAS Aftermarket Volume (Units) and Value (US$ Mn) Forecast by Country, 2017 - 2033
- Table 28: South Asia & Pacific ADAS Aftermarket Volume (Units) and Value (US$ Mn) Forecast by System Type, 2017 - 2033
- Table 29: South Asia & Pacific ADAS Aftermarket Volume (Units) and Value (US$ Mn) Forecast by Technology, 2017 - 2033
- Table 30: South Asia & Pacific ADAS Aftermarket Volume (Units) and Value (US$ Mn) Forecast by Vehicle Type, 2017 - 2033
- Table 31: South Asia & Pacific ADAS Aftermarket Volume (Units) and Value (US$ Mn) Forecast by Sales-Channel, 2017 - 2033
- Table 32: Middle East & Africa ADAS Aftermarket Volume (Units) and Value (US$ Mn) Forecast by Country, 2017 - 2033
- Table 33: Middle East & Africa ADAS Aftermarket Volume (Units) and Value (US$ Mn) Forecast by System Type, 2017 - 2033
- Table 34: Middle East & Africa ADAS Aftermarket Volume (Units) and Value (US$ Mn) Forecast by Technology, 2017 - 2033
- Table 35: Middle East & Africa ADAS Aftermarket Volume (Units) and Value (US$ Mn) Forecast by Vehicle Type, 2017 - 2033
- Table 36: Middle East & Africa ADAS Aftermarket Volume (Units) and Value (US$ Mn) Forecast by Sales-Channel, 2017 - 2033
List of Figures
- Figure 01: Global ADAS Aftermarket Historical Demand, 2017-2022
- Figure 02: Global ADAS Aftermarket Demand Forecast, 2023-2033
- Figure 03: Global ADAS Aftermarket Historical Value (US$ Mn), 2017-2022
- Figure 04: Global ADAS Aftermarket Value (US$ Mn) Forecast, 2023-2033
- Figure 05: Global ADAS Aftermarket Absolute $ Opportunity, 2023-2033
- Figure 06: Global ADAS Aftermarket Share and BPS Analysis by System Type, 2023 & 2033
- Figure 07: Global ADAS Aftermarket Y-o-Y Growth Projection by System Type, 2023-2033
- Figure 08: Global ADAS Aftermarket Attractiveness Analysis by System Type, 2023-2033
- Figure 09: Global ADAS Aftermarket Share and BPS Analysis by Technology, 2023 & 2033
- Figure 10: Global ADAS Aftermarket Y-o-Y Growth Projection by Technology, 2023-2033
- Figure 11: Global ADAS Aftermarket Attractiveness Analysis by Technology, 2023-2033
- Figure 12: Global ADAS Aftermarket Share and BPS Analysis by Vehicle Type, 2023 & 2033
- Figure 13: Global ADAS Aftermarket Y-o-Y Growth Projection by Vehicle Type, 2023-2033
- Figure 14: Global ADAS Aftermarket Attractiveness Analysis by Vehicle Type, 2023-2033
- Figure 15: Global ADAS Aftermarket Share and BPS Analysis by Sales-Channel, 2023 & 2033
- Figure 16: Global ADAS Aftermarket Y-o-Y Growth Projection by Sales-Channel, 2023-2033
- Figure 17: Global ADAS Aftermarket Attractiveness Analysis by Sales-Channel, 2023-2033
- Figure 18: Global ADAS Aftermarket Share and BPS Analysis By Region- 2023-2033
- Figure 19: Global ADAS Aftermarket Y-o-Y Growth Projections By Region, 2023-2033
- Figure 20: Global ADAS Aftermarket Attractiveness By Region, 2023-2033
- Figure 21: North America ADAS Aftermarket Share and BPS Analysis by Country - 2023-2033
- Figure 22: North America ADAS Aftermarket Y-o-Y Growth Projections by Country, 2023-2033
- Figure 23: North America ADAS Aftermarket Attractiveness by Country, 2023-2033
- Figure 24: North America ADAS Aftermarket Share and BPS Analysis by System Type, 2023 & 2033
- Figure 25: North America ADAS Aftermarket Y-o-Y Growth Projection by System Type, 2023-2033
- Figure 26: North America ADAS Aftermarket Attractiveness Analysis by System Type, 2023-2033
- Figure 27: North America ADAS Aftermarket Share and BPS Analysis by Technology, 2023 & 2033
- Figure 28: North America ADAS Aftermarket Y-o-Y Growth Projection by Technology, 2023-2033
- Figure 29: North America ADAS Aftermarket Attractiveness Analysis by Technology, 2023-2033
- Figure 30: North America ADAS Aftermarket Share and BPS Analysis by Vehicle Type, 2023 & 2033
- Figure 31: North America ADAS Aftermarket Y-o-Y Growth Projection by Vehicle Type, 2023-2033
- Figure 32: North America ADAS Aftermarket Attractiveness Analysis by Vehicle Type, 2023-2033
- Figure 33: North America ADAS Aftermarket Share and BPS Analysis by Sales-Channel, 2023 & 2033
- Figure 34: North America ADAS Aftermarket Y-o-Y Growth Projection by Sales-Channel, 2023-2033
- Figure 35: North America ADAS Aftermarket Attractiveness Analysis by Sales-Channel, 2023-2033
- Figure 36: Latin America ADAS Aftermarket Share and BPS Analysis by Country - 2023-2033
- Figure 37: Latin America ADAS Aftermarket Y-o-Y Growth Projections by Country, 2023-2033
- Figure 38: Latin America ADAS Aftermarket Attractiveness by Country, 2023-2033
- Figure 39: Latin America ADAS Aftermarket Share and BPS Analysis by System Type, 2023 & 2033
- Figure 40: Latin America ADAS Aftermarket Y-o-Y Growth Projection by System Type, 2023-2033
- Figure 41: Latin America ADAS Aftermarket Attractiveness Analysis by System Type, 2023-2033
- Figure 42: Latin America ADAS Aftermarket Share and BPS Analysis by Technology, 2023 & 2033
- Figure 43: Latin America ADAS Aftermarket Y-o-Y Growth Projection by Technology, 2023-2033
- Figure 44: Latin America ADAS Aftermarket Attractiveness Analysis by Technology, 2023-2033
- Figure 45: Latin America ADAS Aftermarket Share and BPS Analysis by Vehicle Type, 2023 & 2033
- Figure 46: Latin America ADAS Aftermarket Y-o-Y Growth Projection by Vehicle Type, 2023-2033
- Figure 47: Latin America ADAS Aftermarket Attractiveness Analysis by Vehicle Type, 2023-2033
- Figure 48: Latin America ADAS Aftermarket Share and BPS Analysis by Sales-Channel, 2023 & 2033
- Figure 49: Latin America ADAS Aftermarket Y-o-Y Growth Projection by Sales-Channel, 2023-2033
- Figure 50: Latin America ADAS Aftermarket Attractiveness Analysis by Sales-Channel, 2023-2033
- Figure 51: Europe ADAS Aftermarket Share and BPS Analysis by Country - 2023-2033
- Figure 52: Europe ADAS Aftermarket Y-o-Y Growth Projections by Country, 2023-2033
- Figure 53: Europe ADAS Aftermarket Attractiveness by Country, 2023-2033
- Figure 54: Europe ADAS Aftermarket Share and BPS Analysis by System Type, 2023 & 2033
- Figure 55: Europe ADAS Aftermarket Y-o-Y Growth Projection by System Type, 2023-2033
- Figure 56: Europe ADAS Aftermarket Attractiveness Analysis by System Type, 2023-2033
- Figure 57: Europe ADAS Aftermarket Share and BPS Analysis by Technology, 2023 & 2033
- Figure 58: Europe ADAS Aftermarket Y-o-Y Growth Projection by Technology, 2023-2033
- Figure 59: Europe ADAS Aftermarket Attractiveness Analysis by Technology, 2023-2033
- Figure 60: Europe ADAS Aftermarket Share and BPS Analysis by Vehicle Type, 2023 & 2033
- Figure 61: Europe ADAS Aftermarket Y-o-Y Growth Projection by Vehicle Type, 2023-2033
- Figure 62: Europe ADAS Aftermarket Attractiveness Analysis by Vehicle Type, 2023-2033
- Figure 63: Europe ADAS Aftermarket Share and BPS Analysis by Sales-Channel, 2023 & 2033
- Figure 64: Europe ADAS Aftermarket Y-o-Y Growth Projection by Sales-Channel, 2023-2033
- Figure 65: Europe ADAS Aftermarket Attractiveness Analysis by Sales-Channel, 2023-2033
- Figure 66: East Asia ADAS Aftermarket Share and BPS Analysis by Country - 2023-2033
- Figure 67: East Asia ADAS Aftermarket Y-o-Y Growth Projections by Country, 2023-2033
- Figure 68: East Asia ADAS Aftermarket Attractiveness by Country, 2023-2033
- Figure 69: East Asia ADAS Aftermarket Share and BPS Analysis by System Type, 2023 & 2033
- Figure 70: East Asia ADAS Aftermarket Y-o-Y Growth Projection by System Type, 2023-2033
- Figure 71: East Asia ADAS Aftermarket Attractiveness Analysis by System Type, 2023-2033
- Figure 72: East Asia ADAS Aftermarket Share and BPS Analysis by Technology, 2023 & 2033
- Figure 73: East Asia ADAS Aftermarket Y-o-Y Growth Projection by Technology, 2023-2033
- Figure 74: East Asia ADAS Aftermarket Attractiveness Analysis by Technology, 2023-2033
- Figure 75: East Asia ADAS Aftermarket Share and BPS Analysis by Vehicle Type, 2023 & 2033
- Figure 76: East Asia ADAS Aftermarket Y-o-Y Growth Projection by Vehicle Type, 2023-2033
- Figure 77: East Asia ADAS Aftermarket Attractiveness Analysis by Vehicle Type, 2023-2033
- Figure 78: East Asia ADAS Aftermarket Share and BPS Analysis by Sales-Channel, 2023 & 2033
- Figure 79: East Asia ADAS Aftermarket Y-o-Y Growth Projection by Sales-Channel, 2023-2033
- Figure 80: East Asia ADAS Aftermarket Attractiveness Analysis by Sales-Channel, 2023-2033
- Figure 81: South Asia & Pacific ADAS Aftermarket Share and BPS Analysis by Country - 2023-2033
- Figure 82: South Asia & Pacific ADAS Aftermarket Y-o-Y Growth Projections by Country, 2023-2033
- Figure 83: South Asia & Pacific ADAS Aftermarket Attractiveness by Country, 2023-2033
- Figure 84: South Asia & Pacific ADAS Aftermarket Share and BPS Analysis by System Type, 2023 & 2033
- Figure 85: South Asia & Pacific ADAS Aftermarket Y-o-Y Growth Projection by System Type, 2023-2033
- Figure 86: South Asia & Pacific ADAS Aftermarket Attractiveness Analysis by System Type, 2023-2033
- Figure 87: South Asia & Pacific ADAS Aftermarket Share and BPS Analysis by Technology, 2023 & 2033
- Figure 88: South Asia & Pacific ADAS Aftermarket Y-o-Y Growth Projection by Technology, 2023-2033
- Figure 89: South Asia & Pacific ADAS Aftermarket Attractiveness Analysis by Technology, 2023-2033
- Figure 90: South Asia & Pacific ADAS Aftermarket Share and BPS Analysis by Vehicle Type, 2023 & 2033
- Figure 91: South Asia & Pacific ADAS Aftermarket Y-o-Y Growth Projection by Vehicle Type, 2023-2033
- Figure 92: South Asia & Pacific ADAS Aftermarket Attractiveness Analysis by Vehicle Type, 2023-2033
- Figure 93: South Asia & Pacific ADAS Aftermarket Share and BPS Analysis by Sales-Channel, 2023 & 2033
- Figure 94: South Asia & Pacific ADAS Aftermarket Y-o-Y Growth Projection by Sales-Channel, 2023-2033
- Figure 95: South Asia & Pacific ADAS Aftermarket Attractiveness Analysis by Sales-Channel, 2023-2033
- Figure 96: Middle East & Africa ADAS Aftermarket Share and BPS Analysis by Country - 2023-2033
- Figure 97: Middle East & Africa ADAS Aftermarket Y-o-Y Growth Projections by Country, 2023-2033
- Figure 98: Middle East & Africa ADAS Aftermarket Attractiveness by Country, 2023-2033
- Figure 99: Middle East & Africa ADAS Aftermarket Share and BPS Analysis by System Type, 2023 & 2033
- Figure 100: Middle East & Africa ADAS Aftermarket Y-o-Y Growth Projection by System Type, 2023-2033
- Figure 101: Middle East & Africa ADAS Aftermarket Attractiveness Analysis by System Type, 2023-2033
- Figure 102: Middle East & Africa ADAS Aftermarket Share and BPS Analysis by Technology, 2023 & 2033
- Figure 103: Middle East & Africa ADAS Aftermarket Y-o-Y Growth Projection by Technology, 2023-2033
- Figure 104: Middle East & Africa ADAS Aftermarket Attractiveness Analysis by Technology, 2023-2033
- Figure 105: Middle East & Africa ADAS Aftermarket Share and BPS Analysis by Vehicle Type, 2023 & 2033
- Figure 106: Middle East & Africa ADAS Aftermarket Y-o-Y Growth Projection by Vehicle Type, 2023-2033
- Figure 107: Middle East & Africa ADAS Aftermarket Attractiveness Analysis by Vehicle Type, 2023-2033
- Figure 108: Middle East & Africa ADAS Aftermarket Share and BPS Analysis by Sales-Channel, 2023 & 2033
- Figure 109: Middle East & Africa ADAS Aftermarket Y-o-Y Growth Projection by Sales-Channel, 2023-2033
- Figure 110: Middle East & Africa ADAS Aftermarket Attractiveness Analysis by Sales-Channel, 2023-2033
Global ADAS Aftermarket - Report Scope
Persistence Market Research recently published a new report on the global ADAS Aftermarket. The report provides detailed valuation on key market dynamics, such as the drivers, trends, opportunities, and restraints, along with detailed information about the market structure. This research report presents exclusive facts and figures about how the global ADAS Aftermarket will grow over the forecast period of 2023 to 2033.
Key indicators of market background, such as value chain analysis and supply chain, compounded annual growth rate (CAGR), and year-on-year (Y-o-Y) growth of the market are explained in Persistence Market Research's study in a comprehensive manner. This information can help readers understand the quantitative development projections of the global ADAS Aftermarket over the forecast period.
The study is relevant for stakeholders in the global ADAS Aftermarket, as well as manufacturers, distributors, suppliers, and investors, as it can help them understand applicable strategies to grow in the aftermarket. Stakeholders, investors, industry experts, researchers, and journalists, as well as business researchers in market can leverage the information and statistics presented in research report.
The report includes facts & figures related to the micro- as well as macro-economic factors that are impacting the growth of the global ADAS Aftermarket. The study also offers actionable insights based on the future trends in the aftermarket. Furthermore, domestic players and new entrants in the market can also use the information presented in this report to make business decisions and gain momentum in the market.
Key Segments of Market
Persistence Market Research's study on the global ADAS Aftermarket is divided into four significant segments - by system type, by technology type, by vehicle type by sales-channel, and by region. This report offers comprehensive data and information about the important market dynamics and growth parameters related to these categories.
By System Type
Adaptive Cruise Control
Adaptive Front Light
Automatic Emergency Braking
Blind Spot Detection
Driver Monitoring Systems
Forward Collision Warning
Lane Departure Warning / Lane Keep Assist
Park Assist
Tire Pressure Monitoring Systems
Night Vision Systems
By Technology Type
Ultrasonic Sensors
Lidar Sensors
Radar Sensors
Camera Sensors
Infrared Sensors
Pressure Sensors
By Vehicle Type
Passenger Cars
Light Commercial Vehicles
Heavy Commercial Vehicles
By Sales Channel
OES (Original Equipment Suppliers)
IAM (Independent Aftermarket)
By Region
North America
Latin America
Europe
East Asia
South Asia & Pacific
Middle East & Africa
Key Questions Answered in Report:
What will be the key driving factors propelling the demand for ADAS Aftermarket during the forecast period?
How current trends will impact the global ADAS Aftermarket?
Who are significant market participants in the market?
What are the crucial strategies of prominent players in the global ADAS Aftermarket to upscale their positions in this landscape?
Which region is anticipated to hold a prominent market share over the forecast period?
Research Methodology
In Persistence Market Research's research report, exclusive research methodology is utilized to conduct comprehensive research on the development of the global ADAS Aftermarket, and reach conclusions on the future growth factors of the market. In this research methodology, secondary and primary research is utilized by analysts to ensure the precision and reliability of the conclusions.
Secondary resources are referred by analysts during the evaluation of the global ADAS Aftermarket study, which comprise facts and figures from white papers, trade journals, and external and internal databases. Analysts have thoroughly interviewed several industry experts, such as sales supervisors, sales operation managers, product portfolio managers, senior managers, market intelligence managers, marketing/product managers, engineering managers, and production managers to provide insightful information.
Comprehensive information acquired from primary and secondary resources is validated from companies operating in the global ADAS Aftermarket, to make Persistence Market Research's projections on the growth prospects of the market more accurate and reliable.
Table of Contents
1. Executive Summary
- 1.1. Global Market Outlook
- 1.2. Demand Side Trends
- 1.3. Supply Side Trends
- 1.4. Analysis and Recommendations
2. Market Overview
- 2.1. Market Coverage / Taxonomy
- 2.2. Market Definition / Scope / Limitations
3. Key Market Trends
- 3.1. Key Trends Impacting the Market
4. Key Success Factors
5. Global Aftermarket Demand Analysis 2017-2022 and Forecast, 2023-2033
- 5.1. Historical Market Volume (Units) Analysis, 2017-2022
- 5.2. Current and Future Market Volume (Units) Projections, 2023-2033
- 5.3. Y-o-Y Growth Trend Analysis
6. Global Aftermarket - Pricing Analysis
- 6.1. Regional Pricing Analysis By System Type
- 6.2. Global Average Pricing Analysis Benchmark
7. Global Aftermarket Demand (in Value or Size in US$ Mn) Analysis 2017-2022 and Forecast, 2023-2033
- 7.1. Historical Market Value (US$ Mn) Analysis, 2017-2022
- 7.2. Current and Future Market Value (US$ Mn) Projections, 2023-2033
- 7.2.1. Y-o-Y Growth Trend Analysis
- 7.2.2. Absolute $ Opportunity Analysis
8. Market Background
- 8.1. Macro-Economic Factors
- 8.1.1. Global Economic Growth Outlook
- 8.1.2. Real GDP Growth
- 8.1.3. Industry Value Added
- 8.1.4. Urban Population
- 8.1.5. Global Automotive Industry Outlook
- 8.2. Forecast Factors - Relevance & Impact
- 8.2.1. GDP Growth
- 8.2.2. Transportation Network
- 8.2.3. Automotive manufacturing Industry Growth
- 8.2.4. Commercial Industry Growth
- 8.2.5. Urbanization Trends
- 8.2.6. Automotive sensor System Forecast
- 8.3. Value Chain
- 8.3.1. List of Manufacturers
- 8.4. COVID-19 Crisis - Impact Assessment
- 8.4.1. Current Statistics
- 8.4.2. Short-Mid-Long Term Outlook
- 8.4.3. Likely Rebound
- 8.5. Market Dynamics
- 8.5.1. Drivers
- 8.5.2. Restraints
- 8.5.3. Opportunity Analysis
- 8.6. National Electrical Manufacturers Association Standards
9. Global Aftermarket Analysis 2017-2022 and Forecast 2023-2033, By System Type
- 9.1. Introduction / Key Findings
- 9.2. Historical Market Size (US$ Mn) and Volume Analysis by System Type, 2017-2022
- 9.3. Current and Future Market Size (US$ Mn) and Volume Analysis and Forecast by System Type, 2023-2033
- 9.3.1. Adaptive Cruise Control
- 9.3.2. Adaptive Front Light
- 9.3.3. Automatic Emergency Braking
- 9.3.4. Blind Spot Detection
- 9.3.5. Driver Monitoring Systems
- 9.3.6. Forward Collision Warning
- 9.3.7. Lane Departure Warning / Lane Keep Assist
- 9.3.8. Park Assist
- 9.3.9. Tire Pressure Monitoring Systems
- 9.3.10. Night Vision Systems
- 9.4. Market Attractiveness Analysis by System Type
10. Global Aftermarket Analysis 2017-2022 and Forecast 2023-2033, By Technology
- 10.1. Introduction / Key Findings
- 10.2. Historical Market Size (US$ Mn) and Volume Analysis by Technology, 2017-2022
- 10.3. Current and Future Market Size (US$ Mn) and Volume Analysis and Forecast by Technology, 2023-2033
- 10.3.1. Ultrasonic Sensors
- 10.3.2. Lidar Sensors
- 10.3.3. Radar Sensors
- 10.3.4. Camera Sensors
- 10.3.5. Infrared Sensors
- 10.3.6. Pressure Sensors
- 10.4. Market Attractiveness Analysis By Technology
11. Global Aftermarket Analysis 2017-2022 and Forecast 2023-2033, By Vehicle Type
- 11.1. Introduction / Key Findings
- 11.2. Historical Market Size (US$ Mn) and Volume Analysis By Vehicle Type, 2017-2022
- 11.3. Current and Future Market Size (US$ Mn) and Volume Analysis and Forecast By Vehicle Type, 2023-2033
- 11.3.1. Passenger Cars
- 11.3.2. Light Commercial Vehicles
- 11.3.3. Heavy Commercial Vehicles
- 11.4. Market Attractiveness Analysis By Vehicle Type
12. Global Aftermarket Analysis 2017-2022 and Forecast 2023-2033, By Sales-Channel
- 12.1. Introduction / Key Findings
- 12.2. Historical Market Size (US$ Mn) and Volume Analysis By Sales-Channel, 2017-2022
- 12.3. Current and Future Market Size (US$ Mn) and Volume Analysis and Forecast By Sales-Channel, 2023-2033
- 12.3.1. OES (Original Equipment Suppliers)
- 12.3.2. IAM (Independent Aftermarket)
- 12.4. Market Attractiveness Analysis By Sales-Channel
13. Global Aftermarket Analysis 2017-2022 and Forecast 2023-2033, by Region
- 13.1. Introduction
- 13.2. Historical Market Size (US$ Mn) and Volume Analysis By Region, 2017-2022
- 13.3. Current Market Size (US$ Mn) and Volume Analysis and Forecast By Region, 2023-2033
- 13.3.1. North America
- 13.3.2. Latin America
- 13.3.3. Europe
- 13.3.4. East Asia
- 13.3.5. South Asia and the Pacific
- 13.3.6. The Middle East and Africa (MEA)
- 13.4. Market Attractiveness Analysis By Region
14. North America Aftermarket Analysis 2017-2022 and Forecast 2023-2033
- 14.1. Introduction
- 14.2. Historical Market Size (US$ Mn) and Volume Trend Analysis By Market Taxonomy, 2017-2022
- 14.3. Market Size (US$ Mn) and Volume Forecast By Market Taxonomy, 2023-2033
- 14.3.1. By Country
- 14.3.1.1. U.S.
- 14.3.1.2. Canada
- 14.3.2. By System Type
- 14.3.3. By Technology
- 14.3.4. By Vehicle Type
- 14.3.5. By Sales-Channel
- 14.3.1. By Country
- 14.4. Market Attractiveness Analysis
- 14.4.1. By Country
- 14.4.2. By System Type
- 14.4.3. By Technology
- 14.4.4. By Vehicle Type
- 14.4.5. By Sales-Channel
15. Latin America Aftermarket Analysis 2017-2022 and Forecast 2023-2033
- 15.1. Introduction
- 15.2. Historical Market Size (US$ Mn) and Volume Trend Analysis By Market Taxonomy, 2017-2022
- 15.3. Market Size (US$ Mn) and Volume Forecast By Market Taxonomy, 2023-2033
- 15.3.1. By Country
- 15.3.1.1. Brazil
- 15.3.1.2. Mexico
- 15.3.1.3. Rest of Latin America
- 15.3.2. By System Type
- 15.3.3. By Technology
- 15.3.4. By Vehicle Type
- 15.3.5. By Sales-Channel
- 15.3.1. By Country
- 15.4. Market Attractiveness Analysis
- 15.4.1. By Country
- 15.4.2. By System Type
- 15.4.3. By Technology
- 15.4.4. By Vehicle Type
- 15.4.5. By Sales-Channel
16. Europe Aftermarket Analysis 2017-2022 and Forecast 2023-2033
- 16.1. Introduction
- 16.2. Historical Market Size (US$ Mn) and Volume Trend Analysis By Market Taxonomy, 2017-2022
- 16.3. Market Size (US$ Mn) and Volume Forecast By Market Taxonomy, 2023-2033
- 16.3.1. By Country
- 16.3.1.1. Germany
- 16.3.1.2. Italy
- 16.3.1.3. France
- 16.3.1.4. The U.K.
- 16.3.1.5. Spain
- 16.3.1.6. BENELUX
- 16.3.1.7. Russia
- 16.3.1.8. Rest of Europe
- 16.3.2. By System Type
- 16.3.3. By Technology
- 16.3.4. By Vehicle Type
- 16.3.5. By Sales-Channel
- 16.3.1. By Country
- 16.4. Market Attractiveness Analysis
- 16.4.1. By Country
- 16.4.2. By System Type
- 16.4.3. By Technology
- 16.4.4. By Vehicle Type
- 16.4.5. By Sales-Channel
17. East Asia Aftermarket Analysis 2017-2022 and Forecast 2023-2033
- 17.1. Introduction
- 17.2. Historical Market Size (US$ Mn) and Volume Trend Analysis By Market Taxonomy, 2017-2022
- 17.3. Market Size (US$ Mn) and Volume Forecast By Market Taxonomy, 2023-2033
- 17.3.1. By Country
- 17.3.1.1. China
- 17.3.1.2. Japan
- 17.3.1.3. South Korea
- 17.3.2. By System Type
- 17.3.3. By Technology
- 17.3.4. By Vehicle Type
- 17.3.5. By Sales-Channel
- 17.3.1. By Country
- 17.4. Market Attractiveness Analysis
- 17.4.1. By Country
- 17.4.2. By System Type
- 17.4.3. By Technology
- 17.4.4. By Vehicle Type
- 17.4.5. By Sales-Channel
18. South Asia and Pacific Aftermarket Analysis 2017-2022 and Forecast 2023-2033
- 18.1. Introduction
- 18.2. Historical Market Size (US$ Mn) and Volume Trend Analysis By Market Taxonomy, 2017-2022
- 18.3. Market Size (US$ Mn) and Volume Forecast By Market Taxonomy, 2023-2033
- 18.3.1. By Country
- 18.3.1.1. India
- 18.3.1.2. ASEAN
- 18.3.1.3. ANZ
- 18.3.1.4. Rest of South Asia & Pacific
- 18.3.2. By System Type
- 18.3.3. By Technology
- 18.3.4. By Vehicle Type
- 18.3.5. By Sales-Channel
- 18.3.1. By Country
- 18.4. Market Attractiveness Analysis
- 18.4.1. By Country
- 18.4.2. By System Type
- 18.4.3. By Technology
- 18.4.4. By Vehicle Type
- 18.4.5. By Sales-Channel
19. The Middle East and Africa Aftermarket Analysis 2017-2022 and Forecast 2023-2033
- 19.1. Introduction
- 19.2. Historical Market Size (US$ Mn) and Volume Trend Analysis By Market Taxonomy, 2017-2022
- 19.3. Market Size (US$ Mn) and Volume Forecast By Market Taxonomy, 2023-2033
- 19.3.1. By Country
- 19.3.1.1. GCC Countries
- 19.3.1.2. Turkey
- 19.3.1.3. Northern Africa
- 19.3.1.4. South Africa
- 19.3.1.5. Rest of the Middle East and Africa
- 19.3.2. By System Type
- 19.3.3. By Technology
- 19.3.4. By Vehicle Type
- 19.3.5. By Sales-Channel
- 19.3.1. By Country
- 19.4. Market Attractiveness Analysis
- 19.4.1. By Country
- 19.4.2. By System Type
- 19.4.3. By Technology
- 19.4.4. By Vehicle Type
- 19.4.5. By Sales-Channel
20. Country Wise Aftermarket Analysis
- 20.1. U.S. Aftermarket Analysis
- 20.1.1. By System Type
- 20.1.2. By Technology
- 20.1.3. By Vehicle Type
- 20.1.4. By Sales-Channel
- 20.2. Canada Aftermarket Analysis
- 20.2.1. By System Type
- 20.2.2. By Technology
- 20.2.3. By Vehicle Type
- 20.2.4. By Sales-Channel
- 20.3. Mexico Aftermarket Analysis
- 20.3.1. By System Type
- 20.3.2. By Technology
- 20.3.3. By Vehicle Type
- 20.3.4. By Sales-Channel
- 20.4. Brazil Aftermarket Analysis
- 20.4.1. By System Type
- 20.4.2. By Technology
- 20.4.3. By Vehicle Type
- 20.4.4. By Sales-Channel
- 20.5. Germany Aftermarket Analysis
- 20.5.1. By System Type
- 20.5.2. By Technology
- 20.5.3. By Vehicle Type
- 20.5.4. By Sales-Channel
- 20.6. Italy Aftermarket Analysis
- 20.6.1. By System Type
- 20.6.2. By Technology
- 20.6.3. By Vehicle Type
- 20.6.4. By Sales-Channel
- 20.7. France Aftermarket Analysis
- 20.7.1. By System Type
- 20.7.2. By Technology
- 20.7.3. By Vehicle Type
- 20.7.4. By Sales-Channel
- 20.8. U.K. Aftermarket Analysis
- 20.8.1. By System Type
- 20.8.2. By Technology
- 20.8.3. By Vehicle Type
- 20.8.4. By Sales-Channel
- 20.9. Spain Aftermarket Analysis
- 20.9.1. By System Type
- 20.9.2. By Technology
- 20.9.3. By Vehicle Type
- 20.9.4. By Sales-Channel
- 20.10. BENELUX Aftermarket Analysis
- 20.10.1. By System Type
- 20.10.2. By Technology
- 20.10.3. By Vehicle Type
- 20.10.4. By Sales-Channel
- 20.11. Russia Aftermarket Analysis
- 20.11.1. By System Type
- 20.11.2. By Technology
- 20.11.3. By Vehicle Type
- 20.11.4. By Sales-Channel
- 20.12. China Aftermarket Analysis
- 20.12.1. By System Type
- 20.12.2. By Technology
- 20.12.3. By Vehicle Type
- 20.12.4. By Sales-Channel
- 20.13. Japan Aftermarket Analysis
- 20.13.1. By System Type
- 20.13.2. By Technology
- 20.13.3. By Vehicle Type
- 20.13.4. By Sales-Channel
- 20.14. S. Korea Aftermarket Analysis
- 20.14.1. By System Type
- 20.14.2. By Technology
- 20.14.3. By Vehicle Type
- 20.14.4. By Sales-Channel
- 20.15. India Aftermarket Analysis
- 20.15.1. By System Type
- 20.15.2. By Technology
- 20.15.3. By Vehicle Type
- 20.15.4. By Sales-Channel
- 20.16. ASEAN Aftermarket Analysis
- 20.16.1. By System Type
- 20.16.2. By Technology
- 20.16.3. By Vehicle Type
- 20.16.4. By Sales-Channel
- 20.17. Australia and New Zealand Aftermarket Analysis
- 20.17.1. By System Type
- 20.17.2. By Technology
- 20.17.3. By Vehicle Type
- 20.17.4. By Sales-Channel
- 20.18. GCC Countries Aftermarket Analysis
- 20.18.1. By System Type
- 20.18.2. By Technology
- 20.18.3. By Vehicle Type
- 20.18.4. By Sales-Channel
- 20.19. Turkey Aftermarket Analysis
- 20.19.1. By System Type
- 20.19.2. By Technology
- 20.19.3. By Vehicle Type
- 20.19.4. By Sales-Channel
- 20.20. Northern Africa Aftermarket Analysis
- 20.20.1. By System Type
- 20.20.2. By Technology
- 20.20.3. By Vehicle Type
- 20.20.4. By Sales-Channel
- 20.21. South Africa Aftermarket Analysis
- 20.21.1. By System Type
- 20.21.2. By Technology
- 20.21.3. By Vehicle Type
- 20.21.4. By Sales-Channel
21. Market Structure Analysis
- 21.1. Market Analysis by Tier of Companies (ADAS Aftermarket)
- 21.2. Market Share Analysis of Top Players
- 21.3. Market Presence Analysis
22. Competition Analysis
- 22.1. Competition Dashboard
- 22.2. Competition Benchmarking
- 22.3. Competition Deep Dive
- 22.3.1. Robert Bosch GmbH
- 22.3.1.1. Overview
- 22.3.1.2. System Portfolio
- 22.3.1.3. Key Financials by Market Segments (System/Region)
- 22.3.1.4. Sales Footprint
- 22.3.1.5. Strategy Overview
- 22.3.2. Continental AG
- 22.3.2.1. Overview
- 22.3.2.2. System Portfolio
- 22.3.2.3. Key Financials by Market Segments (System/Region)
- 22.3.2.4. Sales Footprint
- 22.3.2.5. Strategy Overview
- 22.3.3. ZF Friedrichshafen AG
- 22.3.3.1. Overview
- 22.3.3.2. System Portfolio
- 22.3.3.3. Key Financials by Market Segments (System/Region)
- 22.3.3.4. Sales Footprint
- 22.3.3.5. Strategy Overview
- 22.3.4. Denso Corp.
- 22.3.4.1. Overview
- 22.3.4.2. System Portfolio
- 22.3.4.3. Key Financials by Market Segments (System/Region)
- 22.3.4.4. Sales Footprint
- 22.3.4.5. Strategy Overview
- 22.3.5. Aptiv plc
- 22.3.5.1. Overview
- 22.3.5.2. System Portfolio
- 22.3.5.3. Key Financials by Market Segments (System/Region)
- 22.3.5.4. Sales Footprint
- 22.3.5.5. Strategy Overview
- 22.3.6. Valeo SA
- 22.3.6.1. Overview
- 22.3.6.2. System Portfolio
- 22.3.6.3. Key Financials by Market Segments (System/Region)
- 22.3.6.4. Sales Footprint
- 22.3.6.5. Strategy Overview
- 22.3.7. Magna International Inc.
- 22.3.7.1. Overview
- 22.3.7.2. System Portfolio
- 22.3.7.3. Key Financials by Market Segments (System/Region)
- 22.3.7.4. Sales Footprint
- 22.3.7.5. Strategy Overview
- 22.3.8. Veoneer Inc.
- 22.3.8.1. Overview
- 22.3.8.2. System Portfolio
- 22.3.8.3. Key Financials by Market Segments (System/Region)
- 22.3.8.4. Sales Footprint
- 22.3.8.5. Strategy Overview
- 22.3.9. Aisin Corporation
- 22.3.9.1. Overview
- 22.3.9.2. System Portfolio
- 22.3.9.3. Key Financials by Market Segments (System/Region)
- 22.3.9.4. Sales Footprint
- 22.3.9.5. Strategy Overview
- 22.3.10. Hitachi Astemo, Ltd.
- 22.3.10.1. Overview
- 22.3.10.2. System Portfolio
- 22.3.10.3. Key Financials by Market Segments (System/Region)
- 22.3.10.4. Sales Footprint
- 22.3.10.5. Strategy Overview
- 22.3.11. Nidec Corporation
- 22.3.11.1. Overview
- 22.3.11.2. System Portfolio
- 22.3.11.3. Key Financials by Market Segments (System/Region)
- 22.3.11.4. Sales Footprint
- 22.3.11.5. Strategy Overview
- 22.3.12. Infineon Technologies AG
- 22.3.12.1. Overview
- 22.3.12.2. System Portfolio
- 22.3.12.3. Key Financials by Market Segments (System/Region)
- 22.3.12.4. Sales Footprint
- 22.3.12.5. Strategy Overview
- 22.3.13. Ficosa Internacional SA
- 22.3.13.1. Overview
- 22.3.13.2. System Portfolio
- 22.3.13.3. Key Financials by Market Segments (System/Region)
- 22.3.13.4. Sales Footprint
- 22.3.13.5. Strategy Overview
- 22.3.14. Hella KGaA Hueck & Co.
- 22.3.14.1. Overview
- 22.3.14.2. System Portfolio
- 22.3.14.3. Key Financials by Market Segments (System/Region)
- 22.3.14.4. Sales Footprint
- 22.3.14.5. Strategy Overview
- 22.3.15. Pacific Industrial Co., Ltd.
- 22.3.15.1. Overview
- 22.3.15.2. System Portfolio
- 22.3.15.3. Key Financials by Market Segments (System/Region)
- 22.3.15.4. Sales Footprint
- 22.3.15.5. Strategy Overview
- 22.3.16. Mobileye
- 22.3.16.1. Overview
- 22.3.16.2. System Portfolio
- 22.3.16.3. Key Financials by Market Segments (System/Region)
- 22.3.16.4. Sales Footprint
- 22.3.16.5. Strategy Overview
- 22.3.1. Robert Bosch GmbH