|
|
市場調査レポート
商品コード
1495381
ラプチャーディスク市場:世界の産業分析、規模、シェア、成長、動向、2024-2033年予測Rupture Disc Market: Global Industry Analysis, Size, Share, Growth, Trends, and Forecast, 2024-2033 |
||||||

|
|||||||
カスタマイズ可能
|
|||||||

| ラプチャーディスク市場:世界の産業分析、規模、シェア、成長、動向、2024-2033年予測 |
|
出版日: 2024年05月10日
発行: Persistence Market Research
ページ情報: 英文 248 Pages
納期: 2~5営業日
|

全表示
- 概要
- 目次
Persistence Market Research社はこのほど、ラプチャーディスクの世界市場に関する包括的なレポートを発表しました。当レポートでは、市場促進要因・動向・機会・課題を含む重要な市場ダイナミクスを徹底的に評価し、市場構造に関する詳細な洞察を提供しています。
主な洞察
- ラプチャーディスクの市場規模(2024E):6億5,362万米ドル
- 予測市場価値(2033F):9億1,420万米ドル
- 世界市場成長率(CAGR 2024年~2033年):3.8%
ラプチャーディスク市場:調査範囲
破裂ディスクとしても知られるラプチャーディスクは、機器、容器、パイプラインを過圧状態から保護するために設計された重要な安全装置です。ラプチャーディスクはフェイルセーフ機構として機能し、内圧が所定の限界に達するまで漏れのない密閉を提供します。ラプチャーディスク市場は、石油・ガス、化学、食品・飲食品、エネルギーなど幅広い業界に対応しており、順作動型、逆作動型、グラファイト製など、さまざまなタイプのラプチャーディスクを提供しています。
市場促進要因:
世界のラプチャーディスク市場は、産業安全の重視の高まりや、様々な産業における過圧保護を規定する厳しい規制など、いくつかの主要な要因によって推進されています。産業事故の増加や、それに伴う信頼性の高い安全装置への需要が、市場の拡大をさらに後押ししています。高性能材料の市場開拓や革新的なラプチャーディスク設計などの技術進歩は、信頼性の向上と長寿命化を実現し、市場の成長を促進しています。さらに、デジタル監視システムの採用増加やIoT技術とラプチャーディスクの統合は、安全性と業務効率を高めるための新たな道を市場関係者にもたらします。
市場抑制要因:
有望な成長見通しにもかかわらず、ラプチャーディスク市場は、高度なラプチャーディスク技術の高コストと、設置およびメンテナンス手順の複雑さに関連する課題に直面しています。ラプチャーディスクの設計、試験、認証を規定する厳しい規制と規格は、メーカーにコンプライアンス上の負担を課し、市場参入障壁と運用コストに影響を与えています。さらに、特定の業界や地域では、ラプチャー・ディスクの用途に対する認識や理解が限られているため、市場浸透のための課題となっています。こうした規制や教育の障壁に対処するには、業界利害関係者と規制機関が協力して、先進的なラプチャーディスク・ソリューションの採用を促進する必要があります。
市場機会:
ラプチャーディスク市場は、技術革新、産業分野の拡大、安全性と環境保護への関心の高まりによって、大きな成長機会をもたらしています。遠隔監視や予知保全システムなどのデジタル技術の統合は、ラプチャーディスクの機能性と信頼性を高め、安全性を向上させる。さらに、再生可能エネルギーやバイオテクノロジーなどの新興分野でのラプチャーディスクの用途拡大が、市場の範囲を広げ、技術革新を刺激しています。戦略的パートナーシップ、研究開発への投資、費用対効果が高くユーザーフレンドリーなラプチャーディスクソリューションの導入は、新たな機会を活用し、ダイナミックなラプチャーディスクランドスケープにおける市場のリーダーシップを維持するために不可欠です。
本レポートで扱う主な質問
- 世界のラプチャーディスク市場の成長を促進する主な要因は何か?
- どのラプチャーディスクの種類と用途が各業界で採用を促進しているか?
- 技術進歩はどのようにラプチャーディスク市場の競合情勢を変えているのか?
- ラプチャーディスク市場に貢献している主要プレーヤーは誰で、市場の関連性を維持するためにどのような戦略を採用しているのか?
- 世界のラプチャーディスク市場における新たな動向と将来性は?
目次
第1章 エグゼクティブサマリー
第2章 市場概要
- 市場範囲/ 分類
- 市場の定義/ 範囲/ 制限
第3章 主要な市場動向
- 市場に影響を与える主な動向
- 製品イノベーション/開発動向
第4章 重要成功要因
- 製品の採用/使用状況分析
- 製品のUSP/特徴
- 戦略的プロモーション戦略
第5章 世界市場の需要分析
- 過去の市場(数量)分析、2019年~2023年
- 現在および将来の市場(数量)予測、2024年~2033年
- 前年比成長動向分析
第6章 世界市場- 価格分析
- 地域別価格分析
- 世界平均価格分析ベンチマーク
第7章 世界市場の需要(金額)分析
- 過去の市場(金額)分析、2019年~2023年
- 現在および将来の市場(金額)予測、2024~2033年
- 前年比成長動向分析
- 絶対的収益機会分析
第8章 市場背景
- マクロ経済要因
- 予測要因- 関連性と影響
- バリューチェーン
- COVID-19危機- 影響評価
- 市場力学
第9章 世界市場分析:材料タイプ別
- イントロダクション/主な調査結果
- 過去の市場規模(金額・数量)分析、2019年~2023年
- 現在および将来の市場規模(金額・数量)分析と予測、2024~2033年
- グラファイト破裂ディスク
- 金属製破裂板
- 材料タイプ別市場の魅力分析
第10章 世界市場分析:製品タイプ別
- イントロダクション/主な調査結果
- 過去の市場規模(金額・数量)分析、2019年~2023年
- 現在および将来の市場規模(金額・数量)分析と予測、2024~2033年
- ポジティブアーチラプチャーディスク
- アンチアーチラプチャーディスク
- フラット型ラプチャーディスク
- 製品タイプ別市場の魅力分析
第11章 世界市場分析:用途別
- イントロダクション/主な調査結果
- 過去の市場規模(金額・数量)分析、2019年~2023年
- 現在および将来の市場規模(金額・数量)分析と予測、2024~2033年
- スタンドアロンラプチャーディスク
- 安全弁と併用のラプチャーディスク
- 用途別の市場の魅力分析
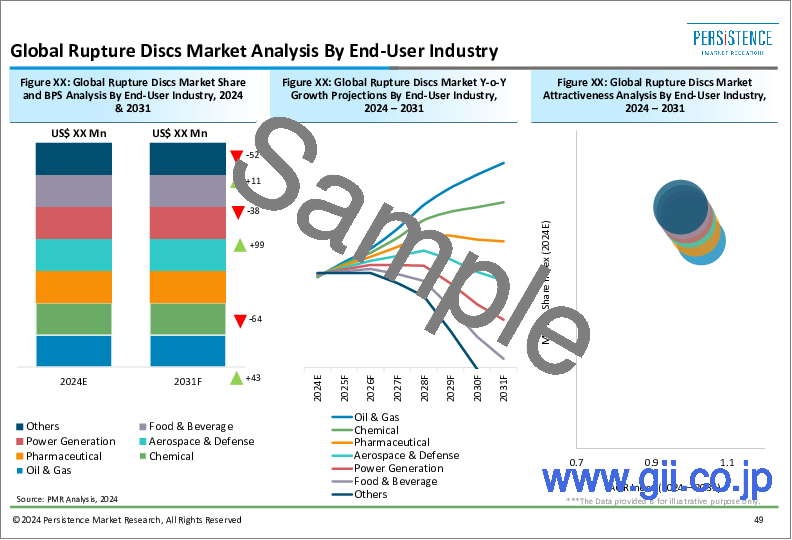
第12章 世界市場分析:エンドユーザー別
- イントロダクション/主な調査結果
- 過去の市場規模(金額・数量)分析、2019年~2023年
- 現在および将来の市場規模(金額・数量)分析と予測、2024~2033年
- 輸送機関
- 航空宇宙
- 自動車
- 石油・ガス
- エネルギー
- 化学薬品
- 医薬品
- その他
- エンドユーザー別市場の魅力分析
第13章 地域別世界市場分析
- イントロダクション
- 過去の市場規模(金額・数量)分析、2019年~2023年
- 現在および将来の市場規模(金額・数量)分析と予測、2024~2033年
- 北米
- ラテンアメリカ
- 欧州
- 東アジア
- 南アジアおよび太平洋
- 中東およびアフリカ
- 地域別市場の魅力分析
第14章 北米市場分析
第15章 ラテンアメリカ市場分析
第16章 欧州市場分析
第17章 東アジア市場分析
第18章 南アジアおよび太平洋地域の市場分析
第19章 中東・アフリカ市場分析
第20章 国別市場分析2024-2033年
- イントロダクション
- 米国市場分析
- カナダ市場分析
- メキシコ市場分析
- ブラジル市場分析
- ドイツ市場分析
- イタリア市場分析
- フランス市場分析
- 英国市場分析
- スペイン市場分析
- ベネルクス市場分析
- ロシア市場分析
- 中国市場分析
- 日本市場分析
- 韓国市場分析
- ASEAN市場分析
- オーストラリアとニュージーランドの市場分析
- GCC諸国の市場分析
- トルコ市場分析
- 北アフリカ市場分析
- 南アフリカ市場分析
第21章 市場構造分析
- 企業階層別市場分析(ラプチャーディスク)
- 主要企業の市場シェア分析
- 市場プレゼンス分析
第22章 競合分析
- 競合ダッシュボード
- 競合ベンチマーク
- 競合の詳細
- Emerson Electric Co
- BS&B Safety Systems, LLC
- Fike Corporation
- Parker Hannifin Corp
- Halma Plc
- Graco Inc.
- V-TEX Corp.
- Continental Disc Corporation LLC
- Mersen Group
- WOLFF GROUP
- BASCO
- REMBE
- Shanghai Huali Safety Devices Co., Ltd
- Dalian Duta Technology Safety System Co Ltd
第23章 使用される前提条件と頭字語
第24章 調査手法
Persistence Market Research has recently released a comprehensive report on the worldwide market for rupture discs. The report offers a thorough assessment of crucial market dynamics, including drivers, trends, opportunities, and challenges, providing detailed insights into the market structure.
Key Insights:
- Rupture Disc Market Size (2024E): USD 653.62 Million
- Projected Market Value (2033F): USD 914.2 Million
- Global Market Growth Rate (CAGR 2024 to 2033): 3.8%
Rupture Disc Market - Report Scope:
Rupture discs, also known as burst discs, are critical safety devices designed to protect equipment, vessels, and pipelines from overpressure conditions. They serve as a fail-safe mechanism, providing a leak-tight seal until the internal pressure reaches a predetermined limit, at which point they burst to release pressure, preventing catastrophic failures. The rupture disc market caters to a wide range of industries, including oil and gas, chemical, pharmaceutical, food and beverage, and energy, offering various types of rupture discs such as forward-acting, reverse-acting, and graphite rupture discs.
Market Growth Drivers:
The global rupture disc market is propelled by several key factors, including the increasing emphasis on industrial safety and the stringent regulations governing overpressure protection in various industries. The rising incidents of industrial accidents and the subsequent demand for reliable safety devices further drive market expansion. Technological advancements, such as the development of high-performance materials and innovative rupture disc designs, offer enhanced reliability and longer service life, fostering market growth. Moreover, the increasing adoption of digital monitoring systems and the integration of IoT technologies with rupture discs create new avenues for market players to enhance safety and operational efficiency.
Market Restraints:
Despite promising growth prospects, the rupture disc market faces challenges related to the high cost of advanced rupture disc technologies and the complexity of installation and maintenance procedures. Stringent regulations and standards governing the design, testing, and certification of rupture discs impose compliance burdens on manufacturers, affecting market entry barriers and operational costs. Furthermore, the limited awareness and understanding of rupture disc applications in certain industries and regions pose challenges for market penetration. Addressing these regulatory and educational barriers requires collaboration between industry stakeholders and regulatory bodies to promote the adoption of advanced rupture disc solutions.
Market Opportunities:
The rupture disc market presents significant growth opportunities driven by technological innovations, the expansion of industrial sectors, and the evolving focus on safety and environmental protection. The integration of digital technologies, such as remote monitoring and predictive maintenance systems, enhances the functionality and reliability of rupture discs, improving safety outcomes. Furthermore, the increasing application of rupture discs in emerging sectors, such as renewable energy and biotechnology, broadens the market scope and stimulates innovation. Strategic partnerships, investment in research and development, and the introduction of cost-effective, user-friendly rupture disc solutions are essential to capitalize on emerging opportunities and sustain market leadership in the dynamic rupture disc landscape.
Key Questions Answered in the Report:
- What are the primary factors driving the growth of the rupture disc market globally?
- Which rupture disc types and applications are driving adoption across different industries?
- How are technological advancements reshaping the competitive landscape of the rupture disc market?
- Who are the key players contributing to the rupture disc market, and what strategies are they employing to maintain market relevance?
- What are the emerging trends and future prospects in the global rupture disc market?
Competitive Intelligence and Business Strategy:
Leading players in the global rupture disc market, including BS&B Safety Systems, Fike Corporation, and Elfab Limited, focus on innovation, product differentiation, and strategic partnerships to gain a competitive edge. These companies invest in R&D to develop advanced rupture disc solutions, including high-performance materials, digital monitoring systems, and customizable designs, catering to diverse industry needs and safety requirements. Collaborations with industrial safety experts, engineering consultants, and regulatory agencies facilitate market access and promote technology adoption. Moreover, emphasis on customer education, safety training, and regulatory compliance fosters market growth and enhances safety outcomes in the rapidly evolving rupture disc landscape.
Key Companies Profiled:
- Emerson Electric Co
- BS&B Safety Systems, L.L.C
- Fike Corporation
- Parker Hannifin Corp
- Halma Plc
- Graco Inc.
- V-TEX Corp.
- Continental Disc Corporation LLC
- Mersen Group
- WOLFF GROUP
- BASCO
- REMBE
- Shanghai Huali Safety Devices Co., Ltd
- Dalian Duta Technology Safety System Co Ltd
Key Segments Covered in Rupture Disc Industry Research
By Material Type
- Graphite Rupture Discs
- Metallic Rupture Discs
By Product Type
- Positive Arch Rupture Discs
- Anti-Arch Rupture Discs
- Flat Type Rupture Discs
By Application
- Standalone Rupture Discs
- Rupture Discs in Combination With Relief Valves
By End User
- Transportation
- Aerospace
- Automotive
- Oil and Gas
- Energy
- Chemicals
- Pharmaceuticals
- Others
By Region
- North America
- Latin America
- Europe
- East Asia
- South Asia & Pacific
- Middle East & Africa
Table of Contents
1. Executive Summary
- 1.1. Global Market Outlook
- 1.2. Demand Side Trends
- 1.3. Supply Side Trends
- 1.4. Technology Roadmap
- 1.5. Analysis and Recommendations
2. Market Overview
- 2.1. Market Coverage / Taxonomy
- 2.2. Market Definition / Scope / Limitations
3. Key Market Trends
- 3.1. Key Trends Impacting the Market
- 3.2. Product Innovation / Development Trends
4. Key Success Factors
- 4.1. Product Adoption / Usage Analysis
- 4.2. Product USPs / Features
- 4.3. Strategic Promotional Strategies
5. Global Market Demand Analysis 2019-2023 and Forecast, 2024-2033
- 5.1. Historical Market Volume ('000 Units) Analysis, 2019-2023
- 5.2. Current and Future Market Volume ('000 Units) Projections, 2024-2033
- 5.3. Y-o-Y Growth Trend Analysis
6. Global Market - Pricing Analysis
- 6.1. Regional Pricing Analysis
- 6.2. Global Average Pricing Analysis Benchmark
7. Global Market Demand (in Value or Size in US$ Mn) Analysis 2019-2023 and Forecast, 2024-2033
- 7.1. Historical Market Value (US$ Mn) Analysis, 2019-2023
- 7.2. Current and Future Market Value (US$ Mn) Projections, 2024-2033
- 7.2.1. Y-o-Y Growth Trend Analysis
- 7.2.2. Absolute $ Opportunity Analysis
8. Market Background
- 8.1. Macro-Economic Factors
- 8.1.1. Global GDP Growth Outlook
- 8.1.2. Global Oil and Gas Industry Overview
- 8.1.3. Global Chemical Industry Overview
- 8.1.4. Global Pharmaceutical Industry Outlook
- 8.1.5. Other Macro Economic Factors
- 8.2. Forecast Factors - Relevance & Impact
- 8.2.1. Top Companies Historical Growth
- 8.2.2. GDP Growth forecast
- 8.2.3. Global Infrastructure Growth Outlook
- 8.2.4. Global Urbanization Growth Outlook
- 8.2.5. Business Climate
- 8.3. Value Chain
- 8.3.1. Raw Material Suppliers
- 8.3.2. Product Manufacturers
- 8.3.3. List of key Technologies
- 8.3.4. Key Regulations
- 8.4. COVID-19 Crisis - Impact Assessment
- 8.4.1. Current Statistics
- 8.4.2. Short-Mid-Long Term Outlook
- 8.4.3. Likely Rebound
- 8.5. Market Dynamics
- 8.5.1. Drivers
- 8.5.2. Restraints
- 8.5.3. Opportunity Analysis
9. Global Market Analysis 2019-2023 and Forecast 2024-2033, By Material Type
- 9.1. Introduction / Key Findings
- 9.2. Historical Market Size (US$ Mn) and Volume Analysis By Material Type, 2019-2023
- 9.3. Current and Future Market Size (US$ Mn) and Volume Analysis and Forecast By Material Type, 2024-2033
- 9.3.1. Graphite Rupture Discs
- 9.3.2. Metallic Rupture Discs
- 9.4. Market Attractiveness Analysis By Material Type
10. Global Market Analysis 2019-2023 and Forecast 2024-2033, By Product Type
- 10.1. Introduction / Key Findings
- 10.2. Historical Market Size (US$ Mn) and Volume Analysis By Product Type, 2019-2023
- 10.3. Current and Future Market Size (US$ Mn) and Volume Analysis and Forecast By Product Type, 2024-2033
- 10.3.1. Positive Arch Rupture Discs
- 10.3.2. Anti-Arch Rupture Discs
- 10.3.3. Flat Type Rupture Discs
- 10.4. Market Attractiveness Analysis By Product Type
11. Global Market Analysis 2019-2023 and Forecast 2024-2033, by Application
- 11.1. Introduction / Key Findings
- 11.2. Historical Market Size (US$ Mn) and Volume Analysis By Application, 2019-2023
- 11.3. Current and Future Market Size (US$ Mn) and Volume Analysis and Forecast By Application, 2024-2033
- 11.3.1. Standalone Rupture Discs
- 11.3.2. Rupture Discs in Combination With Relief Valves
- 11.4. Market Attractiveness Analysis By Application
12. Global Market Analysis 2019-2023 and Forecast 2024-2033, by End User
- 12.1. Introduction / Key Findings
- 12.2. Historical Market Size (US$ Mn) and Volume Analysis By End User, 2019-2023
- 12.3. Current and Future Market Size (US$ Mn) and Volume Analysis and Forecast By End User, 2024-2033
- 12.3.1. Transportation
- 12.3.2. Aerospace
- 12.3.3. Automotive
- 12.3.4. Oil and Gas
- 12.3.5. Energy
- 12.3.6. Chemicals
- 12.3.7. Pharmaceuticals
- 12.3.8. Others
- 12.4. Market Attractiveness Analysis By End User
13. Global Market Analysis 2019-2023 and Forecast 2024-2033, by Region
- 13.1. Introduction
- 13.2. Historical Market Size (US$ Mn) and Volume Analysis By Region, 2019-2023
- 13.3. Current Market Size (US$ Mn) and Volume Analysis and Forecast By Region, 2024-2033
- 13.3.1. North America
- 13.3.2. Latin America
- 13.3.3. Europe
- 13.3.4. East Asia
- 13.3.5. South Asia and Pacific
- 13.3.6. Middle East and Africa
- 13.4. Market Attractiveness Analysis By Region
14. North America Market Analysis 2019-2023 and Forecast 2024-2033
- 14.1. Introduction
- 14.2. Pricing Analysis
- 14.3. Historical Market Size (US$ Mn) and Volume Trend Analysis By Market Taxonomy, 2019-2023
- 14.4. Market Size (US$ Mn) and Volume Forecast By Market Taxonomy, 2024-2033
- 14.4.1. By Country
- 14.4.1.1. U.S.
- 14.4.1.2. Canada
- 14.4.2. By Material Type
- 14.4.3. By Product Type
- 14.4.4. By Application
- 14.4.5. By End User
- 14.4.1. By Country
- 14.5. Market Attractiveness Analysis
- 14.5.1. By Country
- 14.5.2. By Material Type
- 14.5.3. By Product Type
- 14.5.4. By Application
- 14.5.5. By End User
- 14.6. Market Trends
- 14.7. Key Market Participants - Intensity Mapping
- 14.8. Drivers and Restraints - Impact Analysis
15. Latin America Market Analysis 2019-2023 and Forecast 2024-2033
- 15.1. Introduction
- 15.2. Pricing Analysis
- 15.3. Historical Market Size (US$ Mn) and Volume Trend Analysis By Market Taxonomy, 2019-2023
- 15.4. Market Size (US$ Mn) and Volume Forecast By Market Taxonomy, 2024-2033
- 15.4.1. By Country
- 15.4.1.1. Brazil
- 15.4.1.2. Mexico
- 15.4.1.3. Rest of Latin America
- 15.4.2. By Material Type
- 15.4.3. By Product Type
- 15.4.4. By Application
- 15.4.5. By End User
- 15.4.1. By Country
- 15.5. Market Attractiveness Analysis
- 15.5.1. By Country
- 15.5.2. By Material Type
- 15.5.3. By Product Type
- 15.5.4. By Application
- 15.5.5. By End User
- 15.6. Market Trends
- 15.7. Key Market Participants - Intensity Mapping
- 15.8. Drivers and Restraints - Impact Analysis
16. Europe Market Analysis 2019-2023 and Forecast 2024-2033
- 16.1. Introduction
- 16.2. Pricing Analysis
- 16.3. Historical Market Size (US$ Mn) and Volume Trend Analysis By Market Taxonomy, 2019-2023
- 16.4. Market Size (US$ Mn) and Volume Forecast By Market Taxonomy, 2024-2033
- 16.4.1. By Country
- 16.4.1.1. Germany
- 16.4.1.2. Italy
- 16.4.1.3. France
- 16.4.1.4. U.K.
- 16.4.1.5. Spain
- 16.4.1.6. NORDICS
- 16.4.1.7. Russia
- 16.4.1.8. Rest of Europe
- 16.4.2. By Material Type
- 16.4.3. By Product Type
- 16.4.4. By Application
- 16.4.5. By End User
- 16.4.1. By Country
- 16.5. Market Attractiveness Analysis
- 16.5.1. By Country
- 16.5.2. By Material Type
- 16.5.3. By Product Type
- 16.5.4. By Application
- 16.5.5. By End User
- 16.6. Market Trends
- 16.7. Key Market Participants - Intensity Mapping
- 16.8. Drivers and Restraints - Impact Analysis
17. East Asia Market Analysis 2019-2023 and Forecast 2024-2033
- 17.1. Introduction
- 17.2. Pricing Analysis
- 17.3. Historical Market Size (US$ Mn) and Volume Trend Analysis By Market Taxonomy, 2019-2023
- 17.4. Market Size (US$ Mn) and Volume Forecast By Market Taxonomy, 2024-2033
- 17.4.1. By Country
- 17.4.1.1. China
- 17.4.1.2. Japan
- 17.4.1.3. South Korea
- 17.4.2. By Material Type
- 17.4.3. By Product Type
- 17.4.4. By Application
- 17.4.5. By End User
- 17.4.1. By Country
- 17.5. Market Attractiveness Analysis
- 17.5.1. By Country
- 17.5.2. By Material Type
- 17.5.3. By Product Type
- 17.5.4. By Application
- 17.5.5. By End User
- 17.6. Market Trends
- 17.7. Key Market Participants - Intensity Mapping
- 17.8. Drivers and Restraints - Impact Analysis
18. South Asia and Pacific Market Analysis 2019-2023 and Forecast 2024-2033
- 18.1. Introduction
- 18.2. Pricing Analysis
- 18.3. Historical Market Size (US$ Mn) and Volume Trend Analysis By Market Taxonomy, 2019-2023
- 18.4. Market Size (US$ Mn) and Volume Forecast By Market Taxonomy, 2024-2033
- 18.4.1. By Country
- 18.4.1.1. India
- 18.4.1.2. ASEAN
- 18.4.1.3. Oceania
- 18.4.1.4. Rest of South Asia & Pacific
- 18.4.2. By Material Type
- 18.4.3. By Product Type
- 18.4.4. By Application
- 18.4.5. By End User
- 18.4.1. By Country
- 18.5. Market Attractiveness Analysis
- 18.5.1. By Country
- 18.5.2. By Material Type
- 18.5.3. By Product Type
- 18.5.4. By Application
- 18.5.5. By End User
- 18.6. Market Trends
- 18.7. Key Market Participants - Intensity Mapping
- 18.8. Drivers and Restraints - Impact Analysis
19. Middle East and Africa Market Analysis 2019-2023 and Forecast 2024-2033
- 19.1. Introduction
- 19.2. Pricing Analysis
- 19.3. Historical Market Size (US$ Mn) and Volume Trend Analysis By Market Taxonomy, 2019-2023
- 19.4. Market Size (US$ Mn) and Volume Forecast By Market Taxonomy, 2024-2033
- 19.4.1. By Country
- 19.4.1.1. GCC Countries
- 19.4.1.2. Turkey
- 19.4.1.3. Northern Africa
- 19.4.1.4. South Africa
- 19.4.1.5. Rest of Middle East and Africa
- 19.4.2. By Material Type
- 19.4.3. By Product Type
- 19.4.4. By Application
- 19.4.5. By End User
- 19.4.1. By Country
- 19.5. Market Attractiveness Analysis
- 19.5.1. By Country
- 19.5.2. By Material Type
- 19.5.3. By Product Type
- 19.5.4. By Application
- 19.5.5. By End User
- 19.6. Market Trends
- 19.7. Key Market Participants - Intensity Mapping
- 19.8. Drivers and Restraints - Impact Analysis
20. Country Wise Market Analysis 2024-2033
- 20.1. Introduction
- 20.1.1. Market Value Proportion Analysis, By Key Countries
- 20.1.2. Global Vs. Country Growth Comparison
- 20.2. U.S. Market Analysis
- 20.2.1. By Material Type
- 20.2.2. By Product Type
- 20.2.3. By Application
- 20.2.4. By End User
- 20.3. Canada Market Analysis
- 20.3.1. By Material Type
- 20.3.2. By Product Type
- 20.3.3. By Application
- 20.3.4. By End User
- 20.4. Mexico Market Analysis
- 20.4.1. By Material Type
- 20.4.2. By Product Type
- 20.4.3. By Application
- 20.4.4. By End User
- 20.5. Brazil Market Analysis
- 20.5.1. By Material Type
- 20.5.2. By Product Type
- 20.5.3. By Application
- 20.5.4. By End User
- 20.6. Germany Market Analysis
- 20.6.1. By Material Type
- 20.6.2. By Product Type
- 20.6.3. By Application
- 20.6.4. By End User
- 20.7. Italy Market Analysis
- 20.7.1. By Material Type
- 20.7.2. By Product Type
- 20.7.3. By Application
- 20.7.4. By End User
- 20.8. France Market Analysis
- 20.8.1. By Material Type
- 20.8.2. By Product Type
- 20.8.3. By Application
- 20.8.4. By End User
- 20.9. U.K. Market Analysis
- 20.9.1. By Material Type
- 20.9.2. By Product Type
- 20.9.3. By Application
- 20.9.4. By End User
- 20.10. Spain Market Analysis
- 20.10.1. By Material Type
- 20.10.2. By Product Type
- 20.10.3. By Application
- 20.10.4. By End User
- 20.11. BENELUX Market Analysis
- 20.11.1. By Material Type
- 20.11.2. By Product Type
- 20.11.3. By Application
- 20.11.4. By End User
- 20.12. Russia Market Analysis
- 20.12.1. By Material Type
- 20.12.2. By Product Type
- 20.12.3. By Application
- 20.12.4. By End User
- 20.13. China Market Analysis
- 20.13.1. By Material Type
- 20.13.2. By Product Type
- 20.13.3. By Application
- 20.13.4. By End User
- 20.14. Japan Market Analysis
- 20.14.1. By Material Type
- 20.14.2. By Product Type
- 20.14.3. By Application
- 20.14.4. By End User
- 20.15. S. Korea Market Analysis
- 20.15.1. By Material Type
- 20.15.2. By Product Type
- 20.15.3. By Application
- 20.15.4. By End User
- 20.16. ASEAN Market Analysis
- 20.16.1. By Material Type
- 20.16.2. By Product Type
- 20.16.3. By Application
- 20.16.4. By End User
- 20.17. Australia and New Zealand Market Analysis
- 20.17.1. By Material Type
- 20.17.2. By Product Type
- 20.17.3. By Application
- 20.17.4. By End User
- 20.18. GCC Countries Market Analysis
- 20.18.1. By Material Type
- 20.18.2. By Product Type
- 20.18.3. By Application
- 20.18.4. By End User
- 20.19. Turkey Market Analysis
- 20.19.1. By Material Type
- 20.19.2. By Product Type
- 20.19.3. By Application
- 20.19.4. By End User
- 20.20. Northern Africa Market Analysis
- 20.20.1. By Material Type
- 20.20.2. By Product Type
- 20.20.3. By Application
- 20.20.4. By End User
- 20.21. South Africa Market Analysis
- 20.21.1. By Material Type
- 20.21.2. By Product Type
- 20.21.3. By Application
- 20.21.4. By End User
21. Market Structure Analysis
- 21.1. Market Analysis by Tier of Companies (Rupture Disc)
- 21.2. Market Share Analysis of Top Players
- 21.3. Market Presence Analysis
22. Competition Analysis
- 22.1. Competition Dashboard
- 22.2. Competition Benchmarking
- 22.3. Competition Deep Dive
- 22.3.1. Emerson Electric Co
- 22.3.1.1. Overview
- 22.3.1.2. Product Portfolio
- 22.3.1.3. Profitability by Market Segments (Product/Channel/Region)
- 22.3.1.4. Sales Footprint
- 22.3.1.5. Strategy Overview
- 22.3.2. BS&B Safety Systems, L.L.C
- 22.3.2.1. Overview
- 22.3.2.2. Product Portfolio
- 22.3.2.3. Profitability by Market Segments (Product/Channel/Region)
- 22.3.2.4. Sales Footprint
- 22.3.2.5. Strategy Overview
- 22.3.3. Fike Corporation
- 22.3.3.1. Overview
- 22.3.3.2. Product Portfolio
- 22.3.3.3. Profitability by Market Segments (Product/Channel/Region)
- 22.3.3.4. Sales Footprint
- 22.3.3.5. Strategy Overview
- 22.3.4. Parker Hannifin Corp
- 22.3.4.1. Overview
- 22.3.4.2. Product Portfolio
- 22.3.4.3. Profitability by Market Segments (Product/Channel/Region)
- 22.3.4.4. Sales Footprint
- 22.3.4.5. Strategy Overview
- 22.3.5. Halma Plc
- 22.3.5.1. Overview
- 22.3.5.2. Product Portfolio
- 22.3.5.3. Profitability by Market Segments (Product/Channel/Region)
- 22.3.5.4. Sales Footprint
- 22.3.5.5. Strategy Overview
- 22.3.6. Graco Inc.
- 22.3.6.1. Overview
- 22.3.6.2. Product Portfolio
- 22.3.6.3. Profitability by Market Segments (Product/Channel/Region)
- 22.3.6.4. Sales Footprint
- 22.3.6.5. Strategy Overview
- 22.3.7. V-TEX Corp.
- 22.3.7.1. Overview
- 22.3.7.2. Product Portfolio
- 22.3.7.3. Profitability by Market Segments (Product/Channel/Region)
- 22.3.7.4. Sales Footprint
- 22.3.7.5. Strategy Overview
- 22.3.8. Continental Disc Corporation LLC
- 22.3.8.1. Overview
- 22.3.8.2. Product Portfolio
- 22.3.8.3. Profitability by Market Segments (Product/Channel/Region)
- 22.3.8.4. Sales Footprint
- 22.3.8.5. Strategy Overview
- 22.3.9. Mersen Group
- 22.3.9.1. Overview
- 22.3.9.2. Product Portfolio
- 22.3.9.3. Profitability by Market Segments (Product/Channel/Region)
- 22.3.9.4. Sales Footprint
- 22.3.9.5. Strategy Overview
- 22.3.10. WOLFF GROUP
- 22.3.10.1. Overview
- 22.3.10.2. Product Portfolio
- 22.3.10.3. Profitability by Market Segments (Product/Channel/Region)
- 22.3.10.4. Sales Footprint
- 22.3.10.5. Strategy Overview
- 22.3.11. BASCO
- 22.3.11.1. Overview
- 22.3.11.2. Product Portfolio
- 22.3.11.3. Profitability by Market Segments (Product/Channel/Region)
- 22.3.11.4. Sales Footprint
- 22.3.11.5. Strategy Overview
- 22.3.12. REMBE
- 22.3.12.1. Overview
- 22.3.12.2. Product Portfolio
- 22.3.12.3. Profitability by Market Segments (Product/Channel/Region)
- 22.3.12.4. Sales Footprint
- 22.3.12.5. Strategy Overview
- 22.3.13. Shanghai Huali Safety Devices Co., Ltd
- 22.3.13.1. Overview
- 22.3.13.2. Product Portfolio
- 22.3.13.3. Profitability by Market Segments (Product/Channel/Region)
- 22.3.13.4. Sales Footprint
- 22.3.13.5. Strategy Overview
- 22.3.14. Dalian Duta Technology Safety System Co Ltd
- 22.3.14.1. Overview
- 22.3.14.2. Product Portfolio
- 22.3.14.3. Profitability by Market Segments (Product/Channel/Region)
- 22.3.14.4. Sales Footprint
- 22.3.14.5. Strategy Overview
- 22.3.1. Emerson Electric Co

