|
|
市場調査レポート
商品コード
1469771
複雑な料金分析 - 顧客情報システムと時間帯別および複雑な料金体系の分析:世界市場の分析と予測 (2023~2032年)Complex Rate Analytics - Customer Information Systems and Time-of-Use and Complex Rate Analytics: Global Market Analysis and Forecasts, 2023-2032 |
||||||
|
|||||||
| 複雑な料金分析 - 顧客情報システムと時間帯別および複雑な料金体系の分析:世界市場の分析と予測 (2023~2032年) |
|
出版日: 2024年04月24日
発行: Guidehouse Research
ページ情報: 英文 40 Pages; 31 Tables, Charts & Figures
納期: 即納可能
|
全表示
- 概要
- 図表
- 目次
時間帯別料金設定は、それがベストプラクティスであるという認識が広まりつつあるため、従来より広まりつつあり、強力な促進要因となっています。米国を含む複数の国々では、高度計測インフラの利点を効果的に活用し、電力企業と顧客の双方に多面的な価値を提供する、より複雑な料金体系へのシフトが同時に進行しています。ピーク需要管理や分散型エネルギー資源 (DER) の最適化から、エネルギー価格の妥当性や顧客満足度に至るまで、新しい高度な料金体系は、公益事業者が今日と明日の課題に対処するための論理的なメカニズムを提供します。
既存の顧客ケアプロバイダーは、基本的な使用時間制 (TOU) やネットメータリング料金体系を請求・モデル化・管理する能力を強化していますが、複雑な料金設計やシャドー請求・自動請求に従来型システムで対応する能力と、超パーソナライズされた料金の指導・教育能力には、大きなギャップが残っています。TOUの推奨、DERプログラムの登録、課金サポートに採用されている複雑な料金エンジンと高度な集計方法は、エネルギー分析のこの新しい分野を拡大することを目的とした新しいソフトウェア機能を垣間見せてくれます。
当レポートでは、世界のエネルギー業界向けIT・OTソフトウェアおよびサービス市場について分析し、世界各地 (北米、欧州、アジア太平洋、ラテンアメリカ、中東・アフリカ) のエネルギー向けIT・OT・データ分析ソリューションの市場促進・抑制要因について調査しております。また、全体的な市場規模の動向見通し (2023~2032年) や、地域別・技術別の詳細動向などを予測しております。
目次
第1章 エグゼクティブサマリー
第2章 市場動向
- イントロダクション
- 市場促進要因
- 複雑な料金体系の急増
- 旧来のCIS (顧客情報システム) の限界
- ピーク需要管理
- 顧客満足度
- エネルギーの手頃な料金
- 設計の複雑さを評価する
- グリッドインタラクティブDER
- コンタクトセンターの非効率性
- 顧客中心の規制の進化
- 市場の障壁
- 教育と意識の欠如
- 規制構造
- クラウドセキュリティ
- ユーティリティ制御の欠如
第3章 産業バリューチェーン
- 競合情勢
- 複雑な料金体系の分析
- 企業向けCIS
- HEM (家庭用エネルギー管理)
- ビジネスモデルの進化
- エンドツーエンドの料金エンゲージメント
- CISの機能強化
- ソフトウェアの価格モデル
- クラウドとSaaS
第4章 市場予測
- 予測手法
- 市場予測
- 北米
- 欧州
- アジア太平洋
- ラテンアメリカ
- 中東・アフリカ
第5章 結論・提言
第6章 頭字語と略語一覧
第7章 目次
第8章 図表
第9章 調査範囲
第10章 情報源、調査手法、注釈
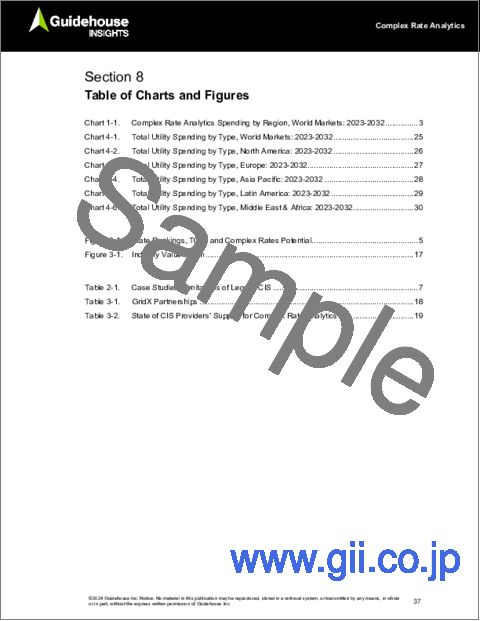
List of Tables
- Complex Rate Analytics Spending by Region, World Markets: 2023-2032
- Total Utility Spending by Category, World Markets: 2023-2032
- Complex Rate Analytics Spending by Application, World Markets: 2023-2032
- Enterprise IT Spending by System, World Markets: 2023-2032
- Total Utility Spending by Category, North America: 2023-2032
- Complex Rate Analytics Spending by Application, North America: 2023-2032
- Enterprise IT Spending by System, North America: 2023-2032
- Total Utility Spending by Category, Europe: 2023-2032
- Complex Rate Analytics Spending by Application, Europe: 2023-2032
- Enterprise IT Spending by System, Europe: 2023-2032
- Total Utility Spending by Category, Asia Pacific: 2023-2032
- Complex Rate Analytics Spending by Application, Asia Pacific: 2023-2032
- Enterprise IT Spending by System, Asia Pacific: 2023-2032
- Total Utility Spending by Category, Latin America: 2023-2032
- Complex Rate Analytics Spending by Application, Latin America: 2023-2032
- Enterprise IT Spending by System, Latin America: 2023-2032
- Total Utility Spending by Category, Middle East & Africa: 2023-2032
- Complex Rate Analytics Spending by Application, Middle East & Africa: 2023-2032
- Enterprise IT Spending by System, Middle East & Africa: 2023-2032
Case Studies: Limitations of Legacy CIS
GridX Partnerships
State of CIS Providers' Support for Complex Rate Analytics
List of Figures
- Complex Rate Analytics Spending by Region, World Markets: 2023-2032
- Total Utility Spending by Category, World Markets: 2023-2032
- Total Utility Spending by Category, North America: 2023-2032
- Total Utility Spending by Category, Europe: 2023-2032
- Total Utility Spending by Category, Asia Pacific: 2023-2032
- Total Utility Spending by Category, Latin America: 2023-2032
- Total Utility Spending by Category, Middle East & Africa: 2023-2032
State Rankings, TOU, and Complex Rates Potential
Industry Value Chain
Time-varying pricing is becoming more widespread and a powerful driver due to the growing perception that it is a best practice. Multiple countries, including the US, are seeing a simultaneous shift toward more complex rate structures that effectively leverage the benefits of advanced metering infrastructure to deliver multi-pronged value streams for utilities and customers alike. From peak demand management and distributed energy resource (DER) optimization to energy affordability and customer satisfaction, new and advanced rate structures offer a logical mechanism for utilities to address the challenges of today and tomorrow.
While established customer care providers have enhanced their abilities to bill, model, and manage basic time-of-use (TOU) and net metering rate structures, significant gaps remain in legacy systems' ability to support complex rate design, shadow billing, automated billing, and hyper-personalized rate coaching and education. Complex rate engines and advanced disaggregation methods employed for TOU recommendations, DER program enrollment, and billing support offer a glimpse into new software capabilities that aim to scale this emerging field of energy analytics.
This Guidehouse Insights report examines the global marketplace for energy IT and OT software and services. It outlines the drivers and barriers behind the growing market for energy IT, OT, and data analytics solutions for five global markets: North America, Europe, Asia Pacific, Latin America, and Middle East & Africa. It provides details on market sizing for the forecast period from 2023 through 2032, segmented by global region and technology segment.
Table of Contents
1. Executive Summary
- 1.1 Introduction
- 1.2 Report Scope
- 1.3 Global Forecast
2. Market Trends
- 2.1 Introduction
- 2.2 Market Drivers
- 2.2.1 Proliferation of Complex Rates
- 2.2.2 Legacy CIS Limitations
- 2.2.3 Peak Demand Management
- 2.2.4 Customer Satisfaction
- 2.2.5 Energy Affordability
- 2.2.6 Rate Design Complexities
- 2.2.7 Grid-Interactive DER
- 2.2.8 Contact Center Inefficiencies
- 2.2.9 Customer-Centric Regulatory Evolutions
- 2.3 Market Barriers
- 2.3.1 Lack of Education and Awareness
- 2.3.2 Regulatory Structures
- 2.3.3 Cloud Security
- 2.3.4 Lack of Utility Control
3. Industry Value Chain
- 3.1 Competitive Landscape
- 3.1.1 Complex Rate and Tariff Analytics
- 3.1.2 Enterprise CIS
- 3.1.3 HEM
- 3.2 Business Model Evolution
- 3.2.1 End-to-End Rates Engagement
- 3.2.2 CIS Enhancements
- 3.2.3 Software Pricing Models
- 3.2.4 Cloud and SaaS
4. Market Forecasts
- 4.1 Forecast Methodology
- 4.2 Market Forecast
- 4.2.1 North America
- 4.2.2 Europe
- 4.2.3 Asia Pacific
- 4.2.4 Latin America
- 4.2.5 Middle East & Africa
5. Conclusions and Recommendations
- 5.1 Conclusions and Recommendations
- 5.1.1 Three Key Takeaways
- 5.1.2 Energy Analytics Providers
- 5.1.3 Energy Companies


