|
|
市場調査レポート
商品コード
1422060
EaaS (Energy as a Service):世界市場の分析と予測 (2023~2033年)Energy as a Service: Global Market Analysis and Forecast, 2023-2033 |
||||||
|
|||||||
|
|||||||

| EaaS (Energy as a Service):世界市場の分析と予測 (2023~2033年) |
|
出版日: 2024年02月07日
発行: Guidehouse Research
ページ情報: 英文 34 Pages; 24 Tables, Charts & Figures
納期: 即納可能
|

全表示
- 概要
- 図表
- 目次
進化を続けるエネルギーソリューションの中で、EaaS (Energy as a Service:サービスとしてのエネルギー) の需要は過去5年間で大きく伸びています。今日の競争市場で成功するために、EaaSベンダーは製品ポートフォリオの多様化を余儀なくされています。この多様化には、単に製品ラインナップを増やすだけでなく、戦略的提携やパートナーシップを結ぶことも含まれます。戦略的提携やパートナーシップを結ぶことで、ベンダーは最新のプロセスを常に把握し、顧客にシームレスな設置とオーダーメイドのソリューションを提供できるようになります。さらに、EaaSベンダーは技術革新と、より柔軟で持続可能なエネルギーソリューションに対する需要の高まりによって、成長を遂げています。世界中の組織が予測不能な送電網の状況や不安定なエネルギー価格によってもたらされるリスクを軽減する戦略を検討しているため、EaaSにとって回復力の強化は引き続き極めて重要な促進要因となっています。さらに、厳しい法改正や利害関係者からの圧力の高まりが、組織の意思決定に大きな影響を与えています。EaaSは、企業が持続可能性目標を達成し、環境に配慮するための信頼できるソリューションとして浮上しています。最後に、インフレと金利が高騰する中、EaaSは、設備投資 (CAPEX) の維持に熱心な組織にとって魅力的な選択肢と考えられています。
当レポートでは、世界のEaaS市場について包括的に分析し、近年の市場動向を左右した動向や、促進・抑制要因などを調査しております。さらに、11年間の市場動向を予測し、世界5地域 (北米、欧州、アジア太平洋、ラテンアメリカ、中東・アフリカ)、3つの技術分野 (ビル効率化、オンサイトエネルギー供給、エネルギー柔軟性ソリューション)、2つの種類の顧客 (商業施設、公共施設) におけるEaaS市場の将来的な動向に関する洞察を提供しています。
目次
第1章 エグゼクティブサマリー
第2章 市場の問題
- EaaS (Energy as a Service) の定義
- 市場動向
- 不安定なエネルギー市場
- マルチサイトEaaS
- 中小規模ビル向けEaaS
- EaaSのようなモデルを提供するユーティリティ
- EaaSベンダーとコンサルタント企業間のパートナーシップ
- カリフォルニアの気候情報開示
- SECの気候情報開示提案
- 企業の持続可能性報告指令
- 市場促進要因
- 市場抑制要因
第3章 業界のバリューチェーン
- EaaSのバリューチェーン
- 競合情勢
- 企業合併・買収 (M&A) 活動
- EaaSモデルの進化
- EaaSの現状
第4章 データの前提条件
- 予測範囲
- 予測のセグメント
- 予測手法
- 一時金収益
- 経常収益
第5章 市場予測
- 世界市場の概要
- 北米
- 欧州
- アジア太平洋
- ラテンアメリカ
- 中東・アフリカ
第6章 結論・提言
第7章 頭字語・略語の一覧
第8章 目次
第9章 図表
第10章 分析範囲、情報源、分析手法、注記
List of Tables
- EaaS Revenue by Region, World Markets: 2023-2033
- EaaS Revenue by Technology, World Markets: 2023-2033
- EaaS Revenue by Client Type, World Markets: 2023-2033
- EaaS Revenue by Technology, North America: 2023-2033
- EaaS Revenue by Client Type, North America: 2023-2033
- EaaS Revenue by Technology, Europe: 2023-2033
- EaaS Revenue by Client Type, Europe: 2023-2033
- EaaS Revenue by Technology, Asia Pacific: 2023-2033
- EaaS Revenue by Client Type, Asia Pacific: 2023-2033
- EaaS Revenue by Technology, Latin America: 2023-2033
- EaaS Revenue by Client Type, Latin America: 2023-2033
- EaaS Revenue by Technology, Middle East & Africa: 2023-2033
- EaaS Revenue by Client Type, Middle East & Africa: 2023-2033
List of Figures
- EaaS Revenue by Region, World Markets: 2023-2033
- EaaS Revenue by Technology, World Markets: 2023-2033
- EaaS Revenue by Client Type, World Markets: 2023-2033
- EaaS Revenue by Technology, North America: 2023-2033
- EaaS Revenue by Technology, Europe: 2023-2033
- EaaS Revenue by Technology, Asia Pacific: 2023-2033
- EaaS Revenue by Technology, Latin America: 2023-2033
- EaaS Revenue by Technology, Middle East & Africa: 2023-2033
Features of EaaS
EaaS Contracting Process
Evolution of Energy Service Solution Offerings
In the ever-evolving landscape of energy solutions, energy as a service (EaaS) has experienced substantial growth in demand over the past 5 years. To thrive in today's competitive market, EaaS vendors have been compelled to diversify their product portfolios. This diversification involves not just expanding their offerings but also forging strategic alliances and partnerships that can allow them to stay abreast of the latest processes to deliver seamless installations and tailor-made solutions for their clients. In addition, EaaS vendors have witnessed growth propelled by technological innovations and rising demand for more flexible, sustainable energy solutions. Enhanced resilience has remained a pivotal driver for EaaS as organizations globally look at strategies to mitigate the risks posed by unpredictable grid conditions and volatile energy prices. Furthermore, stringent legislative changes and mounting stakeholder pressures have significantly influenced organizational decisions. EaaS has emerged as a reliable solution for companies to meet their sustainability targets and bolster their eco-friendliness. Lastly, in times of heightened inflation and interest rates, EaaS is seen as a compelling alternative for organizations keen on maintaining their CAPEX.
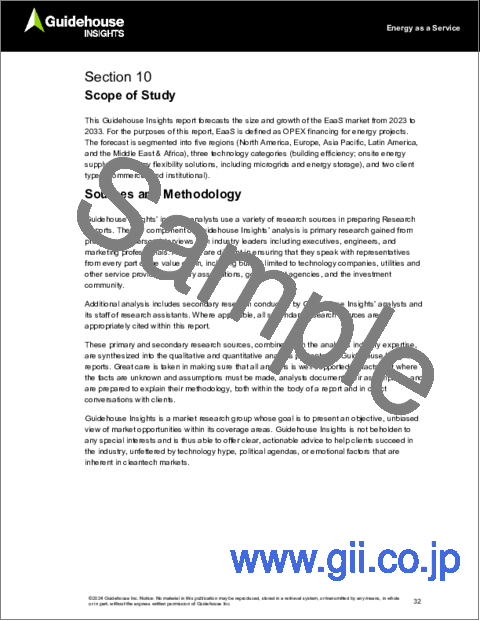
This Guidehouse Insights report aims to provide a comprehensive analysis of the EaaS market, covering the trends, drivers, and barriers that have shaped its evolution in recent years. Additionally, it presents an 11-year forecast, offering insights into the future trajectory of the EaaS market across five global regions (North America, Europe, Asia Pacific, Latin America, and the Middle East & Africa), three technology segments (building efficiency, onsite energy supply, and energy flexibility solutions), and two client types (commercial and institutional).
Table of Contents
1. Executive Summary
- 1.1 Market Overview
- 1.2 Market Drivers
- 1.3 Market Barriers
- 1.4 Market Forecast
2. Market Issues
- 2.1 Energy as a Service Definition
- 2.2 Market Trends
- 2.2.1 Unstable Energy Markets
- 2.2.2 Multisite EaaS
- 2.2.3 EaaS for Small and Medium Sized Buildings
- 2.2.4 Utilities Offering EaaS-Like Models
- 2.2.5 Partnerships between EaaS Vendors and Consultancies
- 2.2.6 California Climate Disclosure
- 2.2.7 SEC Climate Disclosure Proposal
- 2.2.8 Corporate Sustainability Reporting Directive
- 2.3 Market Drivers
- 2.4 Market Barriers
3. Industry Value Chain
- 3.1 EaaS Value Chain
- 3.2 Competitive Landscape
- 3.2.1 Merger and Acquisition Activities
- 3.2.2 EaaS Model Evolution
- 3.2.3 Current State of EaaS
4. Data Assumptions
- 4.1 Forecast Scope
- 4.2 Forecast Segments
- 4.3 Forecast Methodology
- 4.3.1 Upfront Revenue
- 4.3.2 Recurring Revenue
5. Market Forecasts
- 5.1 Global Overview
- 5.2 North America
- 5.3 Europe
- 5.4 Asia Pacific
- 5.5 Latin America
- 5.6 Middle East & Africa
6. Conclusions and Recommendations
- 6.1 Recommendations

