|
|
市場調査レポート
商品コード
1556017
浮体式太陽光発電市場:製品別、システム別、用途別、地域別、機会、予測、2017年~2031年Floating photovoltaics Market Assessment, By Product, By System, By Application, By Region, Opportunities and Forecast, 2017-2031F |
||||||
|
|||||||
カスタマイズ可能
|
|||||||

| 浮体式太陽光発電市場:製品別、システム別、用途別、地域別、機会、予測、2017年~2031年 |
|
出版日: 2024年09月17日
発行: Markets & Data
ページ情報: 英文 232 Pages
納期: 3~5営業日
|

全表示
- 概要
- 図表
- 目次
世界の浮体式太陽光発電の市場規模は、予測期間の2024年~2031年に11.80%のCAGRで拡大し、2023年の22億4,000万米ドルから2031年には54億6,000万米ドルに成長すると予測されています。同市場は近年著しい成長を遂げており、予測期間中も堅調な拡大ペースを維持するとみられます。
浮体式太陽光発電(FPV)システムには、土地の使用を最小限に抑え、ソーラーパネルへの水の冷却効果によるエネルギー効率の向上、貯水池の水蒸発のさらなる削減など、いくつかの利点があります。これらの利点は、今後数年間の浮体式太陽光発電市場の成長を促進すると思われます。さらに、浮体式太陽光発電(FPV)システムの用途は、水域の多い新興国で人気を集めています。
浮体式太陽光発電システムは、再生可能エネルギー発電の新たな応用であり、より具体的には、利用可能な土地が限られている地域での応用です。水面上の太陽光発電所の開拓は、太陽エネルギーの可能性を最大限に利用する国々にとって貴重な追加となる可能性があり、予測数年の浮体式太陽光発電(FPV)市場シェアを押し上げます。
水面に浮かぶ太陽光発電パネルは、陸上の太陽光発電所と比較していくつかの潜在的な利点があります。FPVシステムは、貯水池、湖、ダムなど、他の方法では遊休のままになってしまう大規模な水域にとって理想的なソリューションです。
FPVシステムは、従来の太陽光発電所の拡張をしばしば制限する土地の不足問題を緩和します。浮体式太陽光発電(FPV)システムは、従来のソーラーパネルに代わるソリューションであり、特に人口密集地や農業地域などの重要な土地資源をめぐる競合を増やすことなく、大幅に大規模なパネル設置が可能であるため、予測期間における浮体式太陽光発電FPV市場シェアを牽引しています。
当レポートでは、世界の浮体式太陽光発電市場について調査し、市場の概要とともに、製品別、システム別、用途別、地域別動向、および市場に参入する企業のプロファイルなどを提供しています。
目次
第1章 プロジェクトの範囲と定義
第2章 調査手法
第3章 エグゼクティブサマリー
第4章 世界の浮体式太陽光発電市場の見通し、2017年~2031年
- 市場規模の分析と予測
- 市場シェア分析と予測
- 市場マップ分析、2023年
- 製品別
- システム別
- 用途別
- 地域別
第5章 北米の浮体式太陽光発電(FPV)市場の見通し、2017年~2031年
第6章 欧州の浮体式太陽光発電(FPV)市場の見通し、2017年~2031年
第7章 アジア太平洋の浮体式太陽光発電(FPV)市場の見通し、2017年~2031年
第8章 南米の浮体式太陽光発電(FPV)市場の見通し、2017年~2031年
第9章 中東・アフリカの浮体式太陽光発電(FPV)市場の見通し、2017年~2031年
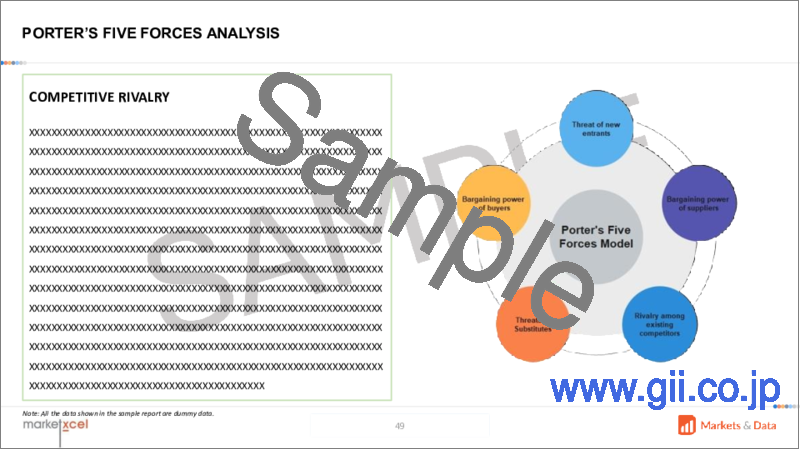
第10章 ポーターのファイブフォース分析
第11章 PESTLE分析
第12章 市場力学
第13章 市場の動向と発展
第14章 ケーススタディ
第15章 競合情勢
- 市場リーダートップ5の競合マトリックス
- 参入企業トップ5のSWOT分析
- 市場の主要参入企業トップ10の情勢
- SolarisFloat
- Profloating B.V.
- ISIGENERE S.L.
- Oceans of Energy
- Swimsol GmbH
- OCEAN SUN AS
- SCOTRA CO, LTD.
- Xiamen Mibet New Energy Co., Ltd,
- Ciel et Terre International
- ABL Group
- Abu Dhabi Future Energy Company PJSC's
第16章 戦略的提言
第17章 お問い合わせと免責事項
List of Tables
- Table 1. Pricing Analysis of Products from Key Players
- Table 2. Competition Matrix of Top 5 Market Leaders
- Table 3. Mergers & Acquisitions/ Joint Ventures (If Applicable)
- Table 4. About Us - Regions and Countries Where We Have Executed Client Projects
List of Figures
- Figure 1. Global Floating photovoltaics Market, By Value, in USD Billion, 2017-2031F
- Figure 2. Global Floating photovoltaics Market, By Volume, in Gigawatt (GW), 2017-2031F
- Figure 3. Global Floating photovoltaics Market Share (%), By Product, 2017-2031F
- Figure 4. Global Floating photovoltaics Market Share (%), By System, 2017-2031F
- Figure 5. Global Floating photovoltaics Market Share (%), By Application, 2017-2031F
- Figure 6. Global Floating photovoltaics Market Share (%), By Region, 2017-2031F
- Figure 7. North America Floating photovoltaics Market, By Value, in USD Billion, 2017-2031F
- Figure 8. North America Floating photovoltaics Market, By Volume, in Gigawatt (GW), 2017-2031F
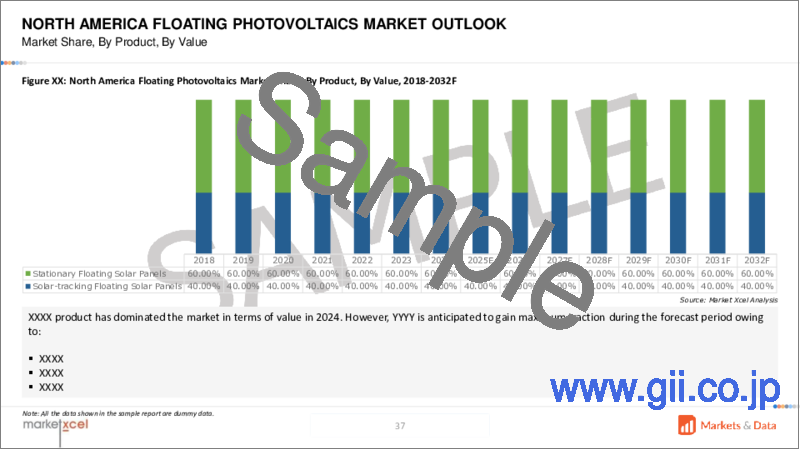
- Figure 9. North America Floating photovoltaics Market Share (%), By Product, 2017-2031F
- Figure 10. North America Floating photovoltaics Market Share (%), By System, 2017-2031F
- Figure 11. North America Floating photovoltaics Market Share (%), By Application, 2017-2031F
- Figure 12. North America Floating photovoltaics Market Share (%), By Country, 2017-2031F
- Figure 13. United States Floating photovoltaics Market, By Value, in USD Billion, 2017-2031F
- Figure 14. United States Floating photovoltaics Market, By Volume, in Gigawatt (GW), 2017-2031F
- Figure 15. United States Floating photovoltaics Market Share (%), By Product, 2017-2031F
- Figure 16. United States Floating photovoltaics Market Share (%), By System, 2017-2031F
- Figure 17. United States Floating photovoltaics Market Share (%), By Application, 2017-2031F
- Figure 18. Canada Floating photovoltaics Market, By Value, in USD Billion, 2017-2031F
- Figure 19. Canada Floating photovoltaics Market, By Volume, in Gigawatt (GW), 2017-2031F
- Figure 20. Canada Floating photovoltaics Market Share (%), By Product, 2017-2031F
- Figure 21. Canada Floating photovoltaics Market Share (%), By System, 2017-2031F
- Figure 22. Canada Floating photovoltaics Market Share (%), By Application, 2017-2031F
- Figure 23. Mexico Floating photovoltaics Market, By Value, in USD Billion, 2017-2031F
- Figure 24. Mexico Floating photovoltaics Market, By Volume, in Gigawatt (GW), 2017-2031F
- Figure 25. Mexico Floating photovoltaics Market Share (%), By Product, 2017-2031F
- Figure 26. Mexico Floating photovoltaics Market Share (%), By System, 2017-2031F
- Figure 27. Mexico Floating photovoltaics Market Share (%), By Application, 2017-2031F
- Figure 28. Europe Floating photovoltaics Market, By Value, in USD Billion, 2017-2031F
- Figure 29. Europe Floating photovoltaics Market, By Volume, in Gigawatt (GW), 2017-2031F
- Figure 30. Europe Floating photovoltaics Market Share (%), By Product, 2017-2031F
- Figure 31. Europe Floating photovoltaics Market Share (%), By System, 2017-2031F
- Figure 32. Europe Floating photovoltaics Market Share (%), By Application, 2017-2031F
- Figure 33. Europe Floating photovoltaics Market Share (%), By Country, 2017-2031F
- Figure 34. Germany Floating photovoltaics Market, By Value, in USD Billion, 2017-2031F
- Figure 35. Germany Floating photovoltaics Market, By Volume, in Gigawatt (GW), 2017-2031F
- Figure 36. Germany Floating photovoltaics Market Share (%), By Product, 2017-2031F
- Figure 37. Germany Floating photovoltaics Market Share (%), By System, 2017-2031F
- Figure 38. Germany Floating photovoltaics Market Share (%), By Application, 2017-2031F
- Figure 39. France Floating photovoltaics Market, By Value, in USD Billion, 2017-2031F
- Figure 40. France Floating photovoltaics Market, By Volume, in Gigawatt (GW), 2017-2031F
- Figure 41. France Floating photovoltaics Market Share (%), By Product, 2017-2031F
- Figure 42. France Floating photovoltaics Market Share (%), By System, 2017-2031F
- Figure 43. France Floating photovoltaics Market Share (%), By Application, 2017-2031F
- Figure 44. Italy Floating photovoltaics Market, By Value, in USD Billion, 2017-2031F
- Figure 45. Italy Floating photovoltaics Market, By Volume, in Gigawatt (GW), 2017-2031F
- Figure 46. Italy Floating photovoltaics Market Share (%), By Product, 2017-2031F
- Figure 47. Italy Floating photovoltaics Market Share (%), By System, 2017-2031F
- Figure 48. Italy Floating photovoltaics Market Share (%), By Application, 2017-2031F
- Figure 49. United Kingdom Floating photovoltaics Market, By Value, in USD Billion, 2017-2031F
- Figure 50. United Kingdom Floating photovoltaics Market, By Volume, in Gigawatt (GW), 2017-2031F
- Figure 51. United Kingdom Floating photovoltaics Market Share (%), By Product, 2017-2031F
- Figure 52. United Kingdom Floating photovoltaics Market Share (%), By System, 2017-2031F
- Figure 53. United Kingdom Floating photovoltaics Market Share (%), By Application, 2017-2031F
- Figure 54. Russia Floating photovoltaics Market, By Value, in USD Billion, 2017-2031F
- Figure 55. Russia Floating photovoltaics Market, By Volume, in Gigawatt (GW), 2017-2031F
- Figure 56. Russia Floating photovoltaics Market Share (%), By Product, 2017-2031F
- Figure 57. Russia Floating photovoltaics Market Share (%), By System, 2017-2031F
- Figure 58. Russia Floating photovoltaics Market Share (%), By Application, 2017-2031F
- Figure 59. Netherlands Floating photovoltaics Market, By Value, in USD Billion, 2017-2031F
- Figure 60. Netherlands Floating photovoltaics Market, By Volume, in Gigawatt (GW), 2017-2031F
- Figure 61. Netherlands Floating photovoltaics Market Share (%), By Product, 2017-2031F
- Figure 62. Netherlands Floating photovoltaics Market Share (%), By System, 2017-2031F
- Figure 63. Netherlands Floating photovoltaics Market Share (%), By Application, 2017-2031F
- Figure 64. Spain Floating photovoltaics Market, By Value, in USD Billion, 2017-2031F
- Figure 65. Spain Floating photovoltaics Market, By Volume, in Gigawatt (GW), 2017-2031F
- Figure 66. Spain Floating photovoltaics Market Share (%), By Product, 2017-2031F
- Figure 67. Spain Floating photovoltaics Market Share (%), By System, 2017-2031F
- Figure 68. Spain Floating photovoltaics Market Share (%), By Application, 2017-2031F
- Figure 69. Turkey Floating photovoltaics Market, By Value, in USD Billion, 2017-2031F
- Figure 70. Turkey Floating photovoltaics Market, By Volume, in Gigawatt (GW), 2017-2031F
- Figure 71. Turkey Floating photovoltaics Market Share (%), By Product, 2017-2031F
- Figure 72. Turkey Floating photovoltaics Market Share (%), By System, 2017-2031F
- Figure 73. Turkey Floating photovoltaics Market Share (%), By Application, 2017-2031F
- Figure 74. Poland Floating photovoltaics Market, By Value, in USD Billion, 2017-2031F
- Figure 75. Poland Floating photovoltaics Market, By Volume, in Gigawatt (GW), 2017-2031F
- Figure 76. Poland Floating photovoltaics Market Share (%), By Product, 2017-2031F
- Figure 77. Poland Floating photovoltaics Market Share (%), By System, 2017-2031F
- Figure 78. Poland Floating photovoltaics Market Share (%), By Application, 2017-2031F
- Figure 79. South America Floating photovoltaics Market, By Value, in USD Billion, 2017-2031F
- Figure 80. South America Floating photovoltaics Market, By Volume, in Gigawatt (GW), 2017-2031F
- Figure 81. South America Floating photovoltaics Market Share (%), By Product, 2017-2031F
- Figure 82. South America Floating photovoltaics Market Share (%), By System, 2017-2031F
- Figure 83. South America Floating photovoltaics Market Share (%), By Application, 2017-2031F
- Figure 84. South America Floating photovoltaics Market Share (%), By Country, 2017-2031F
- Figure 85. Brazil Floating photovoltaics Market, By Value, in USD Billion, 2017-2031F
- Figure 86. Brazil Floating photovoltaics Market, By Volume, in Gigawatt (GW), 2017-2031F
- Figure 87. Brazil Floating photovoltaics Market Share (%), By Product, 2017-2031F
- Figure 88. Brazil Floating photovoltaics Market Share (%), By System, 2017-2031F
- Figure 89. Brazil Floating photovoltaics Market Share (%), By Application, 2017-2031F
- Figure 90. Argentina Floating photovoltaics Market, By Value, in USD Billion, 2017-2031F
- Figure 91. Argentina Floating photovoltaics Market, By Volume, in Gigawatt (GW), 2017-2031F
- Figure 92. Argentina Floating photovoltaics Market Share (%), By Product, 2017-2031F
- Figure 93. Argentina Floating photovoltaics Market Share (%), By System, 2017-2031F
- Figure 94. Argentina Floating photovoltaics Market Share (%), By Application, 2017-2031F
- Figure 95. Asia-Pacific Floating photovoltaics Market, By Value, in USD Billion, 2017-2031F
- Figure 96. Asia-Pacific Floating photovoltaics Market, By Volume, in Gigawatt (GW), 2017-2031F
- Figure 97. Asia-Pacific Floating photovoltaics Market Share (%), By Product, 2017-2031F
- Figure 98. Asia-Pacific Floating photovoltaics Market Share (%), By System, 2017-2031F
- Figure 99. Asia-Pacific Floating photovoltaics Market Share (%), By Application, 2017-2031F
- Figure 100. Asia-Pacific Floating photovoltaics Market Share (%), By Country, 2017-2031F
- Figure 101. India Floating photovoltaics Market, By Value, in USD Billion, 2017-2031F
- Figure 102. India Floating photovoltaics Market, By Volume, in Gigawatt (GW), 2017-2031F
- Figure 103. India Floating photovoltaics Market Share (%), By Product, 2017-2031F
- Figure 104. India Floating photovoltaics Market Share (%), By System, 2017-2031F
- Figure 105. India Floating photovoltaics Market Share (%), By Application, 2017-2031F
- Figure 106. China Floating photovoltaics Market, By Value, in USD Billion, 2017-2031F
- Figure 107. China Floating photovoltaics Market, By Volume, in Gigawatt (GW), 2017-2031F
- Figure 108. China Floating photovoltaics Market Share (%), By Product, 2017-2031F
- Figure 109. China Floating photovoltaics Market Share (%), By System, 2017-2031F
- Figure 110. China Floating photovoltaics Market Share (%), By Application, 2017-2031F
- Figure 111. Japan Floating photovoltaics Market, By Value, in USD Billion, 2017-2031F
- Figure 112. Japan Floating photovoltaics Market, By Volume, in Gigawatt (GW), 2017-2031F
- Figure 113. Japan Floating photovoltaics Market Share (%), By Product, 2017-2031F
- Figure 114. Japan Floating photovoltaics Market Share (%), By System, 2017-2031F
- Figure 115. Japan Floating photovoltaics Market Share (%), By Application, 2017-2031F
- Figure 116. Australia Floating photovoltaics Market, By Value, in USD Billion, 2017-2031F
- Figure 117. Australia Floating photovoltaics Market, By Volume, in Gigawatt (GW), 2017-2031F
- Figure 118. Australia Floating photovoltaics Market Share (%), By Product, 2017-2031F
- Figure 119. Australia Floating photovoltaics Market Share (%), By System, 2017-2031F
- Figure 120. Australia Floating photovoltaics Market Share (%), By Application, 2017-2031F
- Figure 121. Vietnam Floating photovoltaics Market, By Value, in USD Billion, 2017-2031F
- Figure 122. Vietnam Floating photovoltaics Market, By Volume, in Gigawatt (GW), 2017-2031F
- Figure 123. Vietnam Floating photovoltaics Market Share (%), By Product, 2017-2031F
- Figure 124. Vietnam Floating photovoltaics Market Share (%), By System, 2017-2031F
- Figure 125. Vietnam Floating photovoltaics Market Share (%), By Application, 2017-2031F
- Figure 126. South Korea Floating photovoltaics Market, By Value, in USD Billion, 2017-2031F
- Figure 127. South Korea Floating photovoltaics Market, By Volume, in Gigawatt (GW), 2017-2031F
- Figure 128. South Korea Floating photovoltaics Market Share (%), By Product, 2017-2031F
- Figure 129. South Korea Floating photovoltaics Market Share (%), By System, 2017-2031F
- Figure 130. South Korea Floating photovoltaics Market Share (%), By Application, 2017-2031F
- Figure 131. Indonesia Floating photovoltaics Market, By Value, in USD Billion, 2017-2031F
- Figure 132. Indonesia Floating photovoltaics Market, By Volume, in Gigawatt (GW), 2017-2031F
- Figure 133. Indonesia Floating photovoltaics Market Share (%), By Product, 2017-2031F
- Figure 134. Indonesia Floating photovoltaics Market Share (%), By System, 2017-2031F
- Figure 135. Indonesia Floating photovoltaics Market Share (%), By Application, 2017-2031F
- Figure 136. Philippines Floating photovoltaics Market, By Value, in USD Billion, 2017-2031F
- Figure 137. Philippines Floating photovoltaics Market, By Volume, in Gigawatt (GW), 2017-2031F
- Figure 138. Philippines Floating photovoltaics Market Share (%), By Product, 2017-2031F
- Figure 139. Philippines Floating photovoltaics Market Share (%), By System, 2017-2031F
- Figure 140. Philippines Floating photovoltaics Market Share (%), By Application, 2017-2031F
- Figure 141. Middle East & Africa Floating photovoltaics Market, By Value, in USD Billion, 2017-2031F
- Figure 142. Middle East & Africa Floating photovoltaics Market, By Volume, in Gigawatt (GW), 2017-2031F
- Figure 143. Middle East & Africa Floating photovoltaics Market Share (%), By Product, 2017-2031F
- Figure 144. Middle East & Africa Floating photovoltaics Market Share (%), By System, 2017-2031F
- Figure 145. Middle East & Africa Floating photovoltaics Market Share (%), By Application, 2017-2031F
- Figure 146. Middle East & Africa Floating photovoltaics Market Share (%), By Country, 2017-2031F
- Figure 147. Saudi Arabia Floating photovoltaics Market, By Value, in USD Billion, 2017-2031F
- Figure 148. Saudi Arabia Floating photovoltaics Market, By Volume, in Gigawatt (GW), 2017-2031F
- Figure 149. Saudi Arabia Floating photovoltaics Market Share (%), By Product, 2017-2031F
- Figure 150. Saudi Arabia Floating photovoltaics Market Share (%), By System, 2017-2031F
- Figure 151. Saudi Arabia Floating photovoltaics Market Share (%), By Application, 2017-2031F
- Figure 152. UAE Floating photovoltaics Market, By Value, in USD Billion, 2017-2031F
- Figure 153. UAE Floating photovoltaics Market, By Volume, in Gigawatt (GW), 2017-2031F
- Figure 154. UAE Floating photovoltaics Market Share (%), By Product, 2017-2031F
- Figure 155. UAE Floating photovoltaics Market Share (%), By System, 2017-2031F
- Figure 156. UAE Floating photovoltaics Market Share (%), By Application, 2017-2031F
- Figure 157. South Africa Floating photovoltaics Market, By Value, in USD Billion, 2017-2031F
- Figure 158. South Africa Floating photovoltaics Market, By Volume, in Gigawatt (GW), 2017-2031F
- Figure 159. South Africa Floating photovoltaics Market Share (%), By Product, 2017-2031F
- Figure 160. South Africa Floating photovoltaics Market Share (%), By System, 2017-2031F
- Figure 161. South Africa Floating photovoltaics Market Share (%), By Application, 2017-2031F
- Figure 162. By Product Map-Market Size (USD Billion) & Growth Rate (%), 2023
- Figure 163. By System Map-Market Size (USD Billion) & Growth Rate (%), 2023
- Figure 164. By Application Map-Market Size (USD Billion) & Growth Rate (%), 2023
- Figure 165. By Region Map-Market Size (USD Billion) & Growth Rate (%), 2023
Global floating photovoltaics market is projected to witness a CAGR of 11.80% during the forecast period 2024-2031, growing from USD 2.24 billion in 2023 to USD 5.46 billion in 2031. The market has experienced significant growth in recent years and is expected to maintain a strong pace of expansion in the forecast period.
There are several advantages associated with floating photovoltaic (FPV) systems, such as minimal land use, increased energy efficiency from the cooling effect of water on solar panels, and a further reduction in water evaporation of reservoirs. These benefits will drive the floating photovoltaics market growth in the coming years. Further, applications of floating photovoltaics (FPV) systems are gaining popularity in emerging countries that hold a greater number of water bodies.
Floating photovoltaic systems entail a new application of renewable energy generation, more specifically in areas with limited availability of land. The development of solar power plants on a water surface may be a valuable addition to the countries that are maximizing the use of solar energy potentials, which boosts the floating photovoltaics (FPV) market share in forecast years.
For instance, in May 2024, according to the report provided by Indo-German Technical Cooperation on Innovative Solar Organization, India will install a cumulative floating solar capacity of 30 GW from 2024 to 2040.
Utilizing Unused Water Space and Reduces Water Evaporation
Photovoltaic panels that float on the water surface offer several potential advantages over land-based solar power plants. FPV systems are the ideal solution for large water bodies that would otherwise remain idle, such as reservoirs, lakes, and dams.
FPV systems mitigate the land scarcity issue, which often limits the expansion of traditional solar farms. Floating photovoltaics (FPV) systems are an alternative solution to conventional solar panels and allow a significantly larger possible installation of panels without further competition over vital land resources, particularly in densely populated or agricultural regions, which drives the floating photovoltaics FPV market share in the forecast period.
In addition, the shed on the water surface by floating photovoltaic (FPV) systems solar panels effectively reduces the evaporation water loss, making FPV systems useful in areas that face water scarcity. Floating photovoltaics systems save water in reservoirs for drinking, irrigation, or hydropower. The conservation of water benefits local communities and supports the sustainability of agricultural and industrial operations. FPV plants are more efficient in power generation due to the water-cooling effect provided by the water bodies, which foster the floating photovoltaics market growth in the projected years.
For instance, in January 2020, SECI company requested to set up a 4-MW grid-connected floating solar PV power project at Kalpong Dam, Diglipur, and North Andaman.
In 2020, SECI company sent a proposal to the State Government of Odisha for developing a 500-MW floating photovoltaics (FPV) plant at the Hirakud reservoir.
Transition to Renewable Energy Sources to Drive Market Growth
As global energy demands rise and the push for renewable energy intensifies, floating photovoltaics portends to be the singular solution for the diversification of energy sources. The world is therefore concentrating on solar energy to transition countries into a net-zero future. The floating photovoltaics systems serve as clean and renewable energy sources that further cut down greenhouse gas emissions and other outdoor pollutants.
FPV systems may relate to the existing hydro-plant infrastructure. Furthermore, with the combination of power generation through FPV systems and hydropower, creating hybrid systems will provide a more consistent and reliable energy supply. Hybrid systems will improve grid stability and increase the viability of renewable energy as a main energy source.
The FPV systems are applicable to a wide range of environmental conditions, from an urban water body to remote locations. Additionally, floating photovoltaics (FPV) systems are scalable and flexible, enabling faster responses to growing energy demands and the urgent need for renewable energy solutions in developing countries.
For instance, in July 2022, Trina Solar reported winning a tender for a 50MWac (71MWdc) for the supply of solar modules in the floating solar photovoltaic project for the Malaysian state of Sarawak in the auction organized by Sarawak Energy Berhad. The floating photovoltaics system will be integrated with the hydroelectric plant in Batang Ai, which generates value by combining renewable energy sources and optimizing grid connectivity.
Government and Manufacture Initiatives in R&D
Government and manufacturers are taking initiatives in R&D activities on floating photovoltaics. Manufacturers are investing in developing technology, enhancing its efficiency, and facilitating the widespread adoption of the product in different geographics. Manufacturers are investing in the development of more cost-effective and adaptable floating platforms. Additional improvements aim to achieve better stability, durability, and ease of installation in any type of water body, from calm reservoirs to open seas. Furthermore, R&D is pursued in the creation of new raw materials for floating photovoltaics systems, which will open opportunities for the global floating photovoltaics market in the forecast years.
On the contrary, most governments have been compelling public research centers and private companies to cooperate. Across the world, governments are providing huge support to the research and development of floating photovoltaic technology. With the assistance of research grants, subsidies, and low-interest loans to public research center universities and firms active in developing and improving the floating photovoltaics (FPV) systems.
For instance, in 2024, the governments of Germany and India introduced a new program known as Innovative-Solar (IN-Solar). Investigating the potential of New Innovative Solar Applications (NISA) to reduce land use and encourage the focused expansion of solar PV applications in India is the aim of the I-SUN project.
Stationary Floating Solar Panels to Dominate the Global Market Share
In the forecast period, stationary floating solar panels have a high adoption rate, which leads the segment to dominate the market. Designing and installation of stationary floating solar panels is simpler and cost effective as compared to the tracking solar panels systems. The stationary floating solar panels do not involve any moving parts mechanism as tracking systems reduce the cost of panels in the market. Stationary floating solar panels offer several advantages, such as durability and cost effectiveness that foster the market's demand.
Besides, stationary floating solar panels can be installed on different types of water bodies such as reservoirs, lakes, ponds, and coastal and offshore locations, making the system highly adaptable for different locations. The flexibility feature of stationary floating solar panels makes the system suited to several regions, including geographic locations with varied water levels or surface conditions. Several beneficial aspects of stationary floating solar panel systems sustain their dominance in the FPV market.
Asia-Pacific Leads the Floating Photovoltaics Market Share
Asia-Pacific has dominated the floating photovoltaics market share in 2023 and is expected to continue during the forecast period. Asia-Pacific comprises developing countries, and most of the countries are largely investing in renewable energy sources and reducing greenhouse gas emissions in the atmosphere. Countries such as Japan and South Korea face high population densities and limited land for large-scale solar installations. FPV systems are applied to bodies of water that are abundant in the countries to produce renewable energy. Demand for floating photovoltaics is fueled by Asia-Pacific's large customer base countries, which include China and India. Additionally, the increasing interest in floating photovoltaics among Southeast Asian countries is expected to be a major factor in driving the market growth during the forecast period.
In January 2022, Huaneng Power International company completed the world's largest floating PV, with a facility capacity of 320 MW in Dezhou, Shandong Province, China. The company has tied the floating array to a reservoir near Huaneng Power's 2.65-GW Dezhou thermal power station.
Future Market Scenario (2024 - 2031F)
Ongoing innovations and advancement in FPV technology will improve floating platforms, buoyancy systems, and panel efficiency, which will enhance the feasibility and cost-effectiveness of these systems.
As environmental concerns push for more sustainable technological solutions, renewable energy sources will gain significance.
Solar tracking feature of hydraulic pumps will be used in the FVP systems, which is expected to boost FPV systems sales.
Supportive government policies and financial incentives for renewable energy projects, including FPV, in developing countries will continue to play a significant role in driving floating photovoltaics market growth.
Key Players Landscape and Outlook
Continuous innovation characterizes the landscape of floating photovoltaics globally as the companies compete in terms of solar projects, energy efficiency, and unique features. The market outlook remains positive, owing to increased demand for renewable energy. Floating photovoltaics players are concerned with supply chain resilience, energy efficiency, and environmental practices, which will define the industry's future. Collaborations and developing technologies are projected to increase competition in the fast-paced market.
For instance, in July 2022, Ocean Sun AS company and Keppel Company decided to sign
an agreement for a 1.5 MWp floating PV project to be deployed near Jurong Island in Singapore.
Table of Contents
1. Project Scope and Definitions
2. Research Methodology
3. Executive Summary
4. Global Floating Photovoltaics Market Outlook, 2017-2031F
- 4.1. Market Size Analysis & Forecast
- 4.1.1. By Value
- 4.1.2. By Volume
- 4.2. Market Share Analysis & Forecast
- 4.2.1. By Product
- 4.2.1.1. Stationary Floating Solar Panels
- 4.2.1.2. Solar-tracking Floating Solar Panels
- 4.2.2. By System
- 4.2.2.1. Stand Alone FPV Systems
- 4.2.2.2. Hybrid FPV Hydropower Systems
- 4.2.3. By Application
- 4.2.3.1. Man-made Water Bodies
- 4.2.3.2. Natural Water Bodies
- 4.2.4. By Region
- 4.2.4.1. North America
- 4.2.4.2. Europe
- 4.2.4.3. Asia-Pacific
- 4.2.4.4. South America
- 4.2.4.5. Middle East and Africa
- 4.2.5. By Company Market Share Analysis (Top 5 Companies and Others - By Value, 2023)
- 4.2.1. By Product
- 4.3. Market Map Analysis, 2023
- 4.3.1. By Product
- 4.3.2. By System
- 4.3.3. By Application
- 4.3.4. By Region
5. North America Floating Photovoltaics (FPV) Market Outlook, 2017-2031F*
- 5.1. Market Size Analysis & Forecast
- 5.1.1. By Value
- 5.1.2. By Volume
- 5.2. Market Share Analysis & Forecast
- 5.2.1. By Product
- 5.2.1.1. Stationary Floating Solar Panels
- 5.2.1.2. Solar-tracking Floating Solar Panels
- 5.2.2. By System
- 5.2.2.1. Stand Alone FPV Systems
- 5.2.2.2. Hybrid FPV Hydropower Systems
- 5.2.3. By Application
- 5.2.3.1. Man-made Water Bodies
- 5.2.3.2. Natural Water Bodies
- 5.2.4. By Country Share
- 5.2.4.1. United States
- 5.2.4.2. Canada
- 5.2.4.3. Mexico
- 5.2.1. By Product
- 5.3. Country Market Assessment
- 5.3.1. United States Floating Photovoltaics (FPV) Market Outlook, 2017-2031F*
- 5.3.1.1. Market Size Analysis & Forecast
- 5.3.1.1.1. By Value
- 5.3.1.1.2. By Volume
- 5.3.1.2. Market Share Analysis & Forecast
- 5.3.1.2.1. By Product
- 5.3.1.2.1.1. Stationary Floating Solar Panels
- 5.3.1.2.1.2. Solar-tracking Floating Solar Panels
- 5.3.1.2.2. By System
- 5.3.1.2.2.1. Stand Alone FPV Systems
- 5.3.1.2.2.2. Hybrid FPV Hydropower Systems
- 5.3.1.2.3. By Application
- 5.3.1.2.3.1. Man-made Water Bodies
- 5.3.1.2.3.2. Natural Water Bodies
- 5.3.1.2.1. By Product
- 5.3.1.1. Market Size Analysis & Forecast
- 5.3.2. Canada
- 5.3.3. Mexico
- 5.3.1. United States Floating Photovoltaics (FPV) Market Outlook, 2017-2031F*
All segments will be provided for all regions and countries covered
6. Europe Floating Photovoltaics (FPV) Market Outlook, 2017-2031F
- 6.1. Germany
- 6.2. France
- 6.3. Italy
- 6.4. United Kingdom
- 6.5. Russia
- 6.6. Netherlands
- 6.7. Spain
- 6.8. Turkey
- 6.9. Poland
7. Asia-Pacific Floating Photovoltaics (FPV) Market Outlook, 2017-2031F
- 7.1. India
- 7.2. China
- 7.3. Japan
- 7.4. Australia
- 7.5. Vietnam
- 7.6. South Korea
- 7.7. Indonesia
- 7.8. Philippines
8. South America Floating Photovoltaics (FPV) Market Outlook, 2017-2031F
- 8.1. Brazil
- 8.2. Argentina
9. Middle East and Africa Floating Photovoltaics (FPV) Market Outlook, 2017-2031F
- 9.1. Saudi Arabia
- 9.2. UAE
- 9.3. South Africa
10. Porter's Five Forces Analysis
11. PESTLE Analysis
12. Market Dynamics
- 12.1. Market Drivers
- 12.2. Market Challenges
13. Market Trends and Developments
14. Case Studies
15. Competitive Landscape
- 15.1. Competition Matrix of Top 5 Market Leaders
- 15.2. SWOT Analysis for Top 5 Players
- 15.3. Key Players Landscape for Top 10 Market Players
- 15.3.1. SolarisFloat
- 15.3.1.1. Company Details
- 15.3.1.2. Key Management Personnel
- 15.3.1.3. Products and Services
- 15.3.1.4. Financials (As Reported)
- 15.3.1.5. Key Market Focus and Geographical Presence
- 15.3.1.6. Recent Developments/Collaborations/Partnerships/Mergers and Acquisition
- 15.3.2. Profloating B.V.
- 15.3.3. ISIGENERE S.L.
- 15.3.4. Oceans of Energy
- 15.3.5. Swimsol GmbH
- 15.3.6. OCEAN SUN AS
- 15.3.7. SCOTRA CO, LTD.
- 15.3.8. Xiamen Mibet New Energy Co., Ltd,
- 15.3.9. Ciel et Terre International
- 15.3.10. ABL Group
- 15.3.11. Abu Dhabi Future Energy Company PJSC's (Masdar)
- 15.3.1. SolarisFloat
Companies mentioned above DO NOT hold any order as per market share and may be changed as per information available during research work.

