|
|
市場調査レポート
商品コード
1472994
SaaSの世界市場の評価:展開モデル別、コンポーネント別、ユースケース別、ユーザータイプ別、業界別、地域別、機会、予測(2017年~2031年)Software as a Service Market Assessment, By Deployment Model, By Component, By Use Case, By User Type, By Industry Vertical, By Region, Opportunities and Forecast, 2017-2031F |
||||||

|
|||||||
カスタマイズ可能
|
|||||||

| SaaSの世界市場の評価:展開モデル別、コンポーネント別、ユースケース別、ユーザータイプ別、業界別、地域別、機会、予測(2017年~2031年) |
|
出版日: 2024年05月01日
発行: Markets & Data
ページ情報: 英文 235 Pages
納期: 3~5営業日
|

全表示
- 概要
- 図表
- 目次
世界のSaaSの市場規模は、2023年の2,081億米ドルから2031年に8,064億米ドルに達し、2024年~2031年の予測期間にCAGRで18.45%の成長が見込まれます。クラウドコンピューティングの世界では在宅勤務(WFH)が進んでおり、世界レベルでSaaS市場の需要を促進しています。SaaSは参入障壁が低く、その拡張性と柔軟性から需要が急増しています。サブスクリプションベースモデルは、利便性、個別化、持続可能性を提供することから人気を集めています。さらに、顧客の成功を促し、購入者の維持を向上させることで、企業は継続的な収益を獲得することができます。近年のデジタル化の動向も、世界のSaaS市場の成長を促進しています。さらに、AIと機械学習の統合により、企業はカスタムSaaSツールを提供することで、ビジネスの機会を次のレベルに引き上げることができます。このように、勤務動向の変化と技術の進化が、世界のSaaS市場の急速な拡大に拍車をかけています。
Adobe、Salesforce、Dropboxなど、主要市場企業のソリューションを利用するエンドユーザーにとって、利用料がより手頃であることから、サブスクリプションベースモデルが近年人気を集めています。サブスクリプションモデルとして提供されるSaaSの主な利点は、さまざまな部門で予測可能かつ反復的な収益源を生み出す能力を企業に提供できることです。さらに、企業は、世界のSaaS市場シェアの大部分を獲得するために、ターゲットとする顧客セグメントに合わせて特別に設計されたサブスクリプションモデルで、カスタマイズされたオプションを提供しています。
例えば、SaaS企業向けの決済インフラプロバイダーであるPaddleは、2023年8月、課金機能を向上させるために設計されたAPIとサービスの集積であるPaddle Billingを開始しました。これはPaddleの基本的なMoR(Merchant of Record)ビジネスを強化するものでもあります。ハイブリッド請求が可能になり、SaaS企業は請求書とクレジットカードを使用してサブスクリプションを請求できるようになり、一貫した顧客体験を提供します。
世界のSaaS市場の成長に寄与するAIとの統合
SaaS市場へのAIの導入は、予測分析を提供し、ルーチンタスクを自動化し、インテリジェントな知見を提供してビジネスの全体的な効率を向上させ、従来の経営方法に革命をもたらすことから、業界の成長を促進する重大な技術的進歩です。AIは機械学習と統合され、ビッグデータを分析してよりよい予測を行い、意思決定能力を強化します。機械学習は、Salesforceが開発したEinstein AIで使用され、営業担当者が潜在的なリードを特定し、カスタマイズされた推奨や考察を行うことを支援します。AIは、自然言語処理(NLP)技術を通じてSaaSでも利用されています。NLP技術は、人間の言葉を理解し解釈するために使用されます。例えば、MicrosoftのCortanaによるAIで動作するバーチャルアシスタントは、会議のスケジュールやメールの送信、リマインダーの提供などを行うことができます。
例えば、Siemensは2024年2月、同社の予知保全ソリューションの新しい生成AI機能であるSenseye Predictive Maintenanceをリリースしました。この開発は、予知保全をより理解しやすく、会話できるようにするために導入されました。SaaSソリューションのこの新しい生成AI機能は、生成AIと機械学習を組み合わせ、両技術の能力を活用した強力で完全な予知保全ソリューションを構築します。
世界のSaaS市場の需要を押し上げるモバイルファーストSaaSとバーティカルSaaSソリューション
SaaS市場は、モバイルデバイスの増加に伴い、モバイルファーストソリューションへの急速な移行を見せています。SaaS企業は、モバイルデバイス向けに特別に設計されたアプリケーションの作成に力を入れています。また、SaaSソリューションへのシームレスなモバイルアクセスに対するニーズの高まりに伴い、企業経営におけるスマートフォンやタブレット端末への依存度も高まっており、世界のSaaSの市場規模に寄与しています。これとは別に、バーティカルSaaSの開発者は、特定の業界のニーズやワークフローに合わせたソフトウェアに注力しています。業界に特化した知識は、特定の業界が抱える困難に対する理解を深め、その業界のペインポイントに対応するカスタマイズされたソリューションの設計を可能にします。バーティカルSaaSは企業が自社の業務に特化して設計されたソフトウェアを採用できるようにすることから、カスタマイズや業界の専門知識のレベルから、その分野の企業の利益を明示します。
当レポートでは、世界のSaaS市場について調査分析し、市場規模と予測、市場力学、主要企業の情勢と見通しなどを提供しています。
目次
第1章 調査手法
第2章 プロジェクトの範囲と定義
第3章 エグゼクティブサマリー
第4章 顧客の声
- 製品と市場情報
- ブランド認知の方式
- 購入決定において考慮される要素
- プライバシーと安全規制の考慮
第5章 世界のSaaS市場の見通し(2017年~2031年)
- 市場規模と予測
- 金額
- 展開モデル別
- パブリッククラウドホスティング
- プライベートクラウドホスティング
- ハイブリッドクラウドホスティング
- コンポーネント別
- ソフトウェア
- サービス
- ユースケース別
- 顧客関係管理(CRM)
- 人材管理
- エンタープライズリソースプランニング(ERP)
- BI・アナリティクス
- コンテンツ・コラボレーション・コミュニケーション
- その他
- ユーザータイプ別
- B2B
- B2C
- 業界別
- IT・通信
- BFSI
- 医療
- 小売・消費財
- 製造
- 教育
- 旅行・ホスピタリティ
- その他
- 地域別
- 北米
- 南米
- 欧州
- アジア太平洋
- 中東・アフリカ
- 市場シェア:企業別(2023年)
第6章 世界のSaaS市場の見通し:地域別(2017年~2031年)
- 北米
- 市場規模と予測
- 展開モデル別
- コンポーネント別
- ユースケース別
- ユーザータイプ別
- 業界別
- 米国
- カナダ
- メキシコ
- 欧州
- ドイツ
- フランス
- イタリア
- 英国
- ロシア
- オランダ
- スペイン
- トルコ
- ポーランド
- アジア太平洋
- インド
- 中国
- 日本
- オーストラリア
- ベトナム
- 韓国
- インドネシア
- フィリピン
- 南米
- ブラジル
- アルゼンチン
- 中東・アフリカ
- サウジアラビア
- アラブ首長国連邦
- 南アフリカ
第7章 市場マッピング(2023年)
- 展開モデル別
- コンポーネント別
- ユースケース別
- ユーザータイプ別
- 業界別
- 地域別
第8章 マクロ環境と業界構造
- バリューチェーン分析
- PESTEL分析
- ポーターのファイブフォース分析
第9章 市場力学
- 成長促進要因
- 成長抑制要因(課題、抑制要因)
第10章 主要企業の情勢
- マーケットリーダー上位5社の競合マトリクス
- マーケットリーダー上位5社の市場収益分析(2023年)
- 合併と買収/合弁事業(該当する場合)
- SWOT分析(市場企業5社)
- 特許分析(該当する場合)
第11章 ケーススタディ
第12章 主要企業の見通し
- Adobe Inc.
- Alphabet Inc.
- Amazon.com, Inc.
- Microsoft Corporation
- Oracle Corporation
- Salesforce, Inc.
- SAP SE
- ServiceNow, Inc.
- Shopify Inc.
- Zoom Communications, Inc.
第13章 戦略的推奨
第14章 当社について、免責事項
List of Tables
- Table 1. Pricing Analysis of Products from Key Players
- Table 2. Competition Matrix of Top 5 Market Leaders
- Table 3. Mergers & Acquisitions/ Joint Ventures (If Applicable)
- Table 4. About Us - Regions and Countries Where We Have Executed Client Projects
List of Figures
- Figure 1.Global Software as a Service Market, By Value, In USD Billion, 2017-2031F
- Figure 2.Global Software as a Service Market Share (%), By Deployment Model, 2017-2031F
- Figure 3.Global Software as a Service Market Share (%), By Component, 2017-2031F
- Figure 4.Global Software as a Service Market Share (%), By Use Case, 2017-2031F
- Figure 5.Global Software as a Service Market Share (%), By User Type, 2017-2031F
- Figure 6.Global Software as a Service Market Share (%), By Industry Vertical, 2017-2031F
- Figure 7.Global Software as a Service Market Share (%), By Region, 2017-2031F
- Figure 8.North America Software as a Service Market, By Value, In USD Billion, 2017-2031F
- Figure 9.North America Software as a Service Market Share (%), By Deployment Model, 2017-2031F
- Figure 10.North America Software as a Service Market Share (%), By Component, 2017-2031F
- Figure 11.North America Software as a Service Market Share (%), By Use Case, 2017-2031F
- Figure 12.North America Software as a Service Market Share (%), By User Type, 2017-2031F
- Figure 13.North America Software as a Service Market Share (%), By Industry Vertical, 2017-2031F
- Figure 14.North America Software as a Service Market Share (%), By Country, 2017-2031F
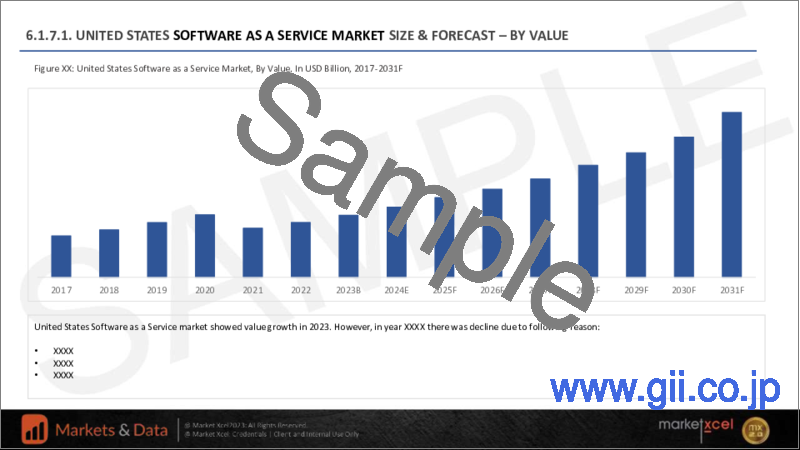
- Figure 15.United States Software as a Service Market, By Value, In USD Billion, 2017-2031F
- Figure 16.United States Software as a Service Market Share (%), By Deployment Model, 2017-2031F
- Figure 17.United States Software as a Service Market Share (%), By Component, 2017-2031F
- Figure 18.United States Software as a Service Market Share (%), By Use Case, 2017-2031F
- Figure 19.United States Software as a Service Market Share (%), By User Type, 2017-2031F
- Figure 20.United States Software as a Service Market Share (%), By Industry Vertical, 2017-2031F
- Figure 21.Canada Software as a Service Market, By Value, In USD Billion, 2017-2031F
- Figure 22.Canada Software as a Service Market Share (%), By Deployment Model, 2017-2031F
- Figure 23.Canada Software as a Service Market Share (%), By Component, 2017-2031F
- Figure 24.Canada Software as a Service Market Share (%), By Use Case, 2017-2031F
- Figure 25.Canada Software as a Service Market Share (%), By User Type, 2017-2031F
- Figure 26.Canada Software as a Service Market Share (%), By Industry Vertical, 2017-2031F
- Figure 27.Mexico Software as a Service Market, By Value, In USD Billion, 2017-2031F
- Figure 28.Mexico Software as a Service Market Share (%), By Deployment Model, 2017-2031F
- Figure 29.Mexico Software as a Service Market Share (%), By Component, 2017-2031F
- Figure 30.Mexico Software as a Service Market Share (%), By Use Case, 2017-2031F
- Figure 31.Mexico Software as a Service Market Share (%), By User Type, 2017-2031F
- Figure 32.Mexico Software as a Service Market Share (%), By Industry Vertical, 2017-2031F
- Figure 33.Europe Software as a Service Market, By Value, In USD Billion, 2017-2031F
- Figure 34.Europe Software as a Service Market Share (%), By Deployment Model, 2017-2031F
- Figure 35.Europe Software as a Service Market Share (%), By Component, 2017-2031F
- Figure 36.Europe Software as a Service Market Share (%), By Use Case, 2017-2031F
- Figure 37.Europe Software as a Service Market Share (%), By User Type, 2017-2031F
- Figure 38.Europe Software as a Service Market Share (%), By Industry Vertical, 2017-2031F
- Figure 39.Europe Software as a Service Market Share (%), By Country, 2017-2031F
- Figure 40.Germany Software as a Service Market, By Value, In USD Billion, 2017-2031F
- Figure 41.Germany Software as a Service Market Share (%), By Deployment Model, 2017-2031F
- Figure 42.Germany Software as a Service Market Share (%), By Component, 2017-2031F
- Figure 43.Germany Software as a Service Market Share (%), By Use Case, 2017-2031F
- Figure 44.Germany Software as a Service Market Share (%), By User Type, 2017-2031F
- Figure 45.Germany Software as a Service Market Share (%), By Industry Vertical, 2017-2031F
- Figure 46.France Software as a Service Market, By Value, In USD Billion, 2017-2031F
- Figure 47.France Software as a Service Market Share (%), By Deployment Model, 2017-2031F
- Figure 48.France Software as a Service Market Share (%), By Component, 2017-2031F
- Figure 49.France Software as a Service Market Share (%), By Use Case, 2017-2031F
- Figure 50.France Software as a Service Market Share (%), By User Type, 2017-2031F
- Figure 51.France Software as a Service Market Share (%), By Industry Vertical, 2017-2031F
- Figure 52.Italy Software as a Service Market, By Value, In USD Billion, 2017-2031F
- Figure 53.Italy Software as a Service Market Share (%), By Deployment Model, 2017-2031F
- Figure 54.Italy Software as a Service Market Share (%), By Component, 2017-2031F
- Figure 55.Italy Software as a Service Market Share (%), By Use Case, 2017-2031F
- Figure 56.Italy Software as a Service Market Share (%), By User Type, 2017-2031F
- Figure 57.Italy Software as a Service Market Share (%), By Industry Vertical, 2017-2031F
- Figure 58.United Kingdom Software as a Service Market, By Value, In USD Billion, 2017-2031F
- Figure 59.United Kingdom Software as a Service Market Share (%), By Deployment Model, 2017-2031F
- Figure 60.United Kingdom Software as a Service Market Share (%), By Component, 2017-2031F
- Figure 61.United Kingdom Software as a Service Market Share (%), By Use Case, 2017-2031F
- Figure 62.United Kingdom Software as a Service Market Share (%), By User Type, 2017-2031F
- Figure 63.United Kingdom Software as a Service Market Share (%), By Industry Vertical, 2017-2031F
- Figure 64.Russia Software as a Service Market, By Value, In USD Billion, 2017-2031F
- Figure 65.Russia Software as a Service Market Share (%), By Deployment Model, 2017-2031F
- Figure 66.Russia Software as a Service Market Share (%), By Component, 2017-2031F
- Figure 67.Russia Software as a Service Market Share (%), By Use Case, 2017-2031F
- Figure 68.Russia Software as a Service Market Share (%), By User Type, 2017-2031F
- Figure 69.Russia Software as a Service Market Share (%), By Industry Vertical, 2017-2031F
- Figure 70.Netherlands Software as a Service Market, By Value, In USD Billion, 2017-2031F
- Figure 71.Netherlands Software as a Service Market Share (%), By Deployment Model, 2017-2031F
- Figure 72.Netherlands Software as a Service Market Share (%), By Component, 2017-2031F
- Figure 73.Netherlands Software as a Service Market Share (%), By Use Case, 2017-2031F
- Figure 74.Netherlands Software as a Service Market Share (%), By User Type, 2017-2031F
- Figure 75.Netherlands Software as a Service Market Share (%), By Industry Vertical, 2017-2031F
- Figure 76.Spain Software as a Service Market, By Value, In USD Billion, 2017-2031F
- Figure 77.Spain Software as a Service Market Share (%), By Deployment Model, 2017-2031F
- Figure 78.Spain Software as a Service Market Share (%), By Component, 2017-2031F
- Figure 79.Spain Software as a Service Market Share (%), By Use Case, 2017-2031F
- Figure 80.Spain Software as a Service Market Share (%), By User Type, 2017-2031F
- Figure 81.Spain Software as a Service Market Share (%), By Industry Vertical, 2017-2031F
- Figure 82.Turkey Software as a Service Market, By Value, In USD Billion, 2017-2031F
- Figure 83.Turkey Software as a Service Market Share (%), By Deployment Model, 2017-2031F
- Figure 84.Turkey Software as a Service Market Share (%), By Component, 2017-2031F
- Figure 85.Turkey Software as a Service Market Share (%), By Use Case, 2017-2031F
- Figure 86.Turkey Software as a Service Market Share (%), By User Type, 2017-2031F
- Figure 87.Turkey Software as a Service Market Share (%), By Industry Vertical, 2017-2031F
- Figure 88.Poland Software as a Service Market, By Value, In USD Billion, 2017-2031F
- Figure 89.Poland Software as a Service Market Share (%), By Deployment Model, 2017-2031F
- Figure 90.Poland Software as a Service Market Share (%), By Component, 2017-2031F
- Figure 91.Poland Software as a Service Market Share (%), By Use Case, 2017-2031F
- Figure 92.Poland Software as a Service Market Share (%), By User Type, 2017-2031F
- Figure 93.Poland Software as a Service Market Share (%), By Industry Vertical, 2017-2031F
- Figure 94.South America Software as a Service Market, By Value, In USD Billion, 2017-2031F
- Figure 95.South America Software as a Service Market Share (%), By Deployment Model, 2017-2031F
- Figure 96.South America Software as a Service Market Share (%), By Component, 2017-2031F
- Figure 97.South America Software as a Service Market Share (%), By Use Case, 2017-2031F
- Figure 98.South America Software as a Service Market Share (%), By User Type, 2017-2031F
- Figure 99.South America Software as a Service Market Share (%), By Industry Vertical, 2017-2031F
- Figure 100.South America Software as a Service Market Share (%), By Country, 2017-2031F
- Figure 101.Brazil Software as a Service Market, By Value, In USD Billion, 2017-2031F
- Figure 102.Brazil Software as a Service Market Share (%), By Deployment Model, 2017-2031F
- Figure 103.Brazil Software as a Service Market Share (%), By Component, 2017-2031F
- Figure 104.Brazil Software as a Service Market Share (%), By Use Case, 2017-2031F
- Figure 105.Brazil Software as a Service Market Share (%), By User Type, 2017-2031F
- Figure 106.Brazil Software as a Service Market Share (%), By Industry Vertical, 2017-2031F
- Figure 107.Argentina Software as a Service Market, By Value, In USD Billion, 2017-2031F
- Figure 108.Argentina Software as a Service Market Share (%), By Deployment Model, 2017-2031F
- Figure 109.Argentina Software as a Service Market Share (%), By Component, 2017-2031F
- Figure 110.Argentina Software as a Service Market Share (%), By Use Case, 2017-2031F
- Figure 111.Argentina Software as a Service Market Share (%), By User Type, 2017-2031F
- Figure 112.Argentina Software as a Service Market Share (%), By Industry Vertical, 2017-2031F
- Figure 113.Asia-Pacific Software as a Service Market, By Value, In USD Billion, 2017-2031F
- Figure 114.Asia-Pacific Software as a Service Market Share (%), By Deployment Model, 2017-2031F
- Figure 115.Asia-Pacific Software as a Service Market Share (%), By Component, 2017-2031F
- Figure 116.Asia-Pacific Software as a Service Market Share (%), By Use Case, 2017-2031F
- Figure 117.Asia-Pacific Software as a Service Market Share (%), By User Type, 2017-2031F
- Figure 118.Asia-Pacific Software as a Service Market Share (%), By Industry Vertical, 2017-2031F
- Figure 119.Asia-Pacific Software as a Service Market Share (%), By Country, 2017-2031F
- Figure 120.India Software as a Service Market, By Value, In USD Billion, 2017-2031F
- Figure 121.India Software as a Service Market Share (%), By Deployment Model, 2017-2031F
- Figure 122.India Software as a Service Market Share (%), By Component, 2017-2031F
- Figure 123.India Software as a Service Market Share (%), By Use Case, 2017-2031F
- Figure 124.India Software as a Service Market Share (%), By User Type, 2017-2031F
- Figure 125.India Software as a Service Market Share (%), By Industry Vertical, 2017-2031F
- Figure 126.China Software as a Service Market, By Value, In USD Billion, 2017-2031F
- Figure 127.China Software as a Service Market Share (%), By Deployment Model, 2017-2031F
- Figure 128.China Software as a Service Market Share (%), By Component, 2017-2031F
- Figure 129.China Software as a Service Market Share (%), By Use Case, 2017-2031F
- Figure 130.China Software as a Service Market Share (%), By User Type, 2017-2031F
- Figure 131.China Software as a Service Market Share (%), By Industry Vertical, 2017-2031F
- Figure 132.Japan Software as a Service Market, By Value, In USD Billion, 2017-2031F
- Figure 133.Japan Software as a Service Market Share (%), By Deployment Model, 2017-2031F
- Figure 134.Japan Software as a Service Market Share (%), By Component, 2017-2031F
- Figure 135.Japan Software as a Service Market Share (%), By Use Case, 2017-2031F
- Figure 136.Japan Software as a Service Market Share (%), By User Type, 2017-2031F
- Figure 137.Japan Software as a Service Market Share (%), By Industry Vertical, 2017-2031F
- Figure 138.Australia Software as a Service Market, By Value, In USD Billion, 2017-2031F
- Figure 139.Australia Software as a Service Market Share (%), By Deployment Model, 2017-2031F
- Figure 140.Australia Software as a Service Market Share (%), By Component, 2017-2031F
- Figure 141.Australia Software as a Service Market Share (%), By Use Case, 2017-2031F
- Figure 142.Australia Software as a Service Market Share (%), By User Type, 2017-2031F
- Figure 143.Australia Software as a Service Market Share (%), By Industry Vertical, 2017-2031F
- Figure 144.Vietnam Software as a Service Market, By Value, In USD Billion, 2017-2031F
- Figure 145.Vietnam Software as a Service Market Share (%), By Deployment Model, 2017-2031F
- Figure 146.Vietnam Software as a Service Market Share (%), By Component, 2017-2031F
- Figure 147.Vietnam Software as a Service Market Share (%), By Use Case, 2017-2031F
- Figure 148.Vietnam Software as a Service Market Share (%), By User Type, 2017-2031F
- Figure 149.Vietnam Software as a Service Market Share (%), By Industry Vertical, 2017-2031F
- Figure 150.South Korea Software as a Service Market, By Value, In USD Billion, 2017-2031F
- Figure 151.South Korea Software as a Service Market Share (%), By Deployment Model, 2017-2031F
- Figure 152.South Korea Software as a Service Market Share (%), By Component, 2017-2031F
- Figure 153.South Korea Software as a Service Market Share (%), By Use Case, 2017-2031F
- Figure 154.South Korea Software as a Service Market Share (%), By User Type, 2017-2031F
- Figure 155.South Korea Software as a Service Market Share (%), By Industry Vertical, 2017-2031F
- Figure 156.Indonesia Software as a Service Market, By Value, In USD Billion, 2017-2031F
- Figure 157.Indonesia Software as a Service Market Share (%), By Deployment Model, 2017-2031F
- Figure 158.Indonesia Software as a Service Market Share (%), By Component, 2017-2031F
- Figure 159.Indonesia Software as a Service Market Share (%), By Use Case, 2017-2031F
- Figure 160.Indonesia Software as a Service Market Share (%), By User Type, 2017-2031F
- Figure 161.Indonesia Software as a Service Market Share (%), By Industry Vertical, 2017-2031F
- Figure 162.Philippines Software as a Service Market, By Value, In USD Billion, 2017-2031F
- Figure 163.Philippines Software as a Service Market Share (%), By Deployment Model, 2017-2031F
- Figure 164.Philippines Software as a Service Market Share (%), By Component, 2017-2031F
- Figure 165.Philippines Software as a Service Market Share (%), By Use Case, 2017-2031F
- Figure 166.Philippines Software as a Service Market Share (%), By User Type, 2017-2031F
- Figure 167.Philippines Software as a Service Market Share (%), By Industry Vertical, 2017-2031F
- Figure 168.Middle East & Africa Software as a Service Market, By Value, In USD Billion, 2017-2031F
- Figure 169.Middle East & Africa Software as a Service Market Share (%), By Deployment Model, 2017-2031F
- Figure 170.Middle East & Africa Software as a Service Market Share (%), By Component, 2017-2031F
- Figure 171.Middle East & Africa Software as a Service Market Share (%), By Use Case, 2017-2031F
- Figure 172.Middle East & Africa Software as a Service Market Share (%), By User Type, 2017-2031F
- Figure 173.Middle East & Africa Software as a Service Market Share (%), By Industry Vertical, 2017-2031F
- Figure 174.Middle East & Africa Software as a Service Market Share (%), By Country, 2017-2031F
- Figure 175.Saudi Arabia Software as a Service Market, By Value, In USD Billion, 2017-2031F
- Figure 176.Saudi Arabia Software as a Service Market Share (%), By Deployment Model, 2017-2031F
- Figure 177.Saudi Arabia Software as a Service Market Share (%), By Component, 2017-2031F
- Figure 178.Saudi Arabia Software as a Service Market Share (%), By Use Case, 2017-2031F
- Figure 179.Saudi Arabia Software as a Service Market Share (%), By User Type, 2017-2031F
- Figure 180.Saudi Arabia Software as a Service Market Share (%), By Industry Vertical, 2017-2031F
- Figure 181.UAE Software as a Service Market, By Value, In USD Billion, 2017-2031F
- Figure 182.UAE Software as a Service Market Share (%), By Deployment Model, 2017-2031F
- Figure 183.UAE Software as a Service Market Share (%), By Component, 2017-2031F
- Figure 184.UAE Software as a Service Market Share (%), By Use Case, 2017-2031F
- Figure 185.UAE Software as a Service Market Share (%), By User Type, 2017-2031F
- Figure 186.UAE Software as a Service Market Share (%), By Industry Vertical, 2017-2031F
- Figure 187.South Africa Software as a Service Market, By Value, In USD Billion, 2017-2031F
- Figure 188.South Africa Software as a Service Market Share (%), By Deployment Model, 2017-2031F
- Figure 189.South Africa Software as a Service Market Share (%), By Component, 2017-2031F
- Figure 190.South Africa Software as a Service Market Share (%), By Use Case, 2017-2031F
- Figure 191.South Africa Software as a Service Market Share (%), By User Type, 2017-2031F
- Figure 192.South Africa Software as a Service Market Share (%), By Industry Vertical, 2017-2031F
- Figure 193.By Deployment Model Map-Market Size (USD Billion) & Growth Rate (%), 2023
- Figure 194.By Component Map-Market Size (USD Billion) & Growth Rate (%), 2023
- Figure 195.By Use Case Map-Market Size (USD Billion) & Growth Rate (%), 2023
- Figure 196.By User Type Map-Market Size (USD Billion) & Growth Rate (%), 2023
- Figure 197.By Industry Vertical Map-Market Size (USD Billion) & Growth Rate (%), 2023
- Figure 198.By Region Map-Market Size (USD Billion) & Growth Rate (%), 2023
Global software as a service market is projected to witness a CAGR of 18.45% during the forecast period 2024-2031, growing from USD 208.1 billion in 2023 to USD 806.4 billion in 2031F. The cloud computing world is advancing towards work-from-home (WFH) jobs, fueling the demand for the software as a service market at the global level. Software-as-a-service has low entry barriers and witnesses an upsurge in demand due to its scalability and flexibility. Subscription-based models are gaining traction since they offer convenience, personalization, and sustainability. Furthermore, businesses can attract recurring revenue by encouraging customer success and improving buyers' retention. The recent digitalization trend also promotes global software as a service market growth. Furthermore, integrating artificial intelligence and machine learning results in businesses elevating their business opportunity to the next level by providing custom SaaS tools. Henceforth, the changing work trends and tech evolution fuel rapid software as a service market expansion at the global level.
The subscription-based model has been gaining traction in recent years as renting is more affordable for end-users to avail themselves of solutions by major market players such as Adobe, Salesforce, Dropbox, and others. The major advantage of SaaS provided as a subscription model is that it offers businesses the ability to generate predictable and recurring revenue streams across various sectors. Furthermore, businesses are providing curated options in subscription models specially designed to target customer segments to capture a large portion of global software as a service market share.
For instance, in August 2023, Paddle, a payments infrastructure provider for SaaS firms, launched Paddle Billing, a collection of APIs and services designed to improve billing capabilities. It also enhances Paddle's basic Merchant of Record (MoR) business. It enables hybrid billing, allowing SaaS firms to charge subscriptions using an invoice and a credit card, providing a consistent client experience.
Integration with Artificial Intelligence Contributing to Global Software as a Service Market Growth
Implementing artificial intelligence in the software as a service market is a significant technological advancement fueling the growth in the industry as it offers predictive analytics, automates routine tasks, and provides intelligent insights improving the overall efficiency of businesses and revolutionizing the traditional way of operations. Artificial intelligence is integrated along with machine learning to analyze big data to make better predictions and enhance decision-making capabilities. Machine learning is used by Einstein AI, which Salesforce developed to help sales representatives identify potential leads and make customized recommendations and insights. Artificial intelligence is also used in SaaS through natural language processing (NLP) technology. NLP technology is used to comprehend and interpret human language, such as an AI-powered virtual assistant by Microsoft's Cortana, which can schedule meetings, send emails, and provide reminders.
For instance, in February 2024, Siemens released Senseye Predictive Maintenance, a new generative AI functionality in its prediction maintenance solution. This development was introduced to make predictive maintenance more understandable and conversational. This new generative AI feature in the Software-as-a-Service solution combines generative AI with machine learning to build a strong, complete predictive maintenance solution that utilizes both technologies' capabilities.
Mobile-First SaaS and Vertical SaaS Solutions to Boost Global Software as a Service Market Demand
The software as a service market is witnessing a rapid drift towards mobile-first solutions with the rising number of mobile devices. SaaS companies are emphasizing creating more applications specially designed for mobile devices. Reliance on smartphones and tablets for company operations is also experiencing growth with the increasing need for seamless mobile access to SaaS solutions, contributing to the global software as a service market size. Apart from this, vertical SaaS developers are focusing on software tailored to the needs and workflows of specific industries. Industry-specific knowledge provides a better understanding of a certain industry's difficulties that allows the trend to design customized solutions to cater to the pain points of that specific industry. Vertical SaaS emphasizes the benefits of the businesses in the field from the level of customization and industry expertise, as it allows businesses to employ software designed specifically for their operations.
For instance, in September 2023, Mobly, a mobile software company, unveiled its latest application for B2B enterprises which focuses on enhancing lead collection speed and accuracy. Mobly allows searching for contacts by name and company and scans a badge or business card at any event by the use of AI-powered optical character recognition (OCR). It also enhances the lead information and seamlessly synchronizes the profiles and activity data with CRM or any marketing automation platform, shortening the time for a qualified lead. A process that used to take firms days or weeks can now be completed in seconds. The Mobly app is now accessible for Apple iOS and Google Android users.
North America Holds a Significant Share of the Market
North America is the most prominent region contributing to the growth of the global software as a service market share. The main factor behind the continuous growth of the market is the rapid shift in remote and hybrid work culture accelerated after the COVID-19 outbreak. This remote culture developed the demand for SaaS products to cater to the needs of the industries to manage remote teams and keep operations running smoothly and efficiently. Another factor was the necessity of better digital collaboration tools which enabled managers and employees to engage in proper communication to improve the workflow of the operations internally and externally. Furthermore, SaaS adoption became more prevalent in industries such as BFSI, manufacturing, and retail sectors as the era of digitalization across diverse sectors.
BFSI Sector Fostering Revenue in Global Software as a Service Market Share
SaaS is utilized in the BFSI sector since it offers superior flexibility to scale up or down depending upon the demand, thereby enabling the BFSI companies to efficiently add or remove features, users, and modules as required. The scalability achievement due to the utilization of SaaS in the BFSI sector results in the organizations staying competitive and agile in rapidly changing market dynamics. Thus, due to the above-mentioned benefits the deployment of SaaS is increasing in the BFSI sector. Furthermore, the integration of AI services with SaaS is also fostering the deployment of SaaS in the banking sector.
For instance, in April 2024, Oracle Corp. unveiled Oracle Financial Services Compliance Agent which is an artificial intelligence-powered cloud solution designed to assist the banking sector in combating anti-money laundering (AML) and the remaining compliant more efficiently. The tool allows institutions to conduct low-cost hypothetical scenario testing, alter thresholds and restrictions, and detect fraudulent actions. Compliance agents may evaluate the threat profile of new financial products, proactively analyze and reduce risks associated with vulnerable typologies, and make more cost-effective, quicker, and evidence-based risk modeling choices.
Future Market Scenario (2024-2031F)
According to the global software as a service market analysis, advancement in the field of artificial intelligence will attract more demand in the software as a service market as AI capabilities offer businesses to gain better values from their data, help to automate and customize services to cater specific industry needs, enhance the security level, and supplement human capacity. Along with automation in the software as a service market, businesses may rely on the automation tool to handle the misconfiguration issue and minimize data breaches and cybersecurity risks. Vertical SaaS may gain traction as it is completely customizable, targeting customers within a specific industry.
Key Players Landscape and Outlook
The global software as a service market has a presence of multiple companies dealing in the offering of software as a service resulting in new innovations in the market at the global level. Thus, the companies are launching new software as a service offer with upgraded features. This, in turn, is resulting in intense competition in the software as a service market at the global level.
For instance, in January 2024, Temenos AG, a Switzerland-based company that deals in the offering of software as a service (SaaS) launched end-to-end Temenos Enterprise Services. The new software as a service solution (SaaS) is enabling the banking sector to utilize software solutions in just 24 hours, thereby significantly minimizing modernization costs. The major focus of Temenos AG was to increase its market presence in the global software as a service market.
In February 2023, Oracle Corporation, a provider of SaaS solutions in the United States introduced Banking Cloud Services, a new offering of composable and componentized solutions for the banking industry. Banking Cloud Services is a software as a service (SaaS) solution that will offer corporate, along with retail banks, a competitive edge to modernize their banking applications to meet the customer's needs. The service innovation associated with software as a service (SaaS) will create a lucrative opportunity for the growth of the market during the projected forecast period.
Table of Contents
1.Research Methodology
2.Project Scope & Definitions
3.Executive Summary
4.Voice of Customer
- 4.1.Product and Market Intelligence
- 4.2.Mode of Brand Awareness
- 4.3.Factors Considered in Purchase Decisions
- 4.3.1.Features and other value-added service
- 4.3.2.IT Infrastructure Compatibility
- 4.3.3.Efficiency of Solutions
- 4.3.4.After-Sales Support
- 4.4.Consideration of Privacy & Safety Regulations
5.Global Software as a Service Market Outlook, 2017-2031F
- 5.1.Market Size & Forecast
- 5.1.1.By Value
- 5.2.By Deployment Model
- 5.2.1.Public Cloud Hosting
- 5.2.2.Private Cloud Hosting
- 5.2.3.Hybrid Cloud Hosting
- 5.3.By Component
- 5.3.1.Software
- 5.3.2.Service
- 5.4.By Use Case
- 5.4.1.Customer Relationship Management (CRM)
- 5.4.2.Human Capital Management
- 5.4.3.Enterprise Resource Planning (ERP)
- 5.4.4.BI & Analytics
- 5.4.5.Content, Collaboration & Communication
- 5.4.6.Others
- 5.5.By User Type
- 5.5.1.Business to Business (B2B)
- 5.5.2.Business to Customer (B2C)
- 5.6.By Industry Vertical
- 5.6.1.IT & Telecom
- 5.6.2.Banking, Financial Services & Insurance (BFSI)
- 5.6.3.Healthcare
- 5.6.4.Retail & Consumer Goods
- 5.6.5.Manufacturing
- 5.6.6.Education
- 5.6.7.Travel & Hospitality
- 5.6.8.Others
- 5.7.By Region
- 5.7.1.North America
- 5.7.2.South America
- 5.7.3.Europe
- 5.7.4.Asia-Pacific
- 5.7.5.Middle East & Africa
- 5.8.By Company Market Share (%), 2023
6.Global Software as a Service Market Outlook, By Region, 2017-2031F
- 6.1.North America*
- 6.1.1.Market Size & Forecast
- 6.1.1.1.By Value
- 6.1.2.By Deployment Model
- 6.1.2.1.Public Cloud Hosting
- 6.1.2.2.Private Cloud Hosting
- 6.1.2.3.Hybrid Cloud Hosting
- 6.1.3.By Component
- 6.1.3.1.Software
- 6.1.3.2.Service
- 6.1.4.By Use Case
- 6.1.4.1.Customer Relationship Management (CRM)
- 6.1.4.2.Human Capital Management
- 6.1.4.3.Enterprise Resource Planning (ERP)
- 6.1.4.4.BI & Analytics
- 6.1.4.5.Content, Collaboration & Communication
- 6.1.4.6.Others
- 6.1.5.By User Type
- 6.1.5.1.Business to Business (B2B)
- 6.1.5.2.Business to Customer (B2C)
- 6.1.6.By Industry Vertical
- 6.1.6.1.IT & Telecom
- 6.1.6.2.Banking, Financial Services & Insurance (BFSI)
- 6.1.6.3.Healthcare
- 6.1.6.4.Retail & Consumer Goods
- 6.1.6.5.Manufacturing
- 6.1.6.6.Education
- 6.1.6.7.Travel & Hospitality
- 6.1.6.8.Others
- 6.1.7.United States*
- 6.1.7.1.Market Size & Forecast
- 6.1.7.1.1.By Value
- 6.1.7.2.By Deployment Model
- 6.1.7.2.1.Public Cloud Hosting
- 6.1.7.2.2.Private Cloud Hosting
- 6.1.7.2.3.Hybrid Cloud Hosting
- 6.1.7.3.By Component
- 6.1.7.3.1.Software
- 6.1.7.3.2.Service
- 6.1.7.4.By Use Case
- 6.1.7.4.1.Customer Relationship Management (CRM)
- 6.1.7.4.2.Human Capital Management
- 6.1.7.4.3.Enterprise Resource Planning (ERP)
- 6.1.7.4.4.BI & Analytics
- 6.1.7.4.5.Content, Collaboration & Communication
- 6.1.7.4.6.Others
- 6.1.7.5.By User Type
- 6.1.7.5.1.Business to Business (B2B)
- 6.1.7.5.2.Business to Customer (B2C)
- 6.1.7.6.By Industry Vertical
- 6.1.7.6.1.IT & Telecom
- 6.1.7.6.2.Banking, Financial Services & Insurance (BFSI)
- 6.1.7.6.3.Healthcare
- 6.1.7.6.4.Retail & Consumer Goods
- 6.1.7.6.5.Manufacturing
- 6.1.7.6.6.Education
- 6.1.7.6.7.Travel & Hospitality
- 6.1.7.6.8.Others
- 6.1.7.1.Market Size & Forecast
- 6.1.8.Canada
- 6.1.9.Mexico
- 6.1.1.Market Size & Forecast
All segments will be provided for all regions and countries covered
- 6.2.Europe
- 6.2.1.Germany
- 6.2.2.France
- 6.2.3.Italy
- 6.2.4.United Kingdom
- 6.2.5.Russia
- 6.2.6.Netherlands
- 6.2.7.Spain
- 6.2.8.Turkey
- 6.2.9.Poland
- 6.3.Asia-Pacific
- 6.3.1.India
- 6.3.2.China
- 6.3.3.Japan
- 6.3.4.Australia
- 6.3.5.Vietnam
- 6.3.6.South Korea
- 6.3.7.Indonesia
- 6.3.8.Philippines
- 6.4.South America
- 6.4.1.Brazil
- 6.4.2.Argentina
- 6.5.Middle East & Africa
- 6.5.1.Saudi Arabia
- 6.5.2.UAE
- 6.5.3.South Africa
7.Market Mapping, 2023
- 7.1.By Deployment Model
- 7.2.By Component
- 7.3.By Use Case
- 7.4.By User Type
- 7.5.By Industry Vertical
- 7.6.By Region
8.Macro Environment and Industry Structure
- 8.1.Value Chain Analysis
- 8.2.PESTEL Analysis
- 8.2.1.Political Factors
- 8.2.2.Economic System
- 8.2.3.Social Implications
- 8.2.4.Technological Advancements
- 8.2.5.Environmental Impacts
- 8.2.6.Legal Compliances and Regulatory Policies (Statutory Bodies Included)
- 8.3.Porter's Five Forces Analysis
- 8.3.1.Supplier Power
- 8.3.2.Buyer Power
- 8.3.3.Substitution Threat
- 8.3.4.Threat from New Entrant
- 8.3.5.Competitive Rivalry
9.Market Dynamics
- 9.1.Growth Drivers
- 9.2.Growth Inhibitors (Challenges and Restraints)
10.Key Players Landscape
- 10.1.Competition Matrix of Top Five Market Leaders
- 10.2.Market Revenue Analysis of Top Five Market Leaders (in %, 2023)
- 10.3.Mergers and Acquisitions/Joint Ventures (If Applicable)
- 10.4.SWOT Analysis (For Five Market Players)
- 10.5.Patent Analysis (If Applicable)
11.Case Studies
12.Key Players Outlook
- 12.1.Adobe Inc.
- 12.1.1.Company Details
- 12.1.2.Key Management Personnel
- 12.1.3.Products & Services
- 12.1.4.Financials (As reported)
- 12.1.5.Key Market Focus & Geographical Presence
- 12.1.6.Recent Developments
- 12.2.Alphabet Inc.
- 12.3.Amazon.com, Inc.
- 12.4.Microsoft Corporation
- 12.5.Oracle Corporation
- 12.6.Salesforce, Inc.
- 12.7.SAP SE
- 12.8.ServiceNow, Inc.
- 12.9.Shopify Inc.
- 12.10.Zoom Communications, Inc.
Companies mentioned above DO NOT hold any order as per market share and can be changed as per information available during research work
