|
|
市場調査レポート
商品コード
1472984
猫砂市場の評価:カテゴリー・素材・包装タイプ・パックサイズ・フレグランス・エンドユーザー・価格帯・流通チャネル・地域別の機会および予測 (2017-2031年)Cat Litter Market Assessment, By Category, By Material, By Packaging Type, By Pack Size, By Fragrance, By End-user, By Price Range, By Distribution Channel, By Region, Opportunities, and Forecast, 2017-2031F |
||||||

|
|||||||
カスタマイズ可能
|
|||||||

| 猫砂市場の評価:カテゴリー・素材・包装タイプ・パックサイズ・フレグランス・エンドユーザー・価格帯・流通チャネル・地域別の機会および予測 (2017-2031年) |
|
出版日: 2024年05月01日
発行: Markets & Data
ページ情報: 英文 233 Pages
納期: 3~5営業日
|

全表示
- 概要
- 図表
- 目次
世界の猫砂の市場規模は、2023年の63億9,000万米ドルから、2024年から2031年の予測期間中は4.87%のCAGRで推移し、2031年には93億5,000万米ドルの規模に成長すると予測されています。
ペットケア業界では、猫砂が重要な位置を占めています。この分野の市場は、ペットとしての猫の世界的増加によって大きく牽引されています。猫砂は、猫だけでなく飼い主の衛生と利便性を確保するため、猫の飼い主にとって不可欠です。
都市化の進展、可処分所得の増加、ライフスタイルの変化などが、世界の猫砂市場の成長を後押しする要因となっています。さらに、防臭を含むペットの衛生に対する意識が高まっており、その結果、猫砂製品の需要が急増しています。
従来からクレイベースの猫砂は、その有効性と手頃な価格のために市場を独占してきました。資源が限られている猫の飼い主が衛生と利便性のために手頃な価格の選択肢を求めているため、これらの砂が大きな市場シェアを占めています。シリカゲル、松、牧草などの他の環境に優しく持続可能な代用品は、環境に優しい消費者の間で人気を集めています。
世界の猫砂市場の競合は、より優れた臭気管理、塊状化特性、環境に優しい革新的製品の導入などにより拡大しています。メーカー各社は市場シェアを維持・拡大するため、ブランドロイヤルティにつながる差別化された製品の開発に取り組んでいます。
地域的には、ペットの飼育率が高く、購買力が高く、より良い製品処方の導入がある北米が猫砂市場で優位を占めています。一方、ペットの衛生管理に対する意識が高まるにつれ、アジア太平洋地域が世界の猫砂産業において重要な市場として浮上しています。
市場成長を牽引するイノベーション:
臭いの抑制、固形化、環境に優しい代替品の製造など、さまざまな面で継続的な技術革新が市場で観察されています。市場で入手可能な一部の猫砂には抗菌剤が配合されており、トイレ内の細菌や真菌の繁殖を抑制します。低発塵の猫砂製剤が市場に参入しており、注いだりすくったりしている間の空気中の塵埃粒子を減らし、ペットや飼い主の呼吸器系の問題を最小限に抑え、周囲を清潔に保ちます。
世界のトレンドをナビゲートする持続可能な選択肢:
環境に対する意識の高まりとともに、環境意識の高い消費者は、持続可能で環境に優しく、倫理的に調達された代替品を探しています。このトレンドは、ミレニアル世代やZ世代の間で非常に人気があり、彼らはこれらの側面に基づいた購入決定を優先する傾向があります。紙、木、竹、松などの素材は再生可能で生分解性があります。これらの素材は倫理的に調達されており、従来のクレイベースの猫砂に比べてカーボンフットプリントや、必要とされるエネルギーや資源はより少ないです。
北米が圧倒的シェアを占める:
北米は世界の猫砂市場の支配的な勢力です。この地域の堅調な成長には多くの要因があります。米国では、ペットを飼う人の割合が過去35年間で急激に増加しました。その結果、同国ではペット保険が勢いを増しています。2024年現在、米国では66%の世帯(8,690万世帯)がペットを飼っています。ペットの所有率が高まるにつれ、ペットの人間化という概念が一般的になりつつあります。猫は米国で2番目に人気のあるペットで、犬の44.5%に次いで29%以上が飼われています。人々の購買力が向上したことで、猫の飼い主は、餌、獣医による治療、おもちゃなど、年間約613米ドルをペットに費やしています。さらに、より優れた製品処方がこの地域の特徴であり、市場シェアの大半を占める要因となっています。
当レポートでは、世界の猫砂の市場を調査し、市場の定義と概要、市場規模の推移・予測、各種区分・地域別の詳細分析、産業構造、市場成長への影響因子の分析、ケーススタディ、競合情勢、主要企業のプロファイルなどをまとめています。
目次
第1章 調査手法
第2章 プロジェクトの範囲と定義
第3章 エグゼクティブサマリー
第4章 顧客の声
- 人口統計
- 市場認知度と製品情報
- ブランド認知度とロイヤルティ
- 購入決定時に考慮される要素
- 購入目的
- 購入媒体
- 購入頻度
- 友人や家族からの推薦
- 製品/ブランドの浸透におけるブランドアンバサダーまたはインフルエンサーマーケティングの役割。
第5章 世界の猫砂市場の展望
- 市場規模・予測
- カテゴリー別
- 凝集
- 非凝集
- 素材別
- クレイ
- シリカゲル
- 松
- 小麦
- 草
- その他
- 包装タイプ別
- パケット
- ボックス
- キャニスター
- その他
- パックサイズ別
- 最大15ポンド
- フレグランス別
- 香り付き
- 無香料
- エンドユーザー別
- 住宅
- 商用
- 価格帯別
- 50ドル未満
- 50~100米ドル
- 100ドル超
- 流通チャネル別
- スーパーマーケット/ハイパーマーケット
- ペット専門店
- オンラインチャンネル
- その他
- 地域別
- 北米
- 欧州
- 南米
- アジア太平洋
- 中東・アフリカ
- 企業別市場シェア
第6章 世界の猫砂市場の展望:地域別
- 北米
- 欧州
- 南米
- アジア太平洋
- 中東・アフリカ
第7章 市場マッピング
- カテゴリー別
- 素材別
- 包装タイプ別
- パックサイズ別
- フレグランス別
- エンドユーザー別
- 価格帯別
- 流通チャネル別
- 地域別
第8章 マクロ環境と産業構造
- 需給分析
- 輸出入分析
- バリューチェーン分析
- PESTEL分析
- ポーターのファイブフォース分析
第9章 市場力学
- 成長促進要因
- 成長抑制要因 (課題と抑制)
第10章 主要企業の情勢
- 市場リーダー上位5社の競合マトリックス
- 市場リーダー上位5社の市場収益分析
- M&A・ジョイントベンチャー (該当する場合)
- SWOT分析(参入5社)
- 特許分析(該当する場合)
第11章 価格分析
第12章 ケーススタディ
第13章 主要企業の展望
- Nestle S.A.
- Mars, Incorporated
- Church & Dwight Co., Inc.
- The Clorox Company
- Oil-Dri Corporation of America
- Weihai Pearl Silica Gel Co., Ltd.
- Dr. Elsey's
- Intersand
- ZOLUX SAS
- Pestell Pet Products
第14章 戦略的提言
第15章 当社について・免責事項
List of Tables
- Table 1. Pricing Analysis of Products from Key Players
- Table 2. Competition Matrix of Top 5 Market Leaders
- Table 3. Mergers & Acquisitions/ Joint Ventures (If Applicable)
- Table 4. About Us - Regions and Countries Where We Have Executed Client Projects
List of Figures
- Figure 1.Global Cat Litter Market, By Value, In USD Billion, 2017-2031F
- Figure 2.Global Cat Litter Market, By Volume, In Thousand Tonnes, 2017-2031F
- Figure 3.Global Cat Litter Market Share (%), By Category, 2017-2031F
- Figure 4.Global Cat Litter Market Share (%), By Material, 2017-2031F
- Figure 5.Global Cat Litter Market Share (%), By Packaging Type, 2017-2031F
- Figure 6.Global Cat Litter Market Share (%), By Pack Size, 2017-2031F
- Figure 7.Global Cat Litter Market Share (%), By Fragrance, 2017-2031F
- Figure 8.Global Cat Litter Market Share (%), By End-user, 2017-2031F
- Figure 9.Global Cat Litter Market Share (%), By Price Range, 2017-2031F
- Figure 10.Global Cat Litter Market Share (%), By Distribution Channel, 2017-2031F
- Figure 11.Global Cat Litter Market Share (%), By Region, 2017-2031F
- Figure 12.North America Cat Litter Market, By Value, In USD Billion, 2017-2031F
- Figure 13.North America Cat Litter Market, By Volume, In Thousand Tonnes, 2017-2031F
- Figure 14.North America Cat Litter Market Share (%), By Category, 2017-2031F
- Figure 15.North America Cat Litter Market Share (%), By Material, 2017-2031F
- Figure 16.North America Cat Litter Market Share (%), By Packaging Type, 2017-2031F
- Figure 17.North America Cat Litter Market Share (%), By Pack Size, 2017-2031F
- Figure 18.North America Cat Litter Market Share (%), By Fragrance, 2017-2031F
- Figure 19.North America Cat Litter Market Share (%), By End-user, 2017-2031F
- Figure 20.North America Cat Litter Market Share (%), By Price Range, 2017-2031F
- Figure 21.North America Cat Litter Market Share (%), By Distribution Channel, 2017-2031F
- Figure 22.North America Cat Litter Market Share (%), By Country, 2017-2031F
- Figure 23.United States Cat Litter Market, By Value, In USD Billion, 2017-2031F
- Figure 24.United States Cat Litter Market, By Volume, In Thousand Tonnes, 2017-2031F
- Figure 25.United States Cat Litter Market Share (%), By Category, 2017-2031F
- Figure 26.United States Cat Litter Market Share (%), By Material, 2017-2031F
- Figure 27.United States Cat Litter Market Share (%), By Packaging Type, 2017-2031F
- Figure 28.United States Cat Litter Market Share (%), By Pack Size, 2017-2031F
- Figure 29.United States Cat Litter Market Share (%), By Fragrance, 2017-2031F
- Figure 30.United States Cat Litter Market Share (%), By End-user, 2017-2031F
- Figure 31.United States Cat Litter Market Share (%), By Price Range, 2017-2031F
- Figure 32.United States Cat Litter Market Share (%), By Distribution Channel, 2017-2031F
- Figure 33.Canada Cat Litter Market, By Value, In USD Billion, 2017-2031F
- Figure 34.Canada Cat Litter Market, By Volume, In Thousand Tonnes, 2017-2031F
- Figure 35.Canada Cat Litter Market Share (%), By Category, 2017-2031F
- Figure 36.Canada Cat Litter Market Share (%), By Material, 2017-2031F
- Figure 37.Canada Cat Litter Market Share (%), By Packaging Type, 2017-2031F
- Figure 38.Canada Cat Litter Market Share (%), By Pack Size, 2017-2031F
- Figure 39.Canada Cat Litter Market Share (%), By Fragrance, 2017-2031F
- Figure 40.Canada Cat Litter Market Share (%), By End-user, 2017-2031F
- Figure 41.Canada Cat Litter Market Share (%), By Price Range, 2017-2031F
- Figure 42.Canada Cat Litter Market Share (%), By Distribution Channel, 2017-2031F
- Figure 43.Mexico Cat Litter Market, By Value, In USD Billion, 2017-2031F
- Figure 44.Mexico Cat Litter Market, By Volume, In Thousand Tonnes, 2017-2031F
- Figure 45.Mexico Cat Litter Market Share (%), By Category, 2017-2031F
- Figure 46.Mexico Cat Litter Market Share (%), By Material, 2017-2031F
- Figure 47.Mexico Cat Litter Market Share (%), By Packaging Type, 2017-2031F
- Figure 48.Mexico Cat Litter Market Share (%), By Pack Size, 2017-2031F
- Figure 49.Mexico Cat Litter Market Share (%), By Fragrance, 2017-2031F
- Figure 50.Mexico Cat Litter Market Share (%), By End-user, 2017-2031F
- Figure 51.Mexico Cat Litter Market Share (%), By Price Range, 2017-2031F
- Figure 52.Mexico Cat Litter Market Share (%), By Distribution Channel, 2017-2031F
- Figure 53.Europe Cat Litter Market, By Value, In USD Billion, 2017-2031F
- Figure 54.Europe Cat Litter Market, By Volume, In Thousand Tonnes, 2017-2031F
- Figure 55.Europe Cat Litter Market Share (%), By Category, 2017-2031F
- Figure 56.Europe Cat Litter Market Share (%), By Material, 2017-2031F
- Figure 57.Europe Cat Litter Market Share (%), By Packaging Type, 2017-2031F
- Figure 58.Europe Cat Litter Market Share (%), By Pack Size, 2017-2031F
- Figure 59.Europe Cat Litter Market Share (%), By Fragrance, 2017-2031F
- Figure 60.Europe Cat Litter Market Share (%), By End-user, 2017-2031F
- Figure 61.Europe Cat Litter Market Share (%), By Price Range, 2017-2031F
- Figure 62.Europe Cat Litter Market Share (%), By Distribution Channel, 2017-2031F
- Figure 63.Europe Cat Litter Market Share (%), By Country, 2017-2031F
- Figure 64.Germany Cat Litter Market, By Value, In USD Billion, 2017-2031F
- Figure 65.Germany Cat Litter Market, By Volume, In Thousand Tonnes, 2017-2031F
- Figure 66.Germany Cat Litter Market Share (%), By Category, 2017-2031F
- Figure 67.Germany Cat Litter Market Share (%), By Material, 2017-2031F
- Figure 68.Germany Cat Litter Market Share (%), By Packaging Type, 2017-2031F
- Figure 69.Germany Cat Litter Market Share (%), By Pack Size, 2017-2031F
- Figure 70.Germany Cat Litter Market Share (%), By Fragrance, 2017-2031F
- Figure 71.Germany Cat Litter Market Share (%), By End-user, 2017-2031F
- Figure 72.Germany Cat Litter Market Share (%), By Price Range, 2017-2031F
- Figure 73.Germany Cat Litter Market Share (%), By Distribution Channel, 2017-2031F
- Figure 74.France Cat Litter Market, By Value, In USD Billion, 2017-2031F
- Figure 75.France Cat Litter Market, By Volume, In Thousand Tonnes, 2017-2031F
- Figure 76.France Cat Litter Market Share (%), By Category, 2017-2031F
- Figure 77.France Cat Litter Market Share (%), By Material, 2017-2031F
- Figure 78.France Cat Litter Market Share (%), By Packaging Type, 2017-2031F
- Figure 79.France Cat Litter Market Share (%), By Pack Size, 2017-2031F
- Figure 80.France Cat Litter Market Share (%), By Fragrance, 2017-2031F
- Figure 81.France Cat Litter Market Share (%), By End-user, 2017-2031F
- Figure 82.France Cat Litter Market Share (%), By Price Range, 2017-2031F
- Figure 83.France Cat Litter Market Share (%), By Distribution Channel, 2017-2031F
- Figure 84.Italy Cat Litter Market, By Value, In USD Billion, 2017-2031F
- Figure 85.Italy Cat Litter Market, By Volume, In Thousand Tonnes, 2017-2031F
- Figure 86.Italy Cat Litter Market Share (%), By Category, 2017-2031F
- Figure 87.Italy Cat Litter Market Share (%), By Material, 2017-2031F
- Figure 88.Italy Cat Litter Market Share (%), By Packaging Type, 2017-2031F
- Figure 89.Italy Cat Litter Market Share (%), By Pack Size, 2017-2031F
- Figure 90.Italy Cat Litter Market Share (%), By Fragrance, 2017-2031F
- Figure 91.Italy Cat Litter Market Share (%), By End-user, 2017-2031F
- Figure 92.Italy Cat Litter Market Share (%), By Price Range, 2017-2031F
- Figure 93.Italy Cat Litter Market Share (%), By Distribution Channel, 2017-2031F
- Figure 94.United Kingdom Cat Litter Market, By Value, In USD Billion, 2017-2031F
- Figure 95.United Kingdom Cat Litter Market, By Volume, In Thousand Tonnes, 2017-2031F
- Figure 96.United Kingdom Cat Litter Market Share (%), By Category, 2017-2031F
- Figure 97.United Kingdom Cat Litter Market Share (%), By Material, 2017-2031F
- Figure 98.United Kingdom Cat Litter Market Share (%), By Packaging Type, 2017-2031F
- Figure 99.United Kingdom Cat Litter Market Share (%), By Pack Size, 2017-2031F
- Figure 100.United Kingdom Cat Litter Market Share (%), By Fragrance, 2017-2031F
- Figure 101.United Kingdom Cat Litter Market Share (%), By End-user, 2017-2031F
- Figure 102.United Kingdom Cat Litter Market Share (%), By Price Range, 2017-2031F
- Figure 103.United Kingdom Cat Litter Market Share (%), By Distribution Channel, 2017-2031F
- Figure 104.Russia Cat Litter Market, By Value, In USD Billion, 2017-2031F
- Figure 105.Russia Cat Litter Market, By Volume, In Thousand Tonnes, 2017-2031F
- Figure 106.Russia Cat Litter Market Share (%), By Category, 2017-2031F
- Figure 107.Russia Cat Litter Market Share (%), By Material, 2017-2031F
- Figure 108.Russia Cat Litter Market Share (%), By Packaging Type, 2017-2031F
- Figure 109.Russia Cat Litter Market Share (%), By Pack Size, 2017-2031F
- Figure 110.Russia Cat Litter Market Share (%), By Fragrance, 2017-2031F
- Figure 111.Russia Cat Litter Market Share (%), By End-user, 2017-2031F
- Figure 112.Russia Cat Litter Market Share (%), By Price Range, 2017-2031F
- Figure 113.Russia Cat Litter Market Share (%), By Distribution Channel, 2017-2031F
- Figure 114.Netherlands Cat Litter Market, By Value, In USD Billion, 2017-2031F
- Figure 115.Netherlands Cat Litter Market, By Volume, In Thousand Tonnes, 2017-2031F
- Figure 116.Netherlands Cat Litter Market Share (%), By Category, 2017-2031F
- Figure 117.Netherlands Cat Litter Market Share (%), By Material, 2017-2031F
- Figure 118.Netherlands Cat Litter Market Share (%), By Packaging Type, 2017-2031F
- Figure 119.Netherlands Cat Litter Market Share (%), By Pack Size, 2017-2031F
- Figure 120.Netherlands Cat Litter Market Share (%), By Fragrance, 2017-2031F
- Figure 121.Netherlands Cat Litter Market Share (%), By End-user, 2017-2031F
- Figure 122.Netherlands Cat Litter Market Share (%), By Price Range, 2017-2031F
- Figure 123.Netherlands Cat Litter Market Share (%), By Distribution Channel, 2017-2031F
- Figure 124.Spain Cat Litter Market, By Value, In USD Billion, 2017-2031F
- Figure 125.Spain Cat Litter Market, By Volume, In Thousand Tonnes, 2017-2031F
- Figure 126.Spain Cat Litter Market Share (%), By Category, 2017-2031F
- Figure 127.Spain Cat Litter Market Share (%), By Material, 2017-2031F
- Figure 128.Spain Cat Litter Market Share (%), By Packaging Type, 2017-2031F
- Figure 129.Spain Cat Litter Market Share (%), By Pack Size, 2017-2031F
- Figure 130.Spain Cat Litter Market Share (%), By Fragrance, 2017-2031F
- Figure 131.Spain Cat Litter Market Share (%), By End-user, 2017-2031F
- Figure 132.Spain Cat Litter Market Share (%), By Price Range, 2017-2031F
- Figure 133.Spain Cat Litter Market Share (%), By Distribution Channel, 2017-2031F
- Figure 134.Turkey Cat Litter Market, By Value, In USD Billion, 2017-2031F
- Figure 135.Turkey Cat Litter Market, By Volume, In Thousand Tonnes, 2017-2031F
- Figure 136.Turkey Cat Litter Market Share (%), By Category, 2017-2031F
- Figure 137.Turkey Cat Litter Market Share (%), By Material, 2017-2031F
- Figure 138.Turkey Cat Litter Market Share (%), By Packaging Type, 2017-2031F
- Figure 139.Turkey Cat Litter Market Share (%), By Pack Size, 2017-2031F
- Figure 140.Turkey Cat Litter Market Share (%), By Fragrance, 2017-2031F
- Figure 141.Turkey Cat Litter Market Share (%), By End-user, 2017-2031F
- Figure 142.Turkey Cat Litter Market Share (%), By Price Range, 2017-2031F
- Figure 143.Turkey Cat Litter Market Share (%), By Distribution Channel, 2017-2031F
- Figure 144.Poland Cat Litter Market, By Value, In USD Billion, 2017-2031F
- Figure 145.Poland Cat Litter Market, By Volume, In Thousand Tonnes, 2017-2031F
- Figure 146.Poland Cat Litter Market Share (%), By Category, 2017-2031F
- Figure 147.Poland Cat Litter Market Share (%), By Material, 2017-2031F
- Figure 148.Poland Cat Litter Market Share (%), By Packaging Type, 2017-2031F
- Figure 149.Poland Cat Litter Market Share (%), By Pack Size, 2017-2031F
- Figure 150.Poland Cat Litter Market Share (%), By Fragrance, 2017-2031F
- Figure 151.Poland Cat Litter Market Share (%), By End-user, 2017-2031F
- Figure 152.Poland Cat Litter Market Share (%), By Price Range, 2017-2031F
- Figure 153.Poland Cat Litter Market Share (%), By Distribution Channel, 2017-2031F
- Figure 154.South America Cat Litter Market, By Value, In USD Billion, 2017-2031F
- Figure 155.South America Cat Litter Market, By Volume, In Thousand Tonnes, 2017-2031F
- Figure 156.South America Cat Litter Market Share (%), By Category, 2017-2031F
- Figure 157.South America Cat Litter Market Share (%), By Material, 2017-2031F
- Figure 158.South America Cat Litter Market Share (%), By Packaging Type, 2017-2031F
- Figure 159.South America Cat Litter Market Share (%), By Pack Size, 2017-2031F
- Figure 160.South America Cat Litter Market Share (%), By Fragrance, 2017-2031F
- Figure 161.South America Cat Litter Market Share (%), By End-user, 2017-2031F
- Figure 162.South America Cat Litter Market Share (%), By Price Range, 2017-2031F
- Figure 163.South America Cat Litter Market Share (%), By Distribution Channel, 2017-2031F
- Figure 164.South America Cat Litter Market Share (%), By Country, 2017-2031F
- Figure 165.Brazil Cat Litter Market, By Value, In USD Billion, 2017-2031F
- Figure 166.Brazil Cat Litter Market, By Volume, In Thousand Tonnes, 2017-2031F
- Figure 167.Brazil Cat Litter Market Share (%), By Category, 2017-2031F
- Figure 168.Brazil Cat Litter Market Share (%), By Material, 2017-2031F
- Figure 169.Brazil Cat Litter Market Share (%), By Packaging Type, 2017-2031F
- Figure 170.Brazil Cat Litter Market Share (%), By Pack Size, 2017-2031F
- Figure 171.Brazil Cat Litter Market Share (%), By Fragrance, 2017-2031F
- Figure 172.Brazil Cat Litter Market Share (%), By End-user, 2017-2031F
- Figure 173.Brazil Cat Litter Market Share (%), By Price Range, 2017-2031F
- Figure 174.Brazil Cat Litter Market Share (%), By Distribution Channel, 2017-2031F
- Figure 175.Argentina Cat Litter Market, By Value, In USD Billion, 2017-2031F
- Figure 176.Argentina Cat Litter Market, By Volume, In Thousand Tonnes, 2017-2031F
- Figure 177.Argentina Cat Litter Market Share (%), By Category, 2017-2031F
- Figure 178.Argentina Cat Litter Market Share (%), By Material, 2017-2031F
- Figure 179.Argentina Cat Litter Market Share (%), By Packaging Type, 2017-2031F
- Figure 180.Argentina Cat Litter Market Share (%), By Pack Size, 2017-2031F
- Figure 181.Argentina Cat Litter Market Share (%), By Fragrance, 2017-2031F
- Figure 182.Argentina Cat Litter Market Share (%), By End-user, 2017-2031F
- Figure 183.Argentina Cat Litter Market Share (%), By Price Range, 2017-2031F
- Figure 184.Argentina Cat Litter Market Share (%), By Distribution Channel, 2017-2031F
- Figure 185.Asia-Pacific Cat Litter Market, By Value, In USD Billion, 2017-2031F
- Figure 186.Asia-Pacific Cat Litter Market, By Volume, In Thousand Tonnes, 2017-2031F
- Figure 187.Asia-Pacific Cat Litter Market Share (%), By Category, 2017-2031F
- Figure 188.Asia-Pacific Cat Litter Market Share (%), By Material, 2017-2031F
- Figure 189.Asia-Pacific Cat Litter Market Share (%), By Packaging Type, 2017-2031F
- Figure 190.Asia-Pacific Cat Litter Market Share (%), By Pack Size, 2017-2031F
- Figure 191.Asia-Pacific Cat Litter Market Share (%), By Fragrance, 2017-2031F
- Figure 192.Asia-Pacific Cat Litter Market Share (%), By End-user, 2016-2030
- Figure 193.Asia-Pacific Cat Litter Market Share (%), By Price Range, 2017-2031F
- Figure 194.Asia-Pacific Cat Litter Market Share (%), By Distribution Channel, 2017-2031F
- Figure 195.Asia-Pacific Cat Litter Market Share (%), By Country, 2017-2031F
- Figure 196.India Cat Litter Market, By Value, In USD Billion, 2017-2031F
- Figure 197.India Cat Litter Market, By Volume, In Thousand Tonnes, 2017-2031F
- Figure 198.India Cat Litter Market Share (%), By Category, 2017-2031F
- Figure 199.India Cat Litter Market Share (%), By Material, 2017-2031F
- Figure 200.India Cat Litter Market Share (%), By Packaging Type, 2017-2031F
- Figure 201.India Cat Litter Market Share (%), By Pack Size, 2017-2031F
- Figure 202.India Cat Litter Market Share (%), By Fragrance, 2017-2031F
- Figure 203.India Cat Litter Market Share (%), By End-user, 2017-2031F
- Figure 204.India Cat Litter Market Share (%), By Price Range, 2017-2031F
- Figure 205.India Cat Litter Market Share (%), By Distribution Channel, 2017-2031F
- Figure 206.China Cat Litter Market, By Value, In USD Billion, 2017-2031F
- Figure 207.China Cat Litter Market, By Volume, In Thousand Tonnes, 2017-2031F
- Figure 208.China Cat Litter Market Share (%), By Category, 2017-2031F
- Figure 209.China Cat Litter Market Share (%), By Material, 2017-2031F
- Figure 210.China Cat Litter Market Share (%), By Packaging Type, 2017-2031F
- Figure 211.China Cat Litter Market Share (%), By Pack Size, 2017-2031F
- Figure 212.China Cat Litter Market Share (%), By Fragrance, 2017-2031F
- Figure 213.China Cat Litter Market Share (%), By End-user, 2017-2031F
- Figure 214.China Cat Litter Market Share (%), By Price Range, 2017-2031F
- Figure 215.China Cat Litter Market Share (%), By Distribution Channel, 2017-2031F
- Figure 216.Japan Cat Litter Market, By Value, In USD Billion, 2017-2031F
- Figure 217.Japan Cat Litter Market, By Volume, In Thousand Tonnes, 2017-2031F
- Figure 218.Japan Cat Litter Market Share (%), By Category, 2017-2031F
- Figure 219.Japan Cat Litter Market Share (%), By Material, 2017-2031F
- Figure 220.Japan Cat Litter Market Share (%), By Packaging Type, 2017-2031F
- Figure 221.Japan Cat Litter Market Share (%), By Pack Size, 2017-2031F
- Figure 222.Japan Cat Litter Market Share (%), By Fragrance, 2017-2031F
- Figure 223.Japan Cat Litter Market Share (%), By End-user, 2017-2031F
- Figure 224.Japan Cat Litter Market Share (%), By Price Range, 2017-2031F
- Figure 225.Japan Cat Litter Market Share (%), By Distribution Channel, 2017-2031F
- Figure 226.Australia Cat Litter Market, By Value, In USD Billion, 2017-2031F
- Figure 227.Australia Cat Litter Market, By Volume, In Thousand Tonnes, 2017-2031F
- Figure 228.Australia Cat Litter Market Share (%), By Category, 2017-2031F
- Figure 229.Australia Cat Litter Market Share (%), By Material, 2017-2031F
- Figure 230.Australia Cat Litter Market Share (%), By Packaging Type, 2017-2031F
- Figure 231.Australia Cat Litter Market Share (%), By Pack Size, 2017-2031F
- Figure 232.Australia Cat Litter Market Share (%), By Fragrance, 2017-2031F
- Figure 233.Australia Cat Litter Market Share (%), By End-user, 2017-2031F
- Figure 234.Australia Cat Litter Market Share (%), By Price Range, 2017-2031F
- Figure 235.Australia Cat Litter Market Share (%), By Distribution Channel, 2017-2031F
- Figure 236.Vietnam Cat Litter Market, By Value, In USD Billion, 2017-2031F
- Figure 237.Vietnam Cat Litter Market, By Volume, In Thousand Tonnes, 2017-2031F
- Figure 238.Vietnam Cat Litter Market Share (%), By Category, 2017-2031F
- Figure 239.Vietnam Cat Litter Market Share (%), By Material, 2017-2031F
- Figure 240.Vietnam Cat Litter Market Share (%), By Packaging Type, 2017-2031F
- Figure 241.Vietnam Cat Litter Market Share (%), By Pack Size, 2017-2031F
- Figure 242.Vietnam Cat Litter Market Share (%), By Fragrance, 2017-2031F
- Figure 243.Vietnam Cat Litter Market Share (%), By End-user, 2017-2031F
- Figure 244.Vietnam Cat Litter Market Share (%), By Price Range, 2017-2031F
- Figure 245.Vietnam Cat Litter Market Share (%), By Distribution Channel, 2017-2031F
- Figure 246.South Korea Cat Litter Market, By Value, In USD Billion, 2017-2031F
- Figure 247.South Korea Cat Litter Market, By Volume, In Thousand Tonnes, 2017-2031F
- Figure 248.South Korea Cat Litter Market Share (%), By Category, 2017-2031F
- Figure 249.South Korea Cat Litter Market Share (%), By Material, 2017-2031F
- Figure 250.South Korea Cat Litter Market Share (%), By Packaging Type, 2017-2031F
- Figure 251.South Korea Cat Litter Market Share (%), By Pack Size, 2017-2031F
- Figure 252.South Korea Cat Litter Market Share (%), By Fragrance, 2017-2031F
- Figure 253.South Korea Cat Litter Market Share (%), By End-user, 2017-2031F
- Figure 254.South Korea Cat Litter Market Share (%), By Price Range, 2017-2031F
- Figure 255.South Korea Cat Litter Market Share (%), By Distribution Channel, 2017-2031F
- Figure 256.Indonesia Cat Litter Market, By Value, In USD Billion, 2017-2031F
- Figure 257.Indonesia Cat Litter Market, By Volume, In Thousand Tonnes, 2017-2031F
- Figure 258.Indonesia Cat Litter Market Share (%), By Category, 2017-2031F
- Figure 259.Indonesia Cat Litter Market Share (%), By Material, 2017-2031F
- Figure 260.Indonesia Cat Litter Market Share (%), By Packaging Type, 2017-2031F
- Figure 261.Indonesia Cat Litter Market Share (%), By Pack Size, 2017-2031F
- Figure 262.Indonesia Cat Litter Market Share (%), By Fragrance, 2017-2031F
- Figure 263.Indonesia Cat Litter Market Share (%), By End-user, 2017-2031F
- Figure 264.Indonesia Cat Litter Market Share (%), By Price Range, 2017-2031F
- Figure 265.Indonesia Cat Litter Market Share (%), By Distribution Channel, 2017-2031F
- Figure 266.Philippines Cat Litter Market, By Value, In USD Billion, 2017-2031F
- Figure 267.Philippines Cat Litter Market, By Volume, In Thousand Tonnes, 2017-2031F
- Figure 268.Philippines Cat Litter Market Share (%), By Category, 2017-2031F
- Figure 269.Philippines Cat Litter Market Share (%), By Material, 2017-2031F
- Figure 270.Philippines Cat Litter Market Share (%), By Packaging Type, 2017-2031F
- Figure 271.Philippines Cat Litter Market Share (%), By Pack Size, 2017-2031F
- Figure 272.Philippines Cat Litter Market Share (%), By Fragrance, 2017-2031F
- Figure 273.Philippines Cat Litter Market Share (%), By End-user, 2017-2031F
- Figure 274.Philippines Cat Litter Market Share (%), By Price Range, 2017-2031F
- Figure 275.Philippines Cat Litter Market Share (%), By Distribution Channel, 2017-2031F
- Figure 276.Middle East & Africa Cat Litter Market, By Value, In USD Billion, 2017-2031F
- Figure 277.Middle East & Africa Cat Litter Market, By Volume, In Thousand Tonnes, 2017-2031F
- Figure 278.Middle East & Africa Cat Litter Market Share (%), By Category, 2017-2031F
- Figure 279.Middle East & Africa Cat Litter Market Share (%), By Material, 2017-2031F
- Figure 280.Middle East & Africa Cat Litter Market Share (%), By Packaging Type, 2017-2031F
- Figure 281.Middle East & Africa Cat Litter Market Share (%), By Pack Size, 2017-2031F
- Figure 282.Middle East & Africa Cat Litter Market Share (%), By Fragrance, 2017-2031F
- Figure 283.Middle East & Africa Cat Litter Market Share (%), By End-user, 2017-2031F
- Figure 284.Middle East & Africa Cat Litter Market Share (%), By Price Range, 2017-2031F
- Figure 285.Middle East & Africa Cat Litter Market Share (%), By Distribution Channel, 2017-2031F
- Figure 286.Middle East & Africa Cat Litter Market Share (%), By Country, 2017-2031F
- Figure 287.Saudi Arabia Cat Litter Market, By Value, In USD Billion, 2017-2031F
- Figure 288.Saudi Arabia Cat Litter Market, By Volume, In Thousand Tonnes, 2017-2031F
- Figure 289.Saudi Arabia Cat Litter Market Share (%), By Category, 2017-2031F
- Figure 290.Saudi Arabia Cat Litter Market Share (%), By Material, 2017-2031F
- Figure 291.Saudi Arabia Cat Litter Market Share (%), By Packaging Type, 2017-2031F
- Figure 292.Saudi Arabia Cat Litter Market Share (%), By Pack Size, 2017-2031F
- Figure 293.Saudi Arabia Cat Litter Market Share (%), By Fragrance, 2017-2031F
- Figure 294.Saudi Arabia Cat Litter Market Share (%), By End-user, 2017-2031F
- Figure 295.Saudi Arabia Cat Litter Market Share (%), By Price Range, 2017-2031F
- Figure 296.Saudi Arabia Cat Litter Market Share (%), By Distribution Channel, 2017-2031F
- Figure 297.UAE Cat Litter Market, By Value, In USD Billion, 2017-2031F
- Figure 298.UAE Cat Litter Market, By Volume, In Thousand Tonnes, 2017-2031F
- Figure 299.UAE Cat Litter Market Share (%), By Category, 2017-2031F
- Figure 300.UAE Cat Litter Market Share (%), By Material, 2017-2031F
- Figure 301.UAE Cat Litter Market Share (%), By Packaging Type, 2017-2031F
- Figure 302.UAE Cat Litter Market Share (%), By Pack Size, 2017-2031F
- Figure 303.UAE Cat Litter Market Share (%), By Fragrance, 2017-2031F
- Figure 304.UAE Cat Litter Market Share (%), By End-user, 2017-2031F
- Figure 305.UAE Cat Litter Market Share (%), By Price Range, 2017-2031F
- Figure 306.UAE Cat Litter Market Share (%), By Distribution Channel, 2017-2031F
- Figure 307.South Africa Cat Litter Market, By Value, In USD Billion, 2017-2031F
- Figure 308.South Africa Cat Litter Market, By Volume, In Thousand Tonnes, 2017-2031F
- Figure 309.South Africa Cat Litter Market Share (%), By Category, 2017-2031F
- Figure 310.South Africa Cat Litter Market Share (%), By Material, 2017-2031F
- Figure 311.South Africa Cat Litter Market Share (%), By Packaging Type, 2017-2031F
- Figure 312.South Africa Cat Litter Market Share (%), By Pack Size, 2017-2031F
- Figure 313.South Africa Cat Litter Market Share (%), By Fragrance, 2017-2031F
- Figure 314.South Africa Cat Litter Market Share (%), By End-user, 2017-2031F
- Figure 315.South Africa Cat Litter Market Share (%), By Price Range, 2017-2031F
- Figure 316.South Africa Cat Litter Market Share (%), By Distribution Channel, 2017-2031F
- Figure 317.By Category Map-Market Size (USD Billion) & Growth Rate (%), 2023
- Figure 318.By Material Map-Market Size (USD Billion) & Growth Rate (%), 2023
- Figure 319.By Packaging Type Map-Market Size (USD Billion) & Growth Rate (%), 2023
- Figure 320.By Pack Size Map-Market Size (USD Billion) & Growth Rate (%), 2023
- Figure 321.By Fragrance Map-Market Size (USD Billion) & Growth Rate (%), 2023
- Figure 322.By End-user Map-Market Size (USD Billion) & Growth Rate (%), 2023
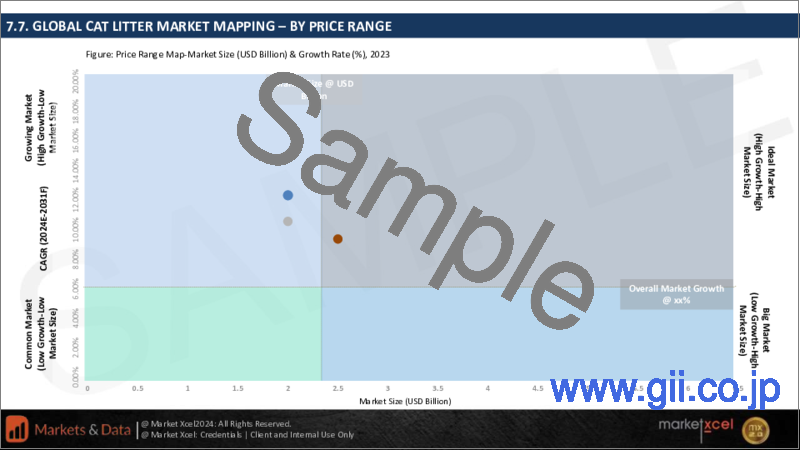
- Figure 323.By Price Range Map-Market Size (USD Billion) & Growth Rate (%), 2023
- Figure 324.By Distribution Channel Map-Market Size (USD Billion) & Growth Rate (%), 2023
- Figure 325.By Region Map-Market Size (USD Billion) & Growth Rate (%), 2023
Global cat litter market was valued at USD 6.39 billion in 2023, expected to reach USD 9.35 billion in 2031, with a CAGR of 4.87% for the forecast period between 2024 and 2031. In the pet care industry, cat litter holds a specific significance. This segment of the market is majorly driven by the increasing global adoption of cats as pets. Cat litter is essential for cat owners as it ensures hygiene and convenience for cats as well as owners.
Growing urbanization, increasing disposable incomes, and changing lifestyles are some factors propelling the growth of the global cat litter market. Moreover, there is a growing awareness about pet hygiene, including odor control, which has consequently surged the demand for cat litter products.
Traditionally, clay-based cat litter has dominated the market due to its effectiveness and affordability. These litters hold a major market share as cat owners with limited resources seek affordable options for hygiene and convenience. Other eco-friendly and sustainable substitutes, such as silica gel, pine, and grass, are gaining traction among environmentally friendly consumers.
The competition in the global cat litter market is growing owing to the introduction of innovative products with better odor management, clumping properties, and eco-friendliness. Manufacturers are working on creating differentiated products, leading to brand loyalty to maintain and gain their market share.
Geographically, North America is dominant in the cat litter market because of its high pet ownership rate, greater purchasing power, and introduction to better product formulations. In August 2023, Eco-Shell, LP introduced an innovative calming solution for cats. The product, Naturally Fresh Harmony Lavender & Bamboo Clumping Litter, features lavender and bamboo essential oils, enhancing the mood of the cats using the Harmony formula. It is the first ever mood-enhancing formula which improves the relationship between cats and their owners, using Givaudan MoodScentz+ technology.
However, with increasing awareness towards maintaining pet hygiene, Asia-Pacific is emerging as a significant market in global cat litter industry.
Innovations to Drive the Market Growth
Continued innovations are observed in the market in various aspects like odor control, clumping properties, and producing eco-friendly substitutes. Researchers are developing new formulations and additives to manage foul odor and provide better clumping. Better hygiene helps cat owners to manage their pets efficiently. Some cat litter available in the market is infused with antimicrobial agents that inhibit the growth of bacteria and fungi in the litter box. Low-dust cat litter formulations are entering the market, reducing air-borne dust particles while pouring and scooping, further minimizing respiratory issues for pets and owners, and keeping the surroundings clean. Cat litter consisting of larger granules or pellets often has less dust. For instance, Dr. Elsey's offers Precious Cat Respiratory Relief Unscented Clumping Clay Cat Litter which is a low-dust cat litter with added herbal essences, hypoallergenic, and comparatively reasonable. The product generates hard clumps for easy lifting.
Sustainable Alternatives to Navigate Global Cat Litter Market Trend
With increasing awareness towards environment, environmentally conscious consumers look for alternatives which are sustainable, eco-friendly, and ethically sourced. The trend is quite popular among millennials and generation Z as they tend to prioritize their purchase decisions based on these aspects. Materials such as paper, wood, bamboo, and pine are renewable and biodegradable. These materials are sourced ethically and have a lower carbon footprint as compared to the traditional clay-based cat litter. Lesser energy and resources are required to manufacture cat litter using these materials. This way pet owners feel like accomplishing their responsibility towards the environment and contribute to conservation efforts.
In February 2024, PetSafe launched PetSafe ScoopFree Premium Natural Litter, which controls odor for more than 21 days and is 100% natural using fossilized algae without any added fragrance, dyes, or chemicals. The new product is an extension of PetSafe's existing premium cat litter range. It is a non-clumping, highly absorbent formula that can be utilized with any traditional litter box.
North America to Hold the Dominant Share
North America is a dominant force in the global cat litter market. Numerous factors are responsible for the robust growth of the region. In the United States, the percentage of pet owners has surged drastically in the past 35 years. Consequently, pet insurance is gaining momentum in the country. 66% of households in the United States (86.9 million homes) have a pet, as of 2024. With growing pet ownerships, the concept of pet humanization is becoming common. Cats are the second most popular pets in the country, with more than 29% ownership, after dogs stand at more than 44.5%. With better purchasing power of people, cat owners spend around USD 613 annually on their pets, including their food, veterinary care, and toys. Moreover, better-advanced product formulations are a part of the region that helps it to gain the majority market share.
Future Market Scenario (2024 - 2031F)
Market share for sustainable and eco-friendly products will increase as more consumers adopt environmentally friendly products. Owing to changing consumer preferences, more investments are expected in this segment.
Manufacturers are likely to work on providing more health-oriented products to pet owners in the form of products made by utilizing hypoallergenic materials, antimicrobial properties, and low-dust formulations. Technological advancements will spike over the coming years.
With the growing trend of pet humanization, the demand for customized and personalized cat litter products is expected to see a surge. Consumers may prioritize buying products with specific scents, textures, and packaging designs tailored as per their pet requirements.
Key Players Landscape and Outlook
Global cat litter market displays a competitive environment with numerous key players dominating the industry. The key players are introducing differentiated products and maintaining their market share. In August 2023, the pet care company Intersand introduced a cat litter product that monitors the pet's health as well. OdourLock MaxCare contains diagnostic Blucare granules. When these granules encounter blood or glucose in urine, they turn into blue from white. It alerts the cat-owners of the health risks that their pet might be affected with. The product is dust-free and counteracts odor by leveraging ammonia-blocking properties. Such products are driving technological advancements in the market leading to increased demand for the products.
The market outlook seems to be promising with factors such as rising pet ownership, increasing demand for sustainable and eco-friendly products and technological advancements in the industry. Mergers, acquisitions, and strategic partnerships are evolving the landscape of the market providing better products to the consumers.
Table of Contents
1.Research Methodology
2.Project Scope & Definitions
3.Executive Summary
4.Voice of Customer
- 4.1.Demographics (Age/Cohort Analysis - Baby Boomers and Gen X, Millennials, Gen Z; Gender; Income - Low, Mid, and High; Geography; Nationality; etc.)
- 4.2.Market Awareness and Product Information
- 4.3.Brand Awareness and Loyalty
- 4.4.Factors Considered in Purchase Decision
- 4.4.1.Brand Name
- 4.4.2.Material
- 4.4.3.Packaging
- 4.4.4.Fragrance
- 4.4.5.Clumping Ability
- 4.4.6.Price
- 4.4.7.Smart Features
- 4.4.8.Availability and Accessibility
- 4.5.Purpose of Purchase
- 4.6.Medium of Purchase
- 4.7.Frequency of Purchase
- 4.8.Recommendations from friends/family
- 4.9.Role of Brand Ambassador or Influencer Marketing on Product/Brand Absorption.
5.Global Cat Litter Market Outlook, 2017-2031F
- 5.1.Market Size & Forecast
- 5.1.1.By Value
- 5.1.2.By Volume
- 5.2.By Category
- 5.2.1.Clumping
- 5.2.2.Non-clumping
- 5.3.By Material
- 5.3.1.Clay
- 5.3.2.Silica Gel
- 5.3.3.Pine
- 5.3.4.Wheat
- 5.3.5.Grass
- 5.3.6.Others
- 5.4.By Packaging Type
- 5.4.1.Packets
- 5.4.2.Boxes
- 5.4.3.Canisters
- 5.4.4.Others
- 5.5.By Pack size
- 5.5.1.Up to 15 lbs
- 5.5.2.16 - 30 lbs
- 5.5.3.31 lbs Above
- 5.6.By Fragrance
- 5.6.1.Scented
- 5.6.2.Unscented
- 5.7.By End-user
- 5.7.1.Residential
- 5.7.2.Commercial
- 5.7.2.1.Veterinary Clinics
- 5.7.2.2.Zoological Parks
- 5.7.2.3.Animal Shelters
- 5.7.2.4.Others
- 5.8.By Price Range
- 5.8.1.Less than USD 50
- 5.8.2.USD 50 - USD 100
- 5.8.3.Above USD 100
- 5.9.By Distribution Channel
- 5.9.1.Supermarkets/Hypermarkets
- 5.9.2.Specialized Pet Shops
- 5.9.3.Online Channel
- 5.9.4.Others
- 5.10.By Region
- 5.10.1.North America
- 5.10.2.Europe
- 5.10.3.South America
- 5.10.4.Asia-Pacific
- 5.10.5.Middle East and Africa
- 5.11.By Company Market Share (%), 2023
6.Global Cat Litter Market Outlook, By Region, 2017-2031F
- 6.1.North America*
- 6.1.1.Market Size & Forecast
- 6.1.1.1.By Value
- 6.1.1.2.By Volume
- 6.1.2.By Category
- 6.1.2.1.Clumping
- 6.1.2.2.Non-clumping
- 6.1.3.By Material
- 6.1.3.1.Clay
- 6.1.3.2.Silica Gel
- 6.1.3.3.Pine
- 6.1.3.4.Wheat
- 6.1.3.5.Grass
- 6.1.3.6.Others
- 6.1.4.By Packaging Type
- 6.1.4.1.Packets
- 6.1.4.2.Boxes
- 6.1.4.3.Canisters
- 6.1.4.4.Others
- 6.1.5.By Pack size
- 6.1.5.1.Less than 15 lbs
- 6.1.5.2.15 - 30 lbs
- 6.1.5.3.Above 30 lbs
- 6.1.6.By Fragrance
- 6.1.6.1.Scented
- 6.1.6.2.Unscented
- 6.1.7.By End-user
- 6.1.7.1.Residential
- 6.1.7.2.Commercial
- 6.1.7.2.1.Veterinary Clinics
- 6.1.7.2.2.Zoological Parks
- 6.1.7.2.3.Animal Shelters
- 6.1.7.2.4.Others
- 6.1.8.By Price Range
- 6.1.8.1.1.Less than USD 50
- 6.1.8.1.2.USD 50 - USD 100
- 6.1.8.1.3.Above USD 100
- 6.1.9.By Distribution Channel
- 6.1.9.1.Supermarkets/Hypermarkets
- 6.1.9.2.Specialized Pet Shops
- 6.1.9.3.Online Channel
- 6.1.9.4.Others
- 6.1.10.United States*
- 6.1.10.1.Market Size & Forecast
- 6.1.10.1.1.By Value
- 6.1.10.1.2.By Volume
- 6.1.10.2.By Category
- 6.1.10.2.1.Clumping
- 6.1.10.2.2.Non-clumping
- 6.1.10.3.By Material
- 6.1.10.3.1.Clay
- 6.1.10.3.2.Silica Gel
- 6.1.10.3.3.Pine
- 6.1.10.3.4.Wheat
- 6.1.10.3.5.Grass
- 6.1.10.3.6.Others
- 6.1.10.4.By Packaging Type
- 6.1.10.4.1.Packets
- 6.1.10.4.2.Boxes
- 6.1.10.4.3.Canisters
- 6.1.10.4.4.Others
- 6.1.10.5.By Pack size
- 6.1.10.5.1.Less than 15 lbs
- 6.1.10.5.2.15 - 30 lbs
- 6.1.10.5.3.Above 30 lbs
- 6.1.10.6.By Fragrance
- 6.1.10.6.1.Scented
- 6.1.10.6.2.Unscented
- 6.1.10.7.By End-user
- 6.1.10.7.1.Residential
- 6.1.10.7.2.Commercial
- 6.1.10.7.2.1.Veterinary Clinics
- 6.1.10.7.2.2.Zoological Parks
- 6.1.10.7.2.3.Animal Shelters
- 6.1.10.7.2.4.Others
- 6.1.10.8.By Price Range
- 6.1.10.8.1.Less than USD 50
- 6.1.10.8.2.USD 50 - USD 100
- 6.1.10.8.3.Above USD 100
- 6.1.10.9.By Distribution Channel
- 6.1.10.9.1.Supermarkets/Hypermarkets
- 6.1.10.9.2.Specialized Pet Shops
- 6.1.10.9.3.Online Channel
- 6.1.10.9.4.Others
- 6.1.10.1.Market Size & Forecast
- 6.1.11.Canada
- 6.1.12.Mexico
- 6.1.1.Market Size & Forecast
All segments will be provided for all regions and countries covered
- 6.2.Europe
- 6.2.1.Germany
- 6.2.2.France
- 6.2.3.Italy
- 6.2.4.United Kingdom
- 6.2.5.Russia
- 6.2.6.Netherlands
- 6.2.7.Spain
- 6.2.8.Turkey
- 6.2.9.Poland
- 6.3.South America
- 6.3.1.Brazil
- 6.3.2.Argentina
- 6.4.Asia-Pacific
- 6.4.1.India
- 6.4.2.China
- 6.4.3.Japan
- 6.4.4.Australia
- 6.4.5.Vietnam
- 6.4.6.South Korea
- 6.4.7.Indonesia
- 6.4.8.Philippines
- 6.5.Middle East & Africa
- 6.5.1.UAE
- 6.5.2.Saudi Arabia
- 6.5.3.South Africa
7.Market Mapping, 2023
- 7.1.By Category
- 7.2.By Material
- 7.3.By Packaging Type
- 7.4.By Pack Size
- 7.5.By Fragrance
- 7.6.By End-user
- 7.7.By Price Range
- 7.8.By Distribution Channel
- 7.9.By Region
8.Macro Environment and Industry Structure
- 8.1.Supply Demand Analysis
- 8.2.Import Export Analysis
- 8.3.Value Chain Analysis
- 8.4.PESTEL Analysis
- 8.4.1.Political Factors
- 8.4.2.Economic System
- 8.4.3.Social Implications
- 8.4.4.Technological Advancements
- 8.4.5.Environmental Impacts
- 8.4.6.Legal Compliances and Regulatory Policies (Statutory Bodies Included)
- 8.5.Porter's Five Forces Analysis
- 8.5.1.Supplier Power
- 8.5.2.Buyer Power
- 8.5.3.Substitution Threat
- 8.5.4.Threat from New Entrant
- 8.5.5.Competitive Rivalry
9.Market Dynamics
- 9.1.Growth Drivers
- 9.2.Growth Inhibitors (Challenges and Restraints)
10.Key Players Landscape
- 10.1.Competition Matrix of Top Five Market Leaders
- 10.2.Market Revenue Analysis of Top Five Market Leaders (in %, 2023)
- 10.3.Mergers and Acquisitions/Joint Ventures (If Applicable)
- 10.4.SWOT Analysis (For Five Market Players)
- 10.5.Patent Analysis (If Applicable)
11.Pricing Analysis
12.Case Studies
13.Key Players Outlook
- 13.1.Nestle S.A.
- 13.1.1.Company Details
- 13.1.2.Key Management Personnel
- 13.1.3.Products & Services
- 13.1.4.Financials (As reported)
- 13.1.5.Key Market Focus & Geographical Presence
- 13.1.6.Recent Developments
- 13.2.Mars, Incorporated
- 13.3.Church & Dwight Co., Inc.
- 13.4.The Clorox Company
- 13.5.Oil-Dri Corporation of America
- 13.6.Weihai Pearl Silica Gel Co., Ltd.
- 13.7.Dr. Elsey's
- 13.8.Intersand
- 13.9.ZOLUX SAS
- 13.10.Pestell Pet Products
Companies mentioned above DO NOT hold any order as per market share and can be changed as per information available during research work
