|
|
市場調査レポート
商品コード
1419603
LNG貯蔵タンクの世界市場の評価:タイプ別、材料別、最終用途産業別、地域別、機会、予測(2017年~2031年)LNG Storage Tank Market Assessment, By Type, By Material, By End-use Industry, By Region, Opportunities and Forecast, 2017-2031F |
||||||
|
|||||||
カスタマイズ可能
|
|||||||

| LNG貯蔵タンクの世界市場の評価:タイプ別、材料別、最終用途産業別、地域別、機会、予測(2017年~2031年) |
|
出版日: 2024年02月01日
発行: Markets & Data
ページ情報: 英文 223 Pages
納期: 3~5営業日
|

全表示
- 概要
- 図表
- 目次
世界のLNG貯蔵タンクの市場規模は、2023年の158億4,000万米ドルから2031年に294億5,000万米ドルに達し、2024年~2031年の予測期間にCAGRで8.06%の成長が見込まれています。市場は近年大幅な成長を示しており、今後も力強い拡大ペースを維持すると予測されます。
LNG貯蔵タンクは、天然ガスの貯蔵と輸送において非常に効率的です。さらに、LNG貯蔵施設は、エネルギー源の多様化、送電網の安定性の向上、二酸化炭素排出の削減によってエネルギー部門に革命をもたらすなど、複数の利点があります。LNG貯蔵施設は、エネルギー安全保障を促進し、天然ガス生産の中断時にLNGの安定供給を確保する上で重要な役割を果たします。さらに、さまざまなエネルギーや鉄鋼の最終用途産業におけるLNG需要の増加、よりよいLNGインフラへのニーズなどの要因によって市場成長が促進されます。
LNG需要が増加している地域が豊富な資源を持つ地域からの供給を求めていることから、適切なLNGインフラの必要性が高まっています。この緊急性は、増大するエネルギー需要の対応へのニーズや、国内ガス供給量の減少、パイプラインによるガス供給の中断によって強まっています。
例えば、2023年9月、VINCI Constructionの子会社であるVINCI Construction Grands Projetsは、オランダで18万m3のLNGタンクを建設する1億7,522万米ドルの契約を受注しました。このプロジェクトは、ロッテルダムにあるGATEターミナルの貯蔵能力拡張と再ガス化の一部であり、これにより年間40億m3の追加のガス供給が可能となります。このプロジェクトには、ニッケル鋼の内槽とポストテンションコンクリートの外槽からなる新しいLNG貯蔵タンクの建設が含まれます。完成は2026年後半を予定しています。
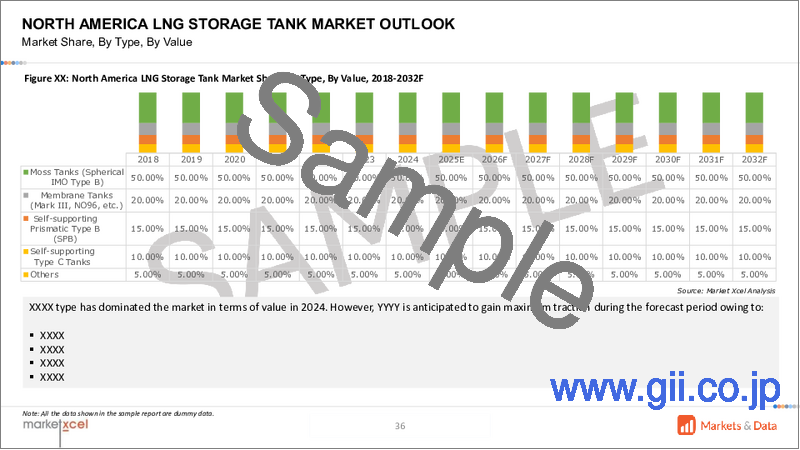
メンブレンタンクの利用が市場成長を加速
LNG貯蔵タンク市場では、その安全性、柔軟性、費用対効果からメンブレンタンクの利用が増加しています。メンブレンタンクは、安全性という点では9%ニッケル鋼のフルコンテインメントタンクに匹敵すると考えられており、ほとんどの大企業に受け入れられています。メンブレン技術は当初、LNGタンカーで使用するために設計されましたが、現在では陸上のLNG貯蔵タンクにも使用されています。さらに、メンブレンタンクコンテインメントシステムは、LNG、LPG、エチレン貯蔵の経験に基づく実証済みの安全性で、納入製品を増やしながらロスを削減します。
例えば2024年1月、GTTは2隻の新造液化天然ガス運搬船(LNGC)のタンク設計を受注しました。最初のLNGCは総容量174,000m3で、韓国の造船所Hanwha Oceanが建造し、NO96 GWメンブレン格納システムを採用します。この船の引渡しは2027年第3四半期を予定しています。2隻目のLNGCも総容量174,000m3で、韓国の造船所Samsung Heavy Industriesが建造し、GTTのMark III Flexメンブレンコンテインメントシステムを搭載します。
モスタンクが市場の発展を支援
タンク形状の最適化や新しいメンブレンタイプの登場など、モスタンクの設計開発がLNG貯蔵タンク市場に影響を与えています。ボイルオフガス(BOG)性能の異なる新しいメンブレンソリューションの導入を含むこれらの開発は、LNG運搬船の効率と性能を高めています。さらに、LNGバンカリング市場の発展と地域再配分へのニーズに後押しされ、独立タンクの使用が中小規模のLNG船部門で勢いを増しています。
例えば、2023年12月、NYK Line、Namura Shipbuilding、Sasebo Heavy Industriesの3社は共同で、蒸気タービン駆動のモス型LNG船の主推進機をX-DFエンジンと呼ばれるデュアルフューエル低速ディーゼルエンジンに置き換えました。モス型LNG船のLNGタンクは耐久性に優れ、長期間の使用に耐えるため、燃費の向上と船舶資源の効率的な利用が可能になります。
当レポートでは、世界のLNG貯蔵タンク市場について調査分析し、市場規模と予測、市場力学、主要企業情勢と見通しなどを提供しています。
目次
第1章 調査手法
第2章 プロジェクトの範囲と定義
第3章 エグゼクティブサマリー
第4章 顧客の声
- 製品と市場のインテリジェンス
- 購入決定において考慮される要素
第5章 世界のLNG貯蔵タンク市場の見通し(2017年~2031年)
- 市場規模と予測
- 金額
- 数量
- タイプ別
- モスタンク(球形IMOタイプB LNGタンク)
- メンブレンタンク
- 自立角形IMOタイプB(SPB)
- その他
- 材料別
- アルミニウム
- ステンレス鋼
- ニッケル鋼(9%)
- その他
- 最終用途産業別
- エネルギー・電力
- 金属加工
- 輸送・ロジスティクス
- その他
- 地域別
- 北米
- 欧州
- アジア太平洋
- 南米
- 中東・アフリカ
- 市場シェア:企業別(2023年)
第6章 世界のLNG貯蔵タンク市場の見通し:地域別(2017年~2031年)
- 北米
- 市場規模と予測
- タイプ別
- 材料別
- 最終用途産業別
- 米国
- カナダ
- メキシコ
- 欧州
- ドイツ
- フランス
- イタリア
- 英国
- ロシア
- オランダ
- スペイン
- トルコ
- ポーランド
- アジア太平洋
- インド
- 中国
- 日本
- オーストラリア
- ベトナム
- 韓国
- インドネシア
- フィリピン
- 南米
- ブラジル
- アルゼンチン
- 中東・アフリカ
- サウジアラビア
- アラブ首長国連邦
- 南アフリカ
第7章 市場マッピング(2023年)
- タイプ別
- 材料別
- 最終用途産業別
- 地域別
第8章 マクロ環境と産業構造
- 需給分析
- 輸出入の分析
- バリューチェーン分析
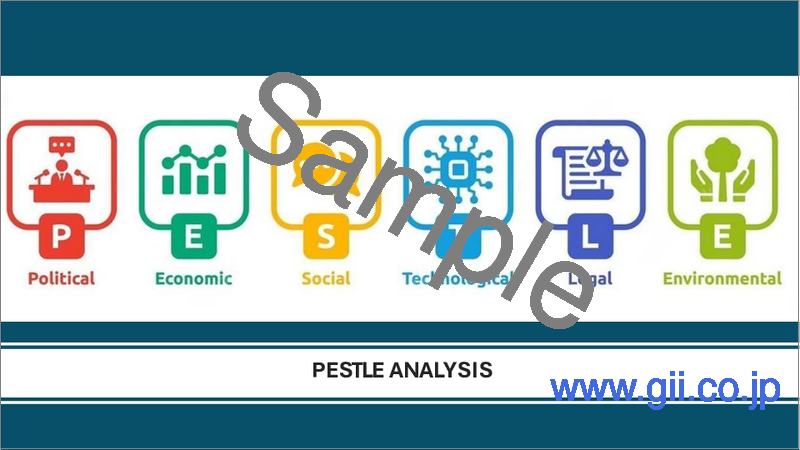
- PESTEL分析
- ポーターのファイブフォース分析
第9章 市場力学
- 成長促進要因
- 成長抑制要因(課題、抑制要因)
第10章 主要企業情勢
- マーケットリーダー上位5社の競合マトリクス
- マーケットリーダー上位5社の市場収益分析(2023年)
- 合併と買収/合弁事業(該当する場合)
- SWOT分析(市場参入企業5社)
- 特許分析(該当する場合)
第11章 ケーススタディ
第12章 主要企業の見通し
- Sinopec
- Linde Plc
- McDermott International Inc.
- IHI Corporation
- Wartsila
- CIMC ENRIC
- Carbon Energy Group
- Qatargas
- ExxonMobil
- Cryolor
第13章 戦略的推奨事項
第14章 当社について、免責事項
List of Tables
- Table 1. Pricing Analysis of Products from Key Players
- Table 2. Competition Matrix of Top 5 Market Leaders
- Table 3. Mergers & Acquisitions/ Joint Ventures (If Applicable)
- Table 4. About Us - Regions and Countries Where We Have Executed Client Projects
List of Figures
- Figure 1. Global LNG Storage Tank Market, By Value, in USD Billion, 2017-2031F
- Figure 2. Global LNG Storage Tank Market, By Volume, in Thousand Units, 2017-2031F
- Figure 3. Global LNG Storage Tank Market Share (%), By Type, 2017-2031F
- Figure 4. Global LNG Storage Tank Market Share (%), By Material, 2017-2031F
- Figure 5. Global LNG Storage Tank Market Share (%), By End-use Industry, 2017-2031F
- Figure 6. Global LNG Storage Tank Market Share (%), By Region, 2017-2031F
- Figure 7. North America LNG Storage Tank Market, By Value, in USD Billion, 2017-2031F
- Figure 8. North America LNG Storage Tank Market, By Volume, in Thousand Units, 2017-2031F
- Figure 9. North America LNG Storage Tank Market Share (%), By Type, 2017-2031F
- Figure 10. North America LNG Storage Tank Market Share (%), By Material, 2017-2031F
- Figure 11. North America LNG Storage Tank Market Share (%), By End-use Industry, 2017-2031F
- Figure 12. North America LNG Storage Tank Market Share (%), By Country, 2017-2031F
- Figure 13. United States LNG Storage Tank Market, By Value, in USD Billion, 2017-2031F
- Figure 14. United States LNG Storage Tank Market, By Volume, in Thousand Units, 2017-2031F
- Figure 15. United States LNG Storage Tank Market Share (%), By Type, 2017-2031F
- Figure 16. United States LNG Storage Tank Market Share (%), By Material, 2017-2031F
- Figure 17. United States LNG Storage Tank Market Share (%), By End-use Industry, 2017-2031F
- Figure 18. Canada LNG Storage Tank Market, By Value, in USD Billion, 2017-2031F
- Figure 19. Canada LNG Storage Tank Market, By Volume, in Thousand Units, 2017-2031F
- Figure 20. Canada LNG Storage Tank Market Share (%), By Type, 2017-2031F
- Figure 21. Canada LNG Storage Tank Market Share (%), By Material, 2017-2031F
- Figure 22. Canada LNG Storage Tank Market Share (%), By End-use Industry, 2017-2031F
- Figure 23. Mexico LNG Storage Tank Market, By Value, in USD Billion, 2017-2031F
- Figure 24. Mexico LNG Storage Tank Market, By Volume, in Thousand Units, 2017-2031F
- Figure 25. Mexico LNG Storage Tank Market Share (%), By Type, 2017-2031F
- Figure 26. Mexico LNG Storage Tank Market Share (%), By Material, 2017-2031F
- Figure 27. Mexico LNG Storage Tank Market Share (%), By End-use Industry, 2017-2031F
- Figure 28. Europe LNG Storage Tank Market, By Value, in USD Billion, 2017-2031F
- Figure 29. Europe LNG Storage Tank Market, By Volume, in Thousand Units, 2017-2031F
- Figure 30. Europe LNG Storage Tank Market Share (%), By Type, 2017-2031F
- Figure 31. Europe LNG Storage Tank Market Share (%), By Material, 2017-2031F
- Figure 32. Europe LNG Storage Tank Market Share (%), By End-use Industry, 2017-2031F
- Figure 33. Europe LNG Storage Tank Market Share (%), By Country, 2017-2031F
- Figure 34. Germany LNG Storage Tank Market, By Value, in USD Billion, 2017-2031F
- Figure 35. Germany LNG Storage Tank Market, By Volume, in Thousand Units, 2017-2031F
- Figure 36. Germany LNG Storage Tank Market Share (%), By Type, 2017-2031F
- Figure 37. Germany LNG Storage Tank Market Share (%), By Material, 2017-2031F
- Figure 38. Germany LNG Storage Tank Market Share (%), By End-use Industry, 2017-2031F
- Figure 39. France LNG Storage Tank Market, By Value, in USD Billion, 2017-2031F
- Figure 40. France LNG Storage Tank Market, By Volume, in Thousand Units, 2017-2031F
- Figure 41. France LNG Storage Tank Market Share (%), By Type, 2017-2031F
- Figure 42. France LNG Storage Tank Market Share (%), By Material, 2017-2031F
- Figure 43. France LNG Storage Tank Market Share (%), By End-use Industry, 2017-2031F
- Figure 44. Italy LNG Storage Tank Market, By Value, in USD Billion, 2017-2031F
- Figure 45. Italy LNG Storage Tank Market, By Volume, in Thousand Units, 2017-2031F
- Figure 46. Italy LNG Storage Tank Market Share (%), By Type, 2017-2031F
- Figure 47. Italy LNG Storage Tank Market Share (%), By Material, 2017-2031F
- Figure 48. Italy LNG Storage Tank Market Share (%), By End-use Industry, 2017-2031F
- Figure 49. United Kingdom LNG Storage Tank Market, By Value, in USD Billion, 2017-2031F
- Figure 50. United Kingdom LNG Storage Tank Market, By Volume, in Thousand Units, 2017-2031F
- Figure 51. United Kingdom LNG Storage Tank Market Share (%), By Type, 2017-2031F
- Figure 52. United Kingdom LNG Storage Tank Market Share (%), By Material, 2017-2031F
- Figure 53. United Kingdom LNG Storage Tank Market Share (%), By End-use Industry, 2017-2031F
- Figure 54. Russia LNG Storage Tank Market, By Value, in USD Billion, 2017-2031F
- Figure 55. Russia LNG Storage Tank Market, By Volume, in Thousand Units, 2017-2031F
- Figure 56. Russia LNG Storage Tank Market Share (%), By Type, 2017-2031F
- Figure 57. Russia LNG Storage Tank Market Share (%), By Material, 2017-2031F
- Figure 58. Russia LNG Storage Tank Market Share (%), By End-use Industry, 2017-2031F
- Figure 59. Netherlands LNG Storage Tank Market, By Value, in USD Billion, 2017-2031F
- Figure 60. Netherlands LNG Storage Tank Market, By Volume, in Thousand Units, 2017-2031F
- Figure 61. Netherlands LNG Storage Tank Market Share (%), By Type, 2017-2031F
- Figure 62. Netherlands LNG Storage Tank Market Share (%), By Material, 2017-2031F
- Figure 63. Netherlands LNG Storage Tank Market Share (%), By End-use Industry, 2017-2031F
- Figure 64. Spain LNG Storage Tank Market, By Value, in USD Billion, 2017-2031F
- Figure 65. Spain LNG Storage Tank Market, By Volume, in Thousand Units, 2017-2031F
- Figure 66. Spain LNG Storage Tank Market Share (%), By Type, 2017-2031F
- Figure 67. Spain LNG Storage Tank Market Share (%), By Material, 2017-2031F
- Figure 68. Spain LNG Storage Tank Market Share (%), By End-use Industry, 2017-2031F
- Figure 69. Turkey LNG Storage Tank Market, By Value, in USD Billion, 2017-2031F
- Figure 70. Turkey LNG Storage Tank Market, By Volume, in Thousand Units, 2017-2031F
- Figure 71. Turkey LNG Storage Tank Market Share (%), By Type, 2017-2031F
- Figure 72. Turkey LNG Storage Tank Market Share (%), By Material, 2017-2031F
- Figure 73. Turkey LNG Storage Tank Market Share (%), By End-use Industry, 2017-2031F
- Figure 74. Poland LNG Storage Tank Market, By Value, in USD Billion, 2017-2031F
- Figure 75. Poland LNG Storage Tank Market, By Volume, in Thousand Units, 2017-2031F
- Figure 76. Poland LNG Storage Tank Market Share (%), By Type, 2017-2031F
- Figure 77. Poland LNG Storage Tank Market Share (%), By Material, 2017-2031F
- Figure 78. Poland LNG Storage Tank Market Share (%), By End-use Industry, 2017-2031F
- Figure 79. South America LNG Storage Tank Market, By Value, in USD Billion, 2017-2031F
- Figure 80. South America LNG Storage Tank Market, By Volume, in Thousand Units, 2017-2031F
- Figure 81. South America LNG Storage Tank Market Share (%), By Type, 2017-2031F
- Figure 82. South America LNG Storage Tank Market Share (%), By Material, 2017-2031F
- Figure 83. South America LNG Storage Tank Market Share (%), By End-use Industry, 2017-2031F
- Figure 84. South America LNG Storage Tank Market Share (%), By Country, 2017-2031F
- Figure 85. Brazil LNG Storage Tank Market, By Value, in USD Billion, 2017-2031F
- Figure 86. Brazil LNG Storage Tank Market, By Volume, in Thousand Units, 2017-2031F
- Figure 87. Brazil LNG Storage Tank Market Share (%), By Type, 2017-2031F
- Figure 88. Brazil LNG Storage Tank Market Share (%), By Material, 2017-2031F
- Figure 89. Brazil LNG Storage Tank Market Share (%), By End-use Industry, 2017-2031F
- Figure 90. Argentina LNG Storage Tank Market, By Value, in USD Billion, 2017-2031F
- Figure 91. Argentina LNG Storage Tank Market, By Volume, in Thousand Units, 2017-2031F
- Figure 92. Argentina LNG Storage Tank Market Share (%), By Type, 2017-2031F
- Figure 93. Argentina LNG Storage Tank Market Share (%), By Material, 2017-2031F
- Figure 94. Argentina LNG Storage Tank Market Share (%), By End-use Industry, 2017-2031F
- Figure 95. Asia-Pacific LNG Storage Tank Market, By Value, in USD Billion, 2017-2031F
- Figure 96. Asia-Pacific LNG Storage Tank Market, By Volume, in Thousand Units, 2017-2031F
- Figure 97. Asia-Pacific LNG Storage Tank Market Share (%), By Type, 2017-2031F
- Figure 98. Asia-Pacific LNG Storage Tank Market Share (%), By Material, 2017-2031F
- Figure 99. Asia-Pacific LNG Storage Tank Market Share (%), By End-use Industry, 2017-2031F
- Figure 100. Asia-Pacific LNG Storage Tank Market Share (%), By Country, 2017-2031F
- Figure 101. India LNG Storage Tank Market, By Value, in USD Billion, 2017-2031F
- Figure 102. India LNG Storage Tank Market, By Volume, in Thousand Units, 2017-2031F
- Figure 103. India LNG Storage Tank Market Share (%), By Type, 2017-2031F
- Figure 104. India LNG Storage Tank Market Share (%), By Material, 2017-2031F
- Figure 105. India LNG Storage Tank Market Share (%), By End-use Industry, 2017-2031F
- Figure 106. China LNG Storage Tank Market, By Value, in USD Billion, 2017-2031F
- Figure 107. China LNG Storage Tank Market, By Volume, in Thousand Units, 2017-2031F
- Figure 108. China LNG Storage Tank Market Share (%), By Type, 2017-2031F
- Figure 109. China LNG Storage Tank Market Share (%), By Material, 2017-2031F
- Figure 110. China LNG Storage Tank Market Share (%), By End-use Industry, 2017-2031F
- Figure 111. Japan LNG Storage Tank Market, By Value, in USD Billion, 2017-2031F
- Figure 112. Japan LNG Storage Tank Market, By Volume, in Thousand Units, 2017-2031F
- Figure 113. Japan LNG Storage Tank Market Share (%), By Type, 2017-2031F
- Figure 114. Japan LNG Storage Tank Market Share (%), By Material, 2017-2031F
- Figure 115. Japan LNG Storage Tank Market Share (%), By End-use Industry, 2017-2031F
- Figure 116. Australia LNG Storage Tank Market, By Value, in USD Billion, 2017-2031F
- Figure 117. Australia LNG Storage Tank Market, By Volume, in Thousand Units, 2017-2031F
- Figure 118. Australia LNG Storage Tank Market Share (%), By Type, 2017-2031F
- Figure 119. Australia LNG Storage Tank Market Share (%), By Material, 2017-2031F
- Figure 120. Australia LNG Storage Tank Market Share (%), By End-use Industry, 2017-2031F
- Figure 121. Vietnam LNG Storage Tank Market, By Value, in USD Billion, 2017-2031F
- Figure 122. Vietnam LNG Storage Tank Market, By Volume, in Thousand Units, 2017-2031F
- Figure 123. Vietnam LNG Storage Tank Market Share (%), By Type, 2017-2031F
- Figure 124. Vietnam LNG Storage Tank Market Share (%), By Material, 2017-2031F
- Figure 125. Vietnam LNG Storage Tank Market Share (%), By End-use Industry, 2017-2031F
- Figure 126. South Korea LNG Storage Tank Market, By Value, in USD Billion, 2017-2031F
- Figure 127. South Korea LNG Storage Tank Market, By Volume, in Thousand Units, 2017-2031F
- Figure 128. South Korea LNG Storage Tank Market Share (%), By Type, 2017-2031F
- Figure 129. South Korea LNG Storage Tank Market Share (%), By Material, 2017-2031F
- Figure 130. South Korea LNG Storage Tank Market Share (%), By End-use Industry, 2017-2031F
- Figure 131. Indonesia LNG Storage Tank Market, By Value, in USD Billion, 2017-2031F
- Figure 132. Indonesia LNG Storage Tank Market, By Volume, in Thousand Units, 2017-2031F
- Figure 133. Indonesia LNG Storage Tank Market Share (%), By Type, 2017-2031F
- Figure 134. Indonesia LNG Storage Tank Market Share (%), By Material, 2017-2031F
- Figure 135. Indonesia LNG Storage Tank Market Share (%), By End-use Industry, 2017-2031F
- Figure 136. Philippines LNG Storage Tank Market, By Value, in USD Billion, 2017-2031F
- Figure 137. Philippines LNG Storage Tank Market, By Volume, in Thousand Units, 2017-2031F
- Figure 138. Philippines LNG Storage Tank Market Share (%), By Type, 2017-2031F
- Figure 139. Philippines LNG Storage Tank Market Share (%), By Material, 2017-2031F
- Figure 140. Philippines LNG Storage Tank Market Share (%), By End-use Industry, 2017-2031F
- Figure 141. Middle East & Africa LNG Storage Tank Market, By Value, in USD Billion, 2017-2031F
- Figure 142. Middle East & Africa LNG Storage Tank Market, By Volume, in Thousand Units, 2017-2031F
- Figure 143. Middle East & Africa LNG Storage Tank Market Share (%), By Type, 2017-2031F
- Figure 144. Middle East & Africa LNG Storage Tank Market Share (%), By Material, 2017-2031F
- Figure 145. Middle East & Africa LNG Storage Tank Market Share (%), By End-use Industry, 2017-2031F
- Figure 146. Middle East & Africa LNG Storage Tank Market Share (%), By Country, 2017-2031F
- Figure 147. Saudi Arabia LNG Storage Tank Market, By Value, in USD Billion, 2017-2031F
- Figure 148. Saudi Arabia LNG Storage Tank Market, By Volume, in Thousand Units, 2017-2031F
- Figure 149. Saudi Arabia LNG Storage Tank Market Share (%), By Type, 2017-2031F
- Figure 150. Saudi Arabia LNG Storage Tank Market Share (%), By Material, 2017-2031F
- Figure 151. Saudi Arabia LNG Storage Tank Market Share (%), By End-use Industry, 2017-2031F
- Figure 152. UAE LNG Storage Tank Market, By Value, in USD Billion, 2017-2031F
- Figure 153. UAE LNG Storage Tank Market, By Volume, in Thousand Units, 2017-2031F
- Figure 154. UAE LNG Storage Tank Market Share (%), By Type, 2017-2031F
- Figure 155. UAE LNG Storage Tank Market Share (%), By Material, 2017-2031F
- Figure 156. UAE LNG Storage Tank Market Share (%), By End-use Industry, 2017-2031F
- Figure 157. South Africa LNG Storage Tank Market, By Value, in USD Billion, 2017-2031F
- Figure 158. South Africa LNG Storage Tank Market, By Volume, in Thousand Units, 2017-2031F
- Figure 159. South Africa LNG Storage Tank Market Share (%), By Type, 2017-2031F
- Figure 160. South Africa LNG Storage Tank Market Share (%), By Material, 2017-2031F
- Figure 161. South Africa LNG Storage Tank Market Share (%), By End-use Industry, 2017-2031F
- Figure 162. By Type Map-Market Size (USD Billion) & Growth Rate (%), 2023
- Figure 163. By Material Map-Market Size (USD Billion) & Growth Rate (%), 2023
- Figure 164. By End-use Industry Map-Market Size (USD Billion) & Growth Rate (%), 2023
- Figure 165. By Region Map-Market Size (USD Billion) & Growth Rate (%), 2023
Global LNG storage tank market is projected to witness a CAGR of 8.06% during the forecast period 2024-2031, growing from USD 15.84 billion in 2023 to USD 29.45 billion in 2031. The market has experienced significant growth in recent years and is expected to maintain a strong pace of expansion in the coming years.
LNG storage tanks are highly efficient in the storage and transportation of natural gas. Moreover, LNG storage facilities offer several advantages, such as revolutionizing the energy sector by diversifying energy sources, enhancing grid stability, and reducing carbon emissions. They play a crucial role in facilitating energy security and ensuring a steady supply of LNG during disruptions in natural gas production, thus safeguarding against energy shortages and reducing dependence on the volatile fuel markets. Furthermore, the market growth is augmented by several factors like the increasing demand for LNG in various energy and steel end-use industries, the need for better LNG infrastructure, etc.
The need for proper LNG infrastructure is increasing due to surging global demand for LNG as regions with growing LNG demand seek supply from those with abundant resources. This urgency is intensified by the need to meet growing energy demand, declining domestic gas supply, and interruptions in piped gas supply.
For example, in September 2023, VINCI Construction Grands Projets, a subsidiary of VINCI Construction, was awarded a contract worth USD 175.22 million to construct a 180,000 m3 LNG tank in the Netherlands. The project is part of the expansion of the storage capacity and regasification of the GATE terminal in Rotterdam, which will possibly enable the supply of an additional 4 billion m3 of gas annually. The project incorporates the construction of a new LNG storage tank made with a nickel steel inner tank and a post-tensioned concrete outer container. It is anticipated to be completed by the second half of 2026.
Utilization Of Membrane Tanks is Amplifying the Market Growth
The utilization of membrane tanks is increasing in the LNG storage tank market due to their safety, flexibility, and cost-effectiveness. Membrane tanks are considered equal to 9% nickel steel full containment tanks in terms of safety and are being accepted by most of the large organizations. The membrane technology was initially designed for use on LNG tankers and is now being used for above-ground LNG storage tanks on land. Moreover, the membrane tank containment system is proven and safe, based on experience with LNG, LPG, and ethylene storage, and reduces losses while increasing delivered product.
For example, in January 2024, GTT received two orders for the tank design of two new Liquefied Natural Gas Carriers (LNGC). The first LNGC, with a total capacity of 174,000m3, will be constructed by the South Korean shipyard Hanwha Ocean and will feature the NO96 GW membrane containment system. The delivery of this vessel is scheduled for the third quarter of 2027. The second LNGC, also with a total capacity of 174,000 m3, will be built by the South Korean shipyard Samsung Heavy Industries and will incorporate GTT's Mark III Flex membrane containment system.
Moss tanks is Aiding the Market Expedition
Design developments in moss tanks, such as optimizing the tank shape and the emergence of new membrane types, are influencing the LNG storage tank market. These developments, including the introduction of new membrane solutions with different degrees of boil-off gas (BOG) performance, are enhancing the efficiency and performance of LNG carriers. Additionally, the use of independent tanks is gaining traction in the small and medium-sized LNG carrier sector, driven by the developing LNG bunkering market and the need for local redistribution.
For example, in December 2023, NYK Line, Namura Shipbuilding, and Sasebo Heavy Industries collaborated to replace the main propulsion on steam turbine-driven Moss-type LNG carriers with dual-fuel, low-speed diesel engines called X-DF engines. The Moss-type LNG tanks on these carriers are durable and can withstand long-term use, resulting in improved fuel economic performance and efficient use of the ship's resources.
Government Initiatives are Acting as Catalyst
Government initiatives and policies play a crucial role in shaping the growth of the LNG storage tank market. Governments especially in India are promoting the use of LNG by implementing initiatives to boost its adoption. Additionally, government support is essential for ensuring a steady supply of LNG, reduction in dependence on fuels, enhancing energy security, etc. thus influencing the growth prospects of the market.
For instance, in May 2023, the installation of LNG rundown lines by the United States government from the liquefaction area to the LNG storage tanks at the Lake Charles LNG facility is a significant development. This project, which involves the construction, commissioning, and installation of off-plot facilities, is a key component of the LNG infrastructure. The installation of these rundown lines is essential for the efficient and safe transfer of liquefied natural gas to the storage tanks, contributing to the overall functionality and operational readiness of the facility.
Transportation and Logistics Sector is Augmenting the Market Prospects
The Transportation and Logistics sector's increasing use of LNG as a fuel has significantly influenced the demand for LNG storage tanks. As LNG becomes the preferred fuel for shipping, the need for efficient and safe storage and transport has grown abruptly. This trend has bolstered the demand for LNG storage tanks, and the future outlook indicating robust prospects for LNG in various transportation sectors, is further driving the market prosperity.
For instance, in December 2023, Japan's shipping company NYK finalized a long-term contract for LNG transportation with China's state-controlled energy giant Sinopec. The contract, spanning up to 23 years, is set to commence in 2024 or later and involves the transport of LNG to China. This agreement adequately aligns with China's commitment to carbon neutrality and reflects the growing demand for LNG transportation services in the region, further strengthening NYK's position in the LNG shipping sector.
Asia-Pacific Significantly Spearheaded the Market
The Asia-Pacific region held the largest share in the LNG storage tank market, and it is projected to be the fastest-growing market for LNG storage tanks. The growth in the APAC region can be attributed to significant developments in power, energy, and technologies, plus the growing trade of LNG, which is expected to continue. The region's growing import of small-scale LNG, coupled with the growth in the Asia Pacific steel and metal industry, boosts the demand for LNG storage tanks in the region. Furthermore, the availability of natural gas reserves, efficiency, and low carbon footprint have further increased the use of LNG, thereby driving the market growth.
For example, in November 2023, China's largest LNG storage tank, independently designed, developed, and built by Sinopec, became operational at the Qingdao LNG receiving terminal. The 270,000 cubic meter tank, with a diameter of 100.6 meters and a height of 55 meters, would add 165 million cubic meters of storage capacity to meet the gas demand of 2.16 million households for five months during the winter season.
Future Market Scenario (2024 - 2031F)
The demand for LNG storage tanks is increasing due to the growing demand for LNG in various energy and steel end-use industries. This, in turn is expected to result in huge growth opportunities for the market in future.
The Middle East is expected to become an LNG consumer, driving the demand for LNG storage tanks. Furthermore, Asia Pacific is anticipated to be the fastest-growing market for LNG storage tanks, driven by a considerable increase in investments by regional governments in the energy sector.
The LNG storage tank market is highly competitive, with major players creating ample opportunities for future growth. The leading companies are various growth strategies, such as product launches, acquisitions, and collaborations, to remain prevalent in the market.
Key Players Landscape and Outlook
Key participants in the LNG storage tank market include: Sinopec, Linde Plc , McDermott International Inc., IHI Corporation, Wartsila, CIMC ENRIC, and Carbon Energy Group. These organizations are continuously investing in R&D and employing competitive strategies such as mergers, acquisitions, and agreements to strengthen their position in the rapidly changing market environment.
In November 2023, IHI Corporation, Japan's leading manufacturer of ammonia storage tanks, developed a technology for large-scale ammonia receiving terminals using large LNG storage tank. IHI and Royal Vopak signed a Memorandum of Understanding (MoU) to embark on a joint study regarding the development and operation of high-value-added ammonia terminals in Japan. The collaboration focused on large-scale ammonia storage terminals, strategically positioned for the economical distribution of ammonia, which plays an important role as a fuel for reducing carbon emissions from thermal power both in Japan and abroad.
In October 2023, Finnish maritime manufacturer Wartsila developed a new 25DF dual-fuel LNG engine, which will be used on two new sail-assisted cruise ships being built at the Chantiers de l'Atlantique, including the 220m-long Orient Express Silenseas, set to be the largest sailing ship in the world when it launches in 2026. The engine is described as the "most efficient" in its power range and supports the shipping industry's transition to greater fuel efficiency and reduced emissions.
Table of Contents
1. Research Methodology
2. Project Scope & Definitions
3. Executive Summary
4. Voice of Customer
- 4.1. Product and Market Intelligence
- 4.2. Factors Considered in Purchase Decisions
- 4.2.1. Price
- 4.2.2. Quality
- 4.2.3. Capacity
- 4.2.4. Durability
- 4.2.5. Compliance
- 4.2.6. Security and safety
- 4.2.7. Reliability
5. Global LNG Storage Tank Market Outlook, 2017-2031F
- 5.1. Market Size & Forecast
- 5.1.1. By Value
- 5.1.2. By Volume
- 5.2. By Type
- 5.2.1. Moss tanks (Spherical IMO type B LNG tanks)
- 5.2.2. Membrane Tanks
- 5.2.3. Self-supporting Prismatic shape IMO type B (SPB)
- 5.2.4. Others
- 5.3. By Material
- 5.3.1. Aluminum
- 5.3.2. Stainless Steel
- 5.3.3. Nickel steel (9%)
- 5.3.4. Others
- 5.4. By End-Use Industry
- 5.4.1. Energy and Power
- 5.4.2. Metal Processing
- 5.4.3. Transportation and Logistics
- 5.4.4. Others
- 5.5. By Region
- 5.5.1. North America
- 5.5.2. Europe
- 5.5.3. Asia-Pacific
- 5.5.4. South America
- 5.5.5. Middle East and Africa
- 5.6. By Company Market Share (%), 2023
6. Global LNG Storage Tank Market Outlook, By Region, 2017-2031F
- 6.1. North America*
- 6.1.1. Market Size & Forecast
- 6.1.1.1. By Value
- 6.1.1.2. By Volume
- 6.1.2. By Type
- 6.1.2.1. Moss tanks (Spherical IMO type B LNG tanks)
- 6.1.2.2. Membrane Tanks
- 6.1.2.3. Self-supporting Prismatic shape IMO type B (SPB)
- 6.1.2.4. Others
- 6.1.3. By Material
- 6.1.3.1. Aluminum
- 6.1.3.2. Stainless Steel
- 6.1.3.3. Nickel steel (9%)
- 6.1.3.4. Others
- 6.1.4. By End-Use Industry
- 6.1.4.1. Energy and Power
- 6.1.4.2. Metal Processing
- 6.1.4.3. Transportation and Logistics
- 6.1.4.4. Others
- 6.1.5. United States*
- 6.1.5.1. Market Size & Forecast
- 6.1.5.1.1. By Value
- 6.1.5.1.2. By Volume
- 6.1.5.2. By Type
- 6.1.5.2.1. Moss tanks (Spherical IMO type B LNG tanks)
- 6.1.5.2.2. Membrane Tanks
- 6.1.5.2.3. Self-supporting Prismatic shape IMO type B (SPB)
- 6.1.5.2.4. Others
- 6.1.5.3. By Material
- 6.1.5.3.1. Aluminum
- 6.1.5.3.2. Stainless Steel
- 6.1.5.3.3. Nickel steel (9%)
- 6.1.5.3.4. Others
- 6.1.5.4. By End-Use Industry
- 6.1.5.4.1. Energy and Power
- 6.1.5.4.2. Metal Processing
- 6.1.5.4.3. Transportation and Logistics
- 6.1.5.4.4. Others
- 6.1.6. Canada
- 6.1.7. Mexico
- 6.1.1. Market Size & Forecast
All segments will be provided for all regions and countries covered:
- 6.2. Europe
- 6.2.1. Germany
- 6.2.2. France
- 6.2.3. Italy
- 6.2.4. United Kingdom
- 6.2.5. Russia
- 6.2.6. Netherlands
- 6.2.7. Spain
- 6.2.8. Turkey
- 6.2.9. Poland
- 6.3. Asia-Pacific
- 6.3.1. India
- 6.3.2. China
- 6.3.3. Japan
- 6.3.4. Australia
- 6.3.5. Vietnam
- 6.3.6. South Korea
- 6.3.7. Indonesia
- 6.3.8. Philippines
- 6.4. South America
- 6.4.1. Brazil
- 6.4.2. Argentina
- 6.5. Middle East & Africa
- 6.5.1. Saudi Arabia
- 6.5.2. UAE
- 6.5.3. South Africa
7. Market Mapping, 2023
- 7.1. By Type
- 7.2. By Material
- 7.3. By End-Use Industry
- 7.4. By Region
8. Macro Environment and Industry Structure
- 8.1. Demand Supply Analysis
- 8.2. Import Export Analysis
- 8.3. Value Chain Analysis
- 8.4. PESTEL Analysis
- 8.4.1. Political Factors
- 8.4.2. Economic System
- 8.4.3. Social Implications
- 8.4.4. Technological Advancements
- 8.4.5. Environmental Impacts
- 8.4.6. Legal Compliances and Regulatory Policies (Statutory Bodies Included)
- 8.5. Porter's Five Forces Analysis
- 8.5.1. Supplier Power
- 8.5.2. Buyer Power
- 8.5.3. Substitution Threat
- 8.5.4. Threat from New Entrant
- 8.5.5. Competitive Rivalry
9. Market Dynamics
- 9.1. Growth Drivers
- 9.2. Growth Inhibitors (Challenges and Restraints)
10. Key Players Landscape
- 10.1. Competition Matrix of Top Five Market Leaders
- 10.2. Market Revenue Analysis of Top Five Market Leaders (in %, 2023)
- 10.3. Mergers and Acquisitions/Joint Ventures (If Applicable)
- 10.4. SWOT Analysis (For Five Market Players)
- 10.5. Patent Analysis (If Applicable)
11. Case Studies
12. Key Players Outlook
- 12.1. Sinopec
- 12.1.1. Company Details
- 12.1.2. Key Management Personnel
- 12.1.3. Products & Services
- 12.1.4. Financials (As reported)
- 12.1.5. Key Market Focus & Geographical Presence
- 12.1.6. Recent Developments
- 12.2. Linde Plc
- 12.3. McDermott International Inc.
- 12.4. IHI Corporation
- 12.5. Wartsila
- 12.6. CIMC ENRIC
- 12.7. Carbon Energy Group
- 12.8. Qatargas
- 12.9. ExxonMobil
- 12.10. Cryolor
Companies mentioned above DO NOT hold any order as per market share and can be changed as per information available during research work.
