|
|
市場調査レポート
商品コード
1419600
電気自動車用コネクタの世界市場の評価:コネクタタイプ別、電流タイプ別、充電速度別、取り付けタイプ別、エンドユーザー別、地域別、機会、予測(2017年~2031年)Electric Vehicle Connector Market Assessment, By Connector Type, By Current Type, By Charging Speed, By Mounting Type, By End-user, By Region, Opportunities and Forecast, 2017-2031F |
||||||

|
|||||||
カスタマイズ可能
|
|||||||

| 電気自動車用コネクタの世界市場の評価:コネクタタイプ別、電流タイプ別、充電速度別、取り付けタイプ別、エンドユーザー別、地域別、機会、予測(2017年~2031年) |
|
出版日: 2024年02月01日
発行: Markets & Data
ページ情報: 英文 250 Pages
納期: 3~5営業日
|

全表示
- 概要
- 図表
- 目次
世界の電気自動車用コネクタの市場規模は、2023年に7,548万米ドル、2031年に3億2,563万米ドルに達し、2024年~2031年の予測期間にCAGRで20.05%の成長が見込まれています。世界の電気自動車用コネクタ市場は、世界の電気自動車の採用の拡大により、急成長を示しています。持続可能な輸送への移行とクリーンエネルギーを推進する政府の取り組みが電気自動車の需要を促進し、電気自動車用コネクタ市場を後押ししています。厳しい排ガス規制と消費者の環境意識の高まりは、この市場を前進させる重大な要因です。自動車メーカーが電動モビリティに多額の投資を続ける中、信頼性が高く効率的な充電インフラの必要性が最重要となり、先進のEV用コネクタの需要を促進しています。EVコネクタ市場の革新は、充電ソリューションの高速化、安全機能の強化、異なる充電規格間の互換性への注目が特徴です。
短時間で大量のエネルギーを供給できる超急速充電器のような高出力充電技術の登場は、EVユーザーにとって重要な関心事である充電時間に対処するものです。さらに、スマート充電や無線充電技術が脚光を浴び、ユーザーにさらなる利便性を提供しています。先進材料の統合と設計の強化は、コネクタの耐久性と効率性の向上を目指しています。自動車メーカーと充電インフラプロバイダーの協力により相互運用性が促進され、世界中の電気自動車ユーザーにシームレスな充電体験を提供しています。全体として電気自動車用コネクタ市場は、急成長する電動モビリティ部門の進化するニーズに対応するため、急速に進化しています。例えば、StarbucksはVolvoと提携し、コロラド州、ユタ州、アイダホ州、オレゴン州、デンバーからシアトルまでのStarbucks15店舗に50基のDC急速充電ステーションを開設しました。この充電ステーションは、VolvoのC40 Rechargeを含む、CCS1またはCHAdeMOコネクタを備えた電気自動車を充電することができます。
充電ネットワークへの投資の増加
世界の電気自動車用コネクタ市場は、主要企業による充電ネットワークへの投資の増加により、大幅な盛り上がりを見せています。電動モビリティの推進における充電インフラの極めて重要な役割を認識し、Teslaなどの主要企業や充電ネットワーク事業者は、充電ネットワークの拡大と強化に多大なリソースを割いています。こうした戦略的投資は、航続距離の不安に対処しEVの普及を促進するために、充電ステーション、特に急速充電ステーションをより多く展開することに重点を置いています。自動車メーカーと充電インフラプロバイダーの提携は、相互運用性とシームレスな充電体験を促進し、この動向をさらに加速させています。包括的な充電ネットワークの構築に対するこの強固なコミットメントは、世界の電気自動車の成長とアクセシビリティをサポートする主要企業の貢献を示しています。
電気自動車用コネクタの技術の進歩
継続的な革新が主要課題に対処し全体的な効率を高めることから、技術の進歩が市場を前進させます。材料と設計の進歩は、より耐久性と耐熱性のあるコネクタの開発に寄与しています。高出力充電技術は急速に進化しており、充電時間の短縮を可能にし、EVユーザーの重大な懸念に対処しています。通信プロトコルや無線接続などのスマート機能の統合は、ユーザーエクスペリエンスを向上させ、充電インフラとのシームレスな相互作用を可能にします。さらに、進行中の研究開発では、さまざまな充電規格と互換性のあるコネクタの作成が重視され、相互運用性と柔軟性を促進しています。例えば、SEVD(TM)-V3は、V2X(Vehicle-to-Everything)用途向けに特別に設計されたEVのDC充電器/放電器向けコネクタ付きケーブルです。これは、EVとV2H(Vehicle-to-Home)用途向けのDC急速充電器の主要部分であるV2Xコネクタです。SEVD(TM)-V3は、小型かつ軽量で安全なEV用コネクタケーブルアセンブリであり、効率的で安全な充電ソリューションの実現に寄与することを目指しています。
当レポートでは、世界の電気自動車用コネクタ市場について調査分析し、市場規模と予測、市場力学、主要企業情勢と見通しなどを提供しています。
目次
第1章 調査手法
第2章 プロジェクトの範囲と定義
第3章 エグゼクティブサマリー
第4章 顧客の声
- 品質、性能
- 持続可能性と環境に対する影響
- コスト
- 規制当局の承認と安全性
- 革新
- 用途との適合性
- 航続距離、バッテリー技術
- サプライチェーン、可用性
- ブランドの評判、信頼
- アフターサービス、サポート
第5章 世界の電気自動車用コネクタ市場の見通し(2017年~2031年)
- 市場規模と予測
- 金額
- 数量
- コネクタタイプ別
- Type 1
- CCS
- Chademo
- その他
- 電流タイプ別
- 交流
- 直流
- 充電速度別
- 低速
- 高速
- 急速
- 取り付けタイプ別
- 床置き型
- 壁掛け型
- エンドユーザー別
- 住宅
- 商業
- 地域別
- 北米
- 欧州
- 南米
- アジア太平洋
- 中東・アフリカ
- 市場シェア:企業別(2023年)
第6章 世界の電気自動車用コネクタ市場の見通し:地域別(2017年~2031年)
- 北米
- 市場規模と予測
- コネクタタイプ別
- 電流タイプ別
- 充電速度別
- 取り付けタイプ別
- エンドユーザー別
- 米国
- カナダ
- メキシコ
- 欧州
- ドイツ
- フランス
- イタリア
- 英国
- ロシア
- オランダ
- スペイン
- 南米
- ブラジル
- アルゼンチン
- アジア太平洋
- インド
- 中国
- 日本
- オーストラリア
- 韓国
- 中東・アフリカ
- サウジアラビア
- アラブ首長国連邦
- 南アフリカ
第7章 市場マッピング(2023年)
- コネクタタイプ別
- 電流タイプ別
- 充電速度別
- 取り付けタイプ別
- エンドユーザー別
- 地域別
第8章 マクロ環境と産業構造
- 需給分析
- 輸出入の分析
- バリューチェーン分析
- PESTEL分析
- ポーターのファイブフォース分析
第9章 市場力学
- 成長促進要因
- 成長抑制要因(課題、抑制要因)
第10章 主要企業情勢
- マーケットリーダー上位5社の競合マトリクス
- マーケットリーダー上位5社の市場収益分析(2023年)
- 合併と買収/合弁事業(該当する場合)
- SWOT分析(市場参入企業5社)
- 特許分析(該当する場合)
第11章 価格分析
第12章 ケーススタディ
第13章 主要企業の見通し
- Aptiv PLC
- Fujikura Ltd.
- Tyco Electronics Ltd.
- Sumitomo Electric Industries Ltd.
- HUBER+SUHNER Electronics Private Limited.
- Tesla, Inc.
- Siemens AG
- Besen International Group Co., Ltd.
- Harting Stiftung & Co. KG
- Weidmuller Interface GmbH & Co. KG.
第14章 戦略的推奨事項
第15章 当社について、免責事項
List of Tables
- Table 1. Pricing Analysis of Products from Key Players
- Table 2. Competition Matrix of Top 5 Market Leaders
- Table 3. Mergers & Acquisitions/ Joint Ventures (If Applicable)
- Table 4. About Us - Regions and Countries Where We Have Executed Client Projects
List of Figures
- Figure 1. Global Electric Vehicle Connector Market, By Value, In USD Million, 2017-2031F
- Figure 2. Global Electric Vehicle Connector Market, By Volume, In Thousand Units, 2017-2031F
- Figure 3. Global Electric Vehicle Connector Market Share (%), By Connector Type, 2017-2031F
- Figure 4. Global Electric Vehicle Connector Market Share (%), By Current Type, 2017-2031F
- Figure 5. Global Electric Vehicle Connector Market Share (%), By Charging Speed, 2017-2031F
- Figure 6. Global Electric Vehicle Connector Market Share (%), By Mounting Type, 2017-2031F
- Figure 7. Global Electric Vehicle Connector Market Share (%), By End-user, 2017-2031F
- Figure 8. Global Electric Vehicle Connector Market Share (%), By Region, 2017-2031F
- Figure 9. North America Electric Vehicle Connector Market, By Value, In USD Million, 2017-2031F
- Figure 10. North America Electric Vehicle Connector Market, By Volume, In Thousand Units, 2017-2031F
- Figure 11. North America Electric Vehicle Connector Market Share (%), By Connector Type, 2017-2031F
- Figure 12. North America Electric Vehicle Connector Market Share (%), By Current Type, 2017-2031F
- Figure 13. North America Electric Vehicle Connector Market Share (%), By Charging Speed, 2017-2031F
- Figure 14. North America Electric Vehicle Connector Market Share (%), By Mounting Type, 2017-2031F
- Figure 15. North America Electric Vehicle Connector Market Share (%), By End-user, 2017-2031F
- Figure 16. North America Electric Vehicle Connector Market Share (%), By Country, 2017-2031F
- Figure 17. United States Electric Vehicle Connector Market, By Value, In USD Million, 2017-2031F
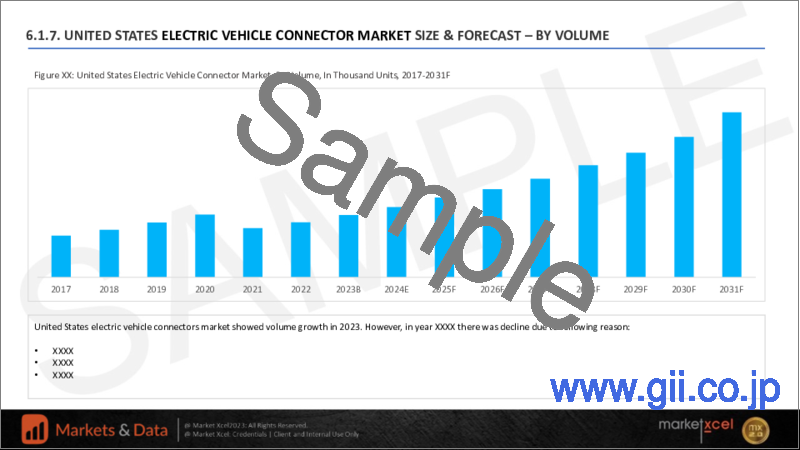
- Figure 18. United States Electric Vehicle Connector Market, By Volume, In Thousand Units, 2017-2031F
- Figure 19. United States Electric Vehicle Connector Market Share (%), By Connector Type, 2017-2031F
- Figure 20. United States Electric Vehicle Connector Market Share (%), By Current Type, 2017-2031F
- Figure 21. United States Electric Vehicle Connector Market Share (%), By Charging Speed, 2017-2031F
- Figure 22. United States Electric Vehicle Connector Market Share (%), By Mounting Type, 2017-2031F
- Figure 23. United States Electric Vehicle Connector Market Share (%), By End-user, 2017-2031F
- Figure 24. Canada Electric Vehicle Connector Market, By Value, In USD Million, 2017-2031F
- Figure 25. Canada Electric Vehicle Connector Market, By Volume, In Thousand Units, 2017-2031F
- Figure 26. Canada Electric Vehicle Connector Market Share (%), By Connector Type, 2017-2031F
- Figure 27. Canada Electric Vehicle Connector Market Share (%), By Current Type, 2017-2031F
- Figure 28. Canada Electric Vehicle Connector Market Share (%), By Charging Speed, 2017-2031F
- Figure 29. Canada Electric Vehicle Connector Market Share (%), By Mounting Type, 2017-2031F
- Figure 30. Canada Electric Vehicle Connector Market Share (%), By End-user, 2017-2031F
- Figure 31. Mexico Electric Vehicle Connector Market, By Value, In USD Million, 2017-2031F
- Figure 32. Mexico Electric Vehicle Connector Market, By Volume, In Thousand Units, 2017-2031F
- Figure 33. Mexico Electric Vehicle Connector Market Share (%), By Connector Type, 2017-2031F
- Figure 34. Mexico Electric Vehicle Connector Market Share (%), By Current Type, 2017-2031F
- Figure 35. Mexico Electric Vehicle Connector Market Share (%), By Charging Speed, 2017-2031F
- Figure 36. Mexico Electric Vehicle Connector Market Share (%), By Mounting Type, 2017-2031F
- Figure 37. Mexico Electric Vehicle Connector Market Share (%), By End-user, 2017-2031F
- Figure 38. Europe Electric Vehicle Connector Market, By Value, In USD Million, 2017-2031F
- Figure 39. Europe Electric Vehicle Connector Market, By Volume, In Thousand Units, 2017-2031F
- Figure 40. Europe Electric Vehicle Connector Market Share (%), By Connector Type, 2017-2031F
- Figure 41. Europe Electric Vehicle Connector Market Share (%), By Current Type, 2017-2031F
- Figure 42. Europe Electric Vehicle Connector Market Share (%), By Charging Speed, 2017-2031F
- Figure 43. Europe Electric Vehicle Connector Market Share (%), By Mounting Type, 2017-2031F
- Figure 44. Europe Electric Vehicle Connector Market Share (%), By End-user, 2017-2031F
- Figure 45. Europe Electric Vehicle Connector Market Share (%), By Country, 2017-2031F
- Figure 46. Germany Electric Vehicle Connector Market, By Value, In USD Million, 2017-2031F
- Figure 47. Germany Electric Vehicle Connector Market, By Volume, In Thousand Units, 2017-2031F
- Figure 48. Germany Electric Vehicle Connector Market Share (%), By Connector Type, 2017-2031F
- Figure 49. Germany Electric Vehicle Connector Market Share (%), By Current Type, 2017-2031F
- Figure 50. Germany Electric Vehicle Connector Market Share (%), By Charging Speed, 2017-2031F
- Figure 51. Germany Electric Vehicle Connector Market Share (%), By Mounting Type, 2017-2031F
- Figure 52. Germany Electric Vehicle Connector Market Share (%), By End-user, 2017-2031F
- Figure 53. France Electric Vehicle Connector Market, By Value, In USD Million, 2017-2031F
- Figure 54. France Electric Vehicle Connector Market, By Volume, In Thousand Units, 2017-2031F
- Figure 55. France Electric Vehicle Connector Market Share (%), By Connector Type, 2017-2031F
- Figure 56. France Electric Vehicle Connector Market Share (%), By Current Type, 2017-2031F
- Figure 57. France Electric Vehicle Connector Market Share (%), By Charging Speed, 2017-2031F
- Figure 58. France Electric Vehicle Connector Market Share (%), By Mounting Type, 2017-2031F
- Figure 59. France Electric Vehicle Connector Market Share (%), By End-user, 2017-2031F
- Figure 60. Italy Electric Vehicle Connector Market, By Value, In USD Million, 2017-2031F
- Figure 61. Italy Electric Vehicle Connector Market, By Volume, In Thousand Units, 2017-2031F
- Figure 62. Italy Electric Vehicle Connector Market Share (%), By Connector Type, 2017-2031F
- Figure 63. Italy Electric Vehicle Connector Market Share (%), By Current Type, 2017-2031F
- Figure 64. Italy Electric Vehicle Connector Market Share (%), By Charging Speed, 2017-2031F
- Figure 65. Italy Electric Vehicle Connector Market Share (%), By Mounting Type, 2017-2031F
- Figure 66. Italy Electric Vehicle Connector Market Share (%), By End-user, 2017-2031F
- Figure 67. United Kingdom Electric Vehicle Connector Market, By Value, In USD Million, 2017-2031F
- Figure 68. United Kingdom Electric Vehicle Connector Market, By Volume, In Thousand Units, 2017-2031F
- Figure 69. United Kingdom Electric Vehicle Connector Market Share (%), By Connector Type, 2017-2031F
- Figure 70. United Kingdom Electric Vehicle Connector Market Share (%), By Current Type, 2017-2031F
- Figure 71. United Kingdom Electric Vehicle Connector Market Share (%), By Charging Speed, 2017-2031F
- Figure 72. United Kingdom Electric Vehicle Connector Market Share (%), By Mounting Type, 2017-2031F
- Figure 73. United Kingdom Electric Vehicle Connector Market Share (%), By End-user, 2017-2031F
- Figure 74. Russia Electric Vehicle Connector Market, By Value, In USD Million, 2017-2031F
- Figure 75. Russia Electric Vehicle Connector Market, By Volume, In Thousand Units, 2017-2031F
- Figure 76. Russia Electric Vehicle Connector Market Share (%), By Connector Type, 2017-2031F
- Figure 77. Russia Electric Vehicle Connector Market Share (%), By Current Type, 2017-2031F
- Figure 78. Russia Electric Vehicle Connector Market Share (%), By Charging Speed, 2017-2031F
- Figure 79. Russia Electric Vehicle Connector Market Share (%), By Mounting Type, 2017-2031F
- Figure 80. Russia Electric Vehicle Connector Market Share (%), By End-user, 2017-2031F
- Figure 81. Netherlands Electric Vehicle Connector Market, By Value, In USD Million, 2017-2031F
- Figure 82. Netherlands Electric Vehicle Connector Market, By Volume, In Thousand Units, 2017-2031F
- Figure 83. Netherlands Electric Vehicle Connector Market Share (%), By Connector Type, 2017-2031F
- Figure 84. Netherlands Electric Vehicle Connector Market Share (%), By Current Type, 2017-2031F
- Figure 85. Netherlands Electric Vehicle Connector Market Share (%), By Charging Speed, 2017-2031F
- Figure 86. Netherlands Electric Vehicle Connector Market Share (%), By Mounting Type, 2017-2031F
- Figure 87. Netherlands Electric Vehicle Connector Market Share (%), By End-user, 2017-2031F
- Figure 88. Spain Electric Vehicle Connector Market, By Value, In USD Million, 2017-2031F
- Figure 89. Spain Electric Vehicle Connector Market, By Volume, In Thousand Units, 2017-2031F
- Figure 90. Spain Electric Vehicle Connector Market Share (%), By Connector Type, 2017-2031F
- Figure 91. Spain Electric Vehicle Connector Market Share (%), By Current Type, 2017-2031F
- Figure 92. Spain Electric Vehicle Connector Market Share (%), By Charging Speed, 2017-2031F
- Figure 93. Spain Electric Vehicle Connector Market Share (%), By Mounting Type, 2017-2031F
- Figure 94. Spain Electric Vehicle Connector Market Share (%), By End-user, 2017-2031F
- Figure 95. Turkey Electric Vehicle Connector Market, By Value, In USD Million, 2017-2031F
- Figure 96. Turkey Electric Vehicle Connector Market, By Volume, In Thousand Units, 2017-2031F
- Figure 97. Turkey Electric Vehicle Connector Market Share (%), By Connector Type, 2017-2031F
- Figure 98. Turkey Electric Vehicle Connector Market Share (%), By Current Type, 2017-2031F
- Figure 99. Turkey Electric Vehicle Connector Market Share (%), By Charging Speed, 2017-2031F
- Figure 100. Turkey Electric Vehicle Connector Market Share (%), By Mounting Type, 2017-2031F
- Figure 101. Turkey Electric Vehicle Connector Market Share (%), By End-user, 2017-2031F
- Figure 102. Poland Electric Vehicle Connector Market, By Value, In USD Million, 2017-2031F
- Figure 103. Poland Electric Vehicle Connector Market, By Volume, In Thousand Units, 2017-2031F
- Figure 104. Poland Electric Vehicle Connector Market Share (%), By Connector Type, 2017-2031F
- Figure 105. Poland Electric Vehicle Connector Market Share (%), By Current Type, 2017-2031F
- Figure 106. Poland Electric Vehicle Connector Market Share (%), By Charging Speed, 2017-2031F
- Figure 107. Poland Electric Vehicle Connector Market Share (%), By Mounting Type, 2017-2031F
- Figure 108. Poland Electric Vehicle Connector Market Share (%), By End-user, 2017-2031F
- Figure 109. South America Electric Vehicle Connector Market, By Value, In USD Million, 2017-2031F
- Figure 110. South America Electric Vehicle Connector Market, By Volume, In Thousand Units, 2017-2031F
- Figure 111. South America Electric Vehicle Connector Market Share (%), By Connector Type, 2017-2031F
- Figure 112. South America Electric Vehicle Connector Market Share (%), By Current Type, 2017-2031F
- Figure 113. South America Electric Vehicle Connector Market Share (%), By Charging Speed, 2017-2031F
- Figure 114. South America Electric Vehicle Connector Market Share (%), By Mounting Type, 2017-2031F
- Figure 115. South America Electric Vehicle Connector Market Share (%), By End-user, 2017-2031F
- Figure 116. South America Electric Vehicle Connector Market Share (%), By Country, 2017-2031F
- Figure 117. Brazil Electric Vehicle Connector Market, By Value, In USD Million, 2017-2031F
- Figure 118. Brazil Electric Vehicle Connector Market, By Volume, In Thousand Units, 2017-2031F
- Figure 119. Brazil Electric Vehicle Connector Market Share (%), By Connector Type, 2017-2031F
- Figure 120. Brazil Electric Vehicle Connector Market Share (%), By Current Type, 2017-2031F
- Figure 121. Brazil Electric Vehicle Connector Market Share (%), By Charging Speed, 2017-2031F
- Figure 122. Brazil Electric Vehicle Connector Market Share (%), By Mounting Type, 2017-2031F
- Figure 123. Brazil Electric Vehicle Connector Market Share (%), By End-user, 2017-2031F
- Figure 124. Argentina Electric Vehicle Connector Market, By Value, In USD Million, 2017-2031F
- Figure 125. Argentina Electric Vehicle Connector Market, By Volume, In Thousand Units, 2017-2031F
- Figure 126. Argentina Electric Vehicle Connector Market Share (%), By Connector Type, 2017-2031F
- Figure 127. Argentina Electric Vehicle Connector Market Share (%), By Current Type, 2017-2031F
- Figure 128. Argentina Electric Vehicle Connector Market Share (%), By Charging Speed, 2017-2031F
- Figure 129. Argentina Electric Vehicle Connector Market Share (%), By Mounting Type, 2017-2031F
- Figure 130. Argentina Electric Vehicle Connector Market Share (%), By End-user, 2017-2031F
- Figure 131. Asia-Pacific Electric Vehicle Connector Market, By Value, In USD Million, 2017-2031F
- Figure 132. Asia-Pacific Electric Vehicle Connector Market, By Volume, In Thousand Units, 2017-2031F
- Figure 133. Asia-Pacific Electric Vehicle Connector Market Share (%), By Connector Type, 2017-2031F
- Figure 134. Asia-Pacific Electric Vehicle Connector Market Share (%), By Current Type, 2017-2031F
- Figure 135. Asia-Pacific Electric Vehicle Connector Market Share (%), By Charging Speed, 2017-2031F
- Figure 136. Asia-Pacific Electric Vehicle Connector Market Share (%), By Mounting Type, 2017-2031F
- Figure 137. Asia- Pacific Electric Vehicle Connector Market Share (%), By End-user, 2017-2031F
- Figure 138. Asia-Pacific Electric Vehicle Connector Market Share (%), By Country, 2017-2031F
- Figure 139. India Electric Vehicle Connector Market, By Value, In USD Million, 2017-2031F
- Figure 140. India Electric Vehicle Connector Market, By Volume, In Thousand Units, 2017-2031F
- Figure 141. India Electric Vehicle Connector Market Share (%), By Connector Type, 2017-2031F
- Figure 142. India Electric Vehicle Connector Market Share (%), By Current Type, 2017-2031F
- Figure 143. India Electric Vehicle Connector Market Share (%), By Charging Speed, 2017-2031F
- Figure 144. India Electric Vehicle Connector Market Share (%), By Mounting Type, 2017-2031F
- Figure 145. India Electric Vehicle Connector Market Share (%), By End-user, 2017-2031F
- Figure 146. China Electric Vehicle Connector Market, By Value, In USD Million, 2017-2031F
- Figure 147. China Electric Vehicle Connector Market, By Volume, In Thousand Units, 2017-2031F
- Figure 148. China Electric Vehicle Connector Market Share (%), By Connector Type, 2017-2031F
- Figure 149. China Electric Vehicle Connector Market Share (%), By Current Type, 2017-2031F
- Figure 150. China Electric Vehicle Connector Market Share (%), By Charging Speed, 2017-2031F
- Figure 151. China Electric Vehicle Connector Market Share (%), By Mounting Type, 2017-2031F
- Figure 152. China Electric Vehicle Connector Market Share (%), By End-user, 2017-2031F
- Figure 153. Japan Electric Vehicle Connector Market, By Value, In USD Million, 2017-2031F
- Figure 154. Japan Electric Vehicle Connector Market, By Volume, In Thousand Units, 2017-2031F
- Figure 155. Japan Electric Vehicle Connector Market Share (%), By Connector Type, 2017-2031F
- Figure 156. Japan Electric Vehicle Connector Market Share (%), By Current Type, 2017-2031F
- Figure 157. Japan Electric Vehicle Connector Market Share (%), By Charging Speed, 2017-2031F
- Figure 158. Japan Electric Vehicle Connector Market Share (%), By Mounting Type, 2017-2031F
- Figure 159. Japan Electric Vehicle Connector Market Share (%), By End-user, 2017-2031F
- Figure 160. Australia Electric Vehicle Connector Market, By Value, In USD Million, 2017-2031F
- Figure 161. Australia Electric Vehicle Connector Market, By Volume, In Thousand Units, 2017-2031F
- Figure 162. Australia Electric Vehicle Connector Market Share (%), By Connector Type, 2017-2031F
- Figure 163. Australia Electric Vehicle Connector Market Share (%), By Current Type, 2017-2031F
- Figure 164. Australia Electric Vehicle Connector Market Share (%), By Charging Speed, 2017-2031F
- Figure 165. Australia Electric Vehicle Connector Market Share (%), By Mounting Type, 2017-2031F
- Figure 166. Australia Electric Vehicle Connector Market Share (%), By End-user, 2017-2031F
- Figure 167. Vietnam Electric Vehicle Connector Market, By Value, In USD Million, 2017-2031F
- Figure 168. Vietnam Electric Vehicle Connector Market, By Volume, In Thousand Units, 2017-2031F
- Figure 169. Vietnam Electric Vehicle Connector Market Share (%), By Connector Type, 2017-2031F
- Figure 170. Vietnam Electric Vehicle Connector Market Share (%), By Current Type, 2017-2031F
- Figure 171. Vietnam Electric Vehicle Connector Market Share (%), By Charging Speed, 2017-2031F
- Figure 172. Vietnam Electric Vehicle Connector Market Share (%), By Mounting Type, 2017-2031F
- Figure 173. Vietnam Electric Vehicle Connector Market Share (%), By End-user, 2017-2031F
- Figure 174. South Korea Electric Vehicle Connector Market, By Value, In USD Million, 2017-2031F
- Figure 175. South Korea Electric Vehicle Connector Market, By Volume, In Thousand Units, 2017-2031F
- Figure 176. South Korea Electric Vehicle Connector Market Share (%), By Connector Type, 2017-2031F
- Figure 177. South Korea Electric Vehicle Connector Market Share (%), By Current Type, 2017-2031F
- Figure 178. South Korea Electric Vehicle Connector Market Share (%), By Charging Speed, 2017-2031F
- Figure 179. South Korea Electric Vehicle Connector Market Share (%), By Mounting Type, 2017-2031F
- Figure 180. South Korea Electric Vehicle Connector Market Share (%), By End-user, 2017-2031F
- Figure 181. Indonesia Electric Vehicle Connector Market, By Value, In USD Million, 2017-2031F
- Figure 182. Indonesia Electric Vehicle Connector Market, By Volume, In Thousand Units, 2017-2031F
- Figure 183. Indonesia Electric Vehicle Connector Market Share (%), By Connector Type, 2017-2031F
- Figure 184. Indonesia Electric Vehicle Connector Market Share (%), By Current Type, 2017-2031F
- Figure 185. Indonesia Electric Vehicle Connector Market Share (%), By Charging Speed, 2017-2031F
- Figure 186. Indonesia Electric Vehicle Connector Market Share (%), By Mounting Type, 2017-2031F
- Figure 187. Indonesia Electric Vehicle Connector Market Share (%), By End-user, 2017-2031F
- Figure 188. Philippines Electric Vehicle Connector Market, By Value, In USD Million, 2017-2031F
- Figure 189. Philippines Electric Vehicle Connector Market, By Volume, In Thousand Units, 2017-2031F
- Figure 190. Philippines Electric Vehicle Connector Market Share (%), By Connector Type, 2017-2031F
- Figure 191. Philippines Electric Vehicle Connector Market Share (%), By Current Type, 2017-2031F
- Figure 192. Philippines Electric Vehicle Connector Market Share (%), By Charging Speed, 2017-2031F
- Figure 193. Philippines Electric Vehicle Connector Market Share (%), By Mounting Type, 2017-2031F
- Figure 194. Philippines Electric Vehicle Connector Market Share (%), By End-user, 2017-2031F
- Figure 195. Middle East & Africa Electric Vehicle Connector Market, By Value, In USD Million, 2017-2031F
- Figure 196. Middle East & Africa Electric Vehicle Connector Market, By Volume, In Thousand Units, 2017-2031F
- Figure 197. Middle East & Africa Electric Vehicle Connector Market Share (%), By Connector Type, 2017-2031F
- Figure 198. Middle East & Africa Electric Vehicle Connector Market Share (%), By Current Type, 2017-2031F
- Figure 199. Middle East & Africa Electric Vehicle Connector Market Share (%), By Charging Speed, 2017-2031F
- Figure 200. Middle East & Africa Electric Vehicle Connector Market Share (%), By Mounting Type, 2017-2031F
- Figure 201. Middle East & Africa Electric Vehicle Connector Market Share (%), By End-user, 2017-2031F
- Figure 202. Middle East & Africa Electric Vehicle Connector Market Share (%), By Country, 2017-2031F
- Figure 203. Saudi Arabia Electric Vehicle Connector Market, By Value, In USD Million, 2017-2031F
- Figure 204. Saudi Arabia Electric Vehicle Connector Market, By Volume, In Thousand Units, 2017-2031F
- Figure 205. Saudi Arabia Electric Vehicle Connector Market Share (%), By Connector Type, 2017-2031F
- Figure 206. Saudi Arabia Electric Vehicle Connector Market Share (%), By Current Type, 2017-2031F
- Figure 207. Saudi Arabia Electric Vehicle Connector Market Share (%), By Charging Speed, 2017-2031F
- Figure 208. Saudi Arabia Electric Vehicle Connector Market Share (%), By Mounting Type, 2017-2031F
- Figure 209. Saudi Arabia Electric Vehicle Connector Market Share (%), By End-user, 2017-2031F
- Figure 210. UAE Electric Vehicle Connector Market, By Value, In USD Million, 2017-2031F
- Figure 211. UAE Electric Vehicle Connector Market, By Volume, In Thousand Units, 2017-2031F
- Figure 212. UAE Electric Vehicle Connector Market Share (%), By Connector Type, 2017-2031F
- Figure 213. UAE Electric Vehicle Connector Market Share (%), By Current Type, 2017-2031F
- Figure 214. UAE Electric Vehicle Connector Market Share (%), By Charging Speed, 2017-2031F
- Figure 215. UAE Electric Vehicle Connector Market Share (%), By Mounting Type, 2017-2031F
- Figure 216. UAE Electric Vehicle Connector Market Share (%), By End-user, 2017-2031F
- Figure 217. South Africa Electric Vehicle Connector Market, By Value, In USD Million, 2017-2031F
- Figure 218. South Africa Electric Vehicle Connector Market, By Volume, In Thousand Units, 2017-2031F
- Figure 219. South Africa Electric Vehicle Connector Market Share (%), By Connector Type, 2017-2031F
- Figure 220. South Africa Electric Vehicle Connector Market Share (%), By Current Type, 2017-2031F
- Figure 221. South Africa Electric Vehicle Connector Market Share (%), By Charging Speed, 2017-2031F
- Figure 222. South Africa Electric Vehicle Connector Market Share (%), By Mounting Type, 2017-2031F
- Figure 223. South Africa Electric Vehicle Connector Market Share (%), By End-user, 2017-2031F
- Figure 224. By Connector Type Map-Market Size (USD Million) & Growth Rate (%), 2023
- Figure 225. By Current Type Map-Market Size (USD Million) & Growth Rate (%), 2023
- Figure 226. By Charging Speed Map-Market Size (USD Million) & Growth Rate (%), 2023
- Figure 227. By Mounting Type Map-Market Size (USD Million) & Growth Rate (%), 2023
- Figure 228. By End-user Map-Market Size (USD Million) & Growth Rate (%), 2023
- Figure 229. By Region Map-Market Size (USD Million) & Growth Rate (%), 2023
Global electric vehicle connector market size was valued at USD 75.48 million in 2023, expected to reach USD 325.63 million in 2031, with a CAGR of 20.05% for the forecast period between 2024 and 2031. The global electric vehicle connector market is experiencing a significant surge, driven by the increasing adoption of electric vehicles worldwide. The transition towards sustainable transportation and government initiatives promoting clean energy has fueled the demand for EVs, subsequently boosting the market for electric vehicle connectors. Stringent emissions regulations and a growing consumer environmental consciousness are pivotal factors propelling this market forward. As automakers continue to invest heavily in electric mobility, the need for reliable and efficient charging infrastructure becomes paramount, driving the demand for advanced EV connectors. Innovations in the EV connector market is marked by a focus on faster charging solutions, enhanced safety features, and compatibility across different charging standards.
The advent of high-power charging technologies, such as ultra-fast chargers capable of delivering substantial energy in a shorter time frame, addresses a key concern for EV users - charging time. Furthermore, smart, and wireless charging technologies are gaining prominence, providing added convenience to users. The integration of advanced materials and design enhancements aims to make connectors more durable and efficient. Collaborations between automakers and charging infrastructure providers are fostering interoperability, ensuring a seamless charging experience for EV users globally. Overall, the electric vehicle connector market is evolving rapidly to meet the evolving needs of the burgeoning electric mobility sector. For example, Starbucks has partnered with Volvo to open 50 DC fast charging stations at 15 Starbucks stores in Colorado, Utah, Idaho, Oregon, route from Denver to Seattle. The charging stations can recharge any electric car with a CCS1 or CHAdeMO connector, including Volvo's C40 Recharge.
Increasing Investment in Charging Network
The global electric vehicle connector market is witnessing a substantial boost due to the increasing investment in charging networks by key players. Recognizing the pivotal role of charging infrastructure in promoting electric mobility, major companies such as Tesla and charging network operators are allocating significant resources to expand and enhance charging networks. These strategic investments focus on deploying more charging stations, especially fast-charging ones, to address range anxiety and encourage widespread EV adoption. Collaborations between automakers and charging infrastructure providers further amplify this trend, fostering interoperability and a seamless charging experience. This robust commitment to building a comprehensive charging network underscores the key players' dedication to supporting the growth and accessibility of electric vehicles globally.
Technological Advancements in Electric Vehicle Connector
Technological advancements propel the market forward, as continuous innovation addresses key challenges and enhances overall efficiency. Advancements in materials and design contribute to the development of more durable and heat-resistant connectors. High-power charging technologies are evolving rapidly, enabling faster charging times, and addressing a critical concern for EV users. The integration of smart features, such as communication protocols and wireless connectivity, enhances user experience and enables seamless interactions with charging infrastructure. Moreover, ongoing research and development focus on creating connectors compatible with various charging standards, promoting interoperability and flexibility. For example, The SEVD™-V3 is a cable with a connector for EV DC charger/discharger, specifically designed for V2X (Vehicle-to-Everything) applications. It is a V2X connector that is the main part of the DC quick charger for EVs and vehicle-to-home (V2H) applications. The SEVD™-V3 is a compact, lightweight, and safe connector cable assembly for EVs, aiming to contribute to the realization of efficient and secure charging solutions.
Shift Towards DC Fast Charging Points
The market is witnessing a significant shift towards DC fast charging points, reflecting the industry's commitment to address range anxiety and enhance the charging experience. DC fast charging technology allows for rapid charging, significantly reducing the time required to recharge EV batteries. This shift is crucial in supporting long-distance travel and accommodating the growing number of electric vehicles on the roads. Key players in the EV connector market are actively investing in the development and deployment of DC fast charging infrastructure, aligning with the evolving needs of electric mobility. This transition underscores a strategic focus on enhancing convenience and accessibility and encouraging the widespread adoption of electric vehicles across the globe.
For example, Fujikura Components Ltd. offers a CCS Type2 connector that is lightweight, compact, and has a robust structure. The connector is stylishly designed and conforms to IEC62196-3 standards. The CCS Type2 connector complies with IEC62196-3 Config FF, weighs 1.1kg, and is tough. The connector is suitable for DC charging and can be used for fast charging of electric vehicles.
Government Regulations
Government regulations are pivotal in shaping the global electric vehicle connector market. Various countries are implementing stringent emission standards and providing financial incentives to promote the adoption of electric vehicles, driving the demand for EV connectors. Regulatory initiatives often include mandates for developing public charging infrastructure, influencing connector standards. Incentives such as tax credits, rebates, and subsidies for EV purchases create a favorable environment for consumers, stimulating market growth. Additionally, some regions are actively working on establishing standardized norms for connector design and safety features to ensure uniformity across the EV charging ecosystem. These evolving regulations underscore the commitment to sustainable transportation and significantly impact the dynamics of the global EV connector market.
For example, The Bureau of Indian Standards (BIS), India's National Standard Body, has approved the country's first indigenous AC and DC Combined Charging connector standard for light electric vehicles (LEVs). This standard, known as IS17017 (Part 2 / Sec 7): 2023, is the world's first combined AC and DC charging connector standard for LEVs. This innovation, developed in India, has the potential to set a global benchmark for the LEV industry.
Key Player Landscape and Outlook
The global electric vehicle connector market is characterized by the presence of key players driving innovation and market expansion. Leading companies such as Tesla and Siemens play pivotal roles, contributing to the development and deployment of advanced EV charging solutions. These companies focus on research and development to enhance connector technology, aiming for faster charging, improved safety, and compatibility across diverse charging standards. As the EV market continues to grow, collaborations and partnerships among key players become crucial for the establishment of a robust charging infrastructure. The outlook for the global EV connector market remains promising, with an increasing emphasis on interoperability, smart charging solutions, and sustainability in the evolving landscape of electric mobility.
For instance, in November 2022, Tesla made its EV charging connector design available to other automakers and network operators in North America to encourage adoption of the technology and make it the new standard. The charging connector in all Tesla vehicles offers AC charging and up to 1 MW DC charging, and its compact design and performance are considered superior to the Combined Charging System (CCS) connectors used by most EVs in North America. Tesla's design and specification files are available for download, and the company is actively working with relevant standards bodies to collect Tesla's charging connector as the North American Charging Standard (NACS).
For instance, in June 2022, Siemens invested USD 25 million to acquire a minority stake in WiTricity, a United States-based wireless charging technology company. The two companies aim to drive innovation in the wireless EV charging market, which is projected to reach USD 2 billion by 2028 in Europe and North America. They seek to address global standardization gaps, enable interoperability between vehicles and infrastructure, and advance the technical development of wireless charging systems.
Table of Contents
1. Research Methodology
2. Project Scope & Definitions
3. Executive Summary
4. Voice of Customer
- 4.1. Quality and Performance
- 4.2. Sustainability and Environmental Impact
- 4.3. Cost
- 4.4. Regulatory Approval and Safety
- 4.5. Innovation
- 4.6. Compatibility with Applications
- 4.7. Range and Battery Technology
- 4.8. Supply Chain and Availability
- 4.9. Brand Reputation and Trust
- 4.10. After-Sales Services and Support
5. Global Electric Vehicle Connector Market Outlook, 2017-2031F
- 5.1. Market Size & Forecast
- 5.1.1. By Value
- 5.1.2. By Volume
- 5.2. By Connector Type
- 5.2.1. Type 1
- 5.2.2. CCS
- 5.2.3. Chademo
- 5.2.4. Others
- 5.3. By Current Type
- 5.3.1. Alternate Current
- 5.3.2. Direct Current
- 5.4. By Charging Speed
- 5.4.1. Slow
- 5.4.2. Fast
- 5.4.3. Rapid
- 5.5. By Mounting Type
- 5.5.1. Floor Mounted
- 5.5.2. Wall Mounted
- 5.6. By End-user
- 5.6.1. Residential
- 5.6.2. Commercial
- 5.7. By Region
- 5.7.1. North America
- 5.7.2. Europe
- 5.7.3. South America
- 5.7.4. Asia-Pacific
- 5.7.5. Middle East and Africa
- 5.8. By Company Market Share (%), 2023
6. Global Electric Vehicle Connector Market Outlook, By Region, 2017-2031F
- 6.1. North America*
- 6.1.1. Market Size & Forecast
- 6.1.1.1. By Value
- 6.1.1.2. By Volume
- 6.1.2. By Connector Type
- 6.1.2.1. Type 1
- 6.1.2.2. CCS
- 6.1.2.3. Chademo
- 6.1.2.4. Others
- 6.1.3. By Current Type
- 6.1.3.1. Alternate Current
- 6.1.3.2. Direct Current
- 6.1.4. By Charging Speed
- 6.1.4.1. Slow
- 6.1.4.2. Fast
- 6.1.4.3. Rapid
- 6.1.5. By Mounting Type
- 6.1.5.1. Floor Mounted
- 6.1.5.2. Wall Mounted
- 6.1.6. By End-user
- 6.1.6.1. Residential
- 6.1.6.2. Commercial
- 6.1.7. United States*
- 6.1.7.1. Market Size & Forecast
- 6.1.7.1.1. By Value
- 6.1.7.1.2. By Volume
- 6.1.7.2. By Connector Type
- 6.1.7.2.1. Type 1
- 6.1.7.2.2. CCS
- 6.1.7.2.3. Chademo
- 6.1.7.2.4. Others
- 6.1.7.3. By Current Type
- 6.1.7.3.1. Alternate Current
- 6.1.7.3.2. Direct Current
- 6.1.7.4. By Charging Speed
- 6.1.7.4.1. Slow
- 6.1.7.4.2. Fast
- 6.1.7.4.3. Rapid
- 6.1.7.5. By Mounting Type
- 6.1.7.5.1. Floor Mounted
- 6.1.7.5.2. Wall Mounted
- 6.1.7.6. By End-user
- 6.1.7.6.1. Residential
- 6.1.7.6.2. Commercial
- 6.1.8. Canada
- 6.1.9. Mexico
- 6.1.1. Market Size & Forecast
All segments will be provided for all regions and countries covered:
- 6.2. Europe
- 6.2.1. Germany
- 6.2.2. France
- 6.2.3. Italy
- 6.2.4. United Kingdom
- 6.2.5. Russia
- 6.2.6. Netherlands
- 6.2.7. Spain
- 6.3. South America
- 6.3.1. Brazil
- 6.3.2. Argentina
- 6.4. Asia-Pacific
- 6.4.1. India
- 6.4.2. China
- 6.4.3. Japan
- 6.4.4. Australia
- 6.4.5. South Korea
- 6.5. Middle East & Africa
- 6.5.1. Saudi Arabia
- 6.5.2. UAE
- 6.5.3. South Africa
7. Market Mapping, 2023
- 7.1. By Connector Type
- 7.2. By Current Type
- 7.3. By Charging Speed
- 7.4. By Mounting Type
- 7.5. By End-user
- 7.6. By Region
8. Macro Environment and Industry Structure
- 8.1. Supply Demand Analysis
- 8.2. Import Export Analysis
- 8.3. Value Chain Analysis
- 8.4. PESTEL Analysis
- 8.4.1. Political Factors
- 8.4.2. Economic System
- 8.4.3. Social Implications
- 8.4.4. Technological Advancements
- 8.4.5. Environmental Impacts
- 8.4.6. Legal Compliances and Regulatory Policies (Statutory Bodies Included)
- 8.5. Porter's Five Forces Analysis
- 8.5.1. Supplier Power
- 8.5.2. Buyer Power
- 8.5.3. Substitution Threat
- 8.5.4. Threat from New Entrant
- 8.5.5. Competitive Rivalry
9. Market Dynamics
- 9.1. Growth Drivers
- 9.2. Growth Inhibitors (Challenges and Restraints)
10. Key Players Landscape
- 10.1. Competition Matrix of Top Five Market Leaders
- 10.2. Market Revenue Analysis of Top Five Market Leaders (in %, 2023)
- 10.3. Mergers and Acquisitions/Joint Ventures (If Applicable)
- 10.4. SWOT Analysis (For Five Market Players)
- 10.5. Patent Analysis (If Applicable)
11. Pricing Analysis
12. Case Studies
13. Key Players Outlook
- 13.1. Aptiv PLC
- 13.1.1. Company Details
- 13.1.2. Key Management Personnel
- 13.1.3. Products & Services
- 13.1.4. Financials (As reported)
- 13.1.5. Key Market Focus & Geographical Presence
- 13.1.6. Recent Developments
- 13.2. Fujikura Ltd.
- 13.3. Tyco Electronics Ltd.
- 13.4. Sumitomo Electric Industries Ltd.
- 13.5. HUBER+SUHNER Electronics Private Limited.
- 13.6. Tesla, Inc.
- 13.7. Siemens AG
- 13.8. Besen International Group Co., Ltd.
- 13.9. Harting Stiftung & Co. KG
- 13.10. Weidmuller Interface GmbH & Co. KG.
Companies mentioned above DO NOT hold any order as per market share and can be changed as per information available during research work.
