|
|
市場調査レポート
商品コード
1419589
電池リサイクルの世界市場の評価:プロセス別、材料別、電池タイプ別、由来別、地域別、機会、予測(2017年~2031年)Battery Recycling Market Assessment, By Process, By Material, By Battery Type, By Source, By Region, Opportunities and Forecast, 2017-2031F |
||||||
|
|
|||||||
|
● お客様のご希望に応じて、既存データの加工や未掲載情報(例:国別セグメント)の追加などの対応が可能です。 詳細はお問い合わせください。 |
|||||||


| 電池リサイクルの世界市場の評価:プロセス別、材料別、電池タイプ別、由来別、地域別、機会、予測(2017年~2031年) |
|
出版日: 2024年02月01日
発行: Market Xcel - Markets and Data
ページ情報: 英文 210 Pages
納期: 3~5営業日
|
- 全表示
- 概要
- 図表
- 目次
世界の電池リサイクルの市場規模は、2023年の282億米ドルから2031年に655億米ドルに達し、2024年~2031年の予測期間にCAGRで11.11%の成長が見込まれています。電池リサイクルには、エネルギー消費と製造コストの削減、天然資源の保護、環境に対する影響の最小化などの利点があります。市場は主に輸送、コンシューマーエレクトロニクスなどのさまざまな産業における電池リサイクルの需要の高まりによって、今後数年間で大きく成長すると予測されます。市場のその他の成長促進要因は、技術の進歩、研究、政府からの技術革新プロジェクト助成金、寿命の長いリサイクル可能な電子製品に対する需要の高まりなどです。
各市場企業は現在、顧客の需要を十分に満たし、収益拡大を図るため、世界各地に電池リサイクル設備を設立することに注力しています。このことにより、競争の激しい市場において各社のプレゼンスが高まります。
2023年2月、世界有数の電池リサイクル企業であるEcobatは、北米では初となる同社の第3のリチウムイオン電池リサイクル施設を建設しました。アリゾナ州カサグランデに建設された新工場は、当初は年間10,000トンの再生材料を生産する予定でしたが、今後数年間はリチウムイオン電池のリサイクル需要がますます高まるため、生産能力をさらに拡大する計画です。
再生リチウムイオン電池のEVへの利用
EVにおける再生リチウムイオン電池の使用の増加は、市場成長を大幅に促進します。EVに再生リチウムイオン電池が頻繁に導入されることで、コストを削減できるだけでなく、電池廃棄に関する極めて重要な懸念に対処することができます。
2023年12月、持続可能なエネルギー転換材料メーカーであるLohum Cleantechは、アラブ首長国連邦エネルギーインフラ省およびBEEAHと提携し、アラブ首長国連邦初のEV電池リサイクルプラントを設立しました。8万平方フィートのこの施設は、アラブ首長国連邦のNet Zero by 2050 Strategic InitiativeおよびCircular Economy Policyに沿ったもので、年間3,000トンのリチウムイオン電池をリサイクルし、15MWhの電池容量をエネルギー貯蔵システムに再利用します。
鉛蓄電池のリサイクルが市場成長を促進
鉛蓄電池のリサイクルプロセスは、市場成長を大きく促進しています。これは、コンシューマーエレクトロニクスにおけるより高いエネルギー効率への需要が増え続けていることと、UPSシステムのような小規模な電力貯蔵、自動車の照明・点火電源、大規模なグリッド規模の電力システムなどの多様な用途によるものです。
2023年11月、Battery Council Internationalは、米国が年間1億6,000万個以上の鉛蓄電池をリサイクルし、それによって埋立地行きになるのを防ぎ、材料の国内再利用を確保していることを述べました。99%のリサイクル率を誇る鉛蓄電池は、性能を劣化させることなく無限にリサイクルできる可能性を示しています。さらに、これらの電池は性能を損なうことなく繰り返しリサイクルすることが可能であり、より持続可能な循環型経済に寄与しています。
市場を積極的にリードするコンシューマーエレクトロニクス産業
コンシューマーエレクトロニクス産業は、電子機器に対する需要の増加と持続可能な廃棄物管理の必要性から、電池リサイクル市場に十分な機会をもたらしています。電子機器がより進化し普及するにつれて、その電池の需要も高まり、その結果、効率的で環境にやさしい電池リサイクルソリューションへのニーズが高まっています。
2023年10月、ネバダ州を拠点とする総合重要電池材料企業のAmerican Battery Technology Co.(ABTC)は、ネバダ州マッカランのTahoe-Reno Industrial Centreでリチウムイオン電池のリサイクル工場の稼働開始を発表しました。ABTCの総合電池リサイクルシステムは、高温炉や破砕、粉砕装置を使用する従来の電池リサイクル技術とは異なり、先進の再製造技術と標的化学抽出技術を採用しています。
当レポートでは、世界の電池リサイクル市場について調査分析し、市場規模と予測、市場力学、主要企業情勢と見通しなどを提供しています。
目次
第1章 調査手法
第2章 プロジェクトの範囲と定義
第3章 エグゼクティブサマリー
第4章 顧客の声
- 規制遵守
- 環境への取り組み
- 技術、プロセス
- 対応する電池タイプ
- 収集、運搬
- 認証
- データセキュリティ
- サステナビリティへの取り組み
第5章 世界の電池リサイクル市場の見通し(2017年~2031年)
- 市場規模と予測
- 金額
- 数量
- プロセス別
- 製錬
- 浸出
- 物理
- 材料別
- 金属
- プラスチック
- その他
- 電池タイプ別
- リチウムイオン電池
- 鉛蓄電池
- ニッケル電池
- その他
- 由来別
- 自動車用電池
- コンシューマーエレクトロニクス機器向け電池
- その他
- 地域別
- 北米
- アジア太平洋
- 欧州
- 南米
- 中東・アフリカ
- 市場シェア:企業別(2023年)
第6章 世界の電池リサイクル市場の見通し:地域別(2017年~2031年)
- 北米
- 市場規模と予測
- プロセス別
- 材料別
- 電池タイプ別
- 由来別
- 米国
- カナダ
- メキシコ
- 欧州
- ドイツ
- フランス
- イタリア
- 英国
- ロシア
- オランダ
- スペイン
- トルコ
- ポーランド
- 南米
- ブラジル
- アルゼンチン
- アジア太平洋
- インド
- 中国
- 日本
- オーストラリア
- ベトナム
- 韓国
- インドネシア
- フィリピン
- 中東・アフリカ
- サウジアラビア
- アラブ首長国連邦
- 南アフリカ
第7章 市場マッピング(2023年)
- プロセス別
- 材料別
- 電池タイプ別
- 由来別
- 地域別
第8章 マクロ環境と産業構造
- 需給分析
- 輸出入の分析
- バリューチェーン分析
- PESTEL分析
- ポーターのファイブフォース分析
第9章 市場力学
- 成長促進要因
- 成長抑制要因(課題、抑制要因)
第10章 主要企業情勢
- マーケットリーダー上位5社の競合マトリクス
- マーケットリーダー上位5社の市場収益分析(2023年)
- 合併と買収/合弁事業(該当する場合)
- SWOT分析(市場参入企業5社)
- 特許分析(該当する場合)
第11章 価格分析
第12章 ケーススタディ
第13章 主要企業の見通し
- Ecobat Battery Technologies
- American Battery Technology Company
- Contemporary Amperex Technology Co., Limited (CATL)
- Umicore
- Lithion Technologies
- Enersys
- Aqua Metals, Inc.
- Accurec-Recycling GmbH
- Attero Recycling Pvt Ltd
- AkkuSer Oy
第14章 戦略的推奨事項
第15章 当社について、免責事項
List of Tables
- Table 1. Pricing Analysis of Products from Key Players
- Table 2. Competition Matrix of Top 5 Market Leaders
- Table 3. Mergers & Acquisitions/ Joint Ventures (If Applicable)
- Table 4. About Us - Regions and Countries Where We Have Executed Client Projects
List of Figures
- Figure 1. Global Battery Recycling Market, By Value, In USD Billion, 2017-2031F
- Figure 2. Global Battery Recycling Market, By Volume, In Million Units, 2017-2031F
- Figure 3. Global Battery Recycling Market Share (%), By Process, 2017-2031F
- Figure 4. Global Battery Recycling Market Share (%), By Material, 2017-2031F
- Figure 5. Global Battery Recycling Market Share (%), By Battery Type, 2017-2031F
- Figure 6. Global Battery Recycling Market Share (%), By Source, 2017-2031F
- Figure 7. Global Battery Recycling Market Share (%), By Region, 2017-2031F
- Figure 8. North America Battery Recycling Market, By Value, In USD Billion, 2017-2031F
- Figure 9. North America Battery Recycling Market, By Volume, In Million Units, 2017-2031F
- Figure 10. North America Battery Recycling Market Share (%), By Process, 2017-2031F
- Figure 11. North America Battery Recycling Market Share (%), By Material, 2017-2031F
- Figure 12. North America Battery Recycling Market Share (%), By Battery Type, 2017-2031F
- Figure 13. North America Battery Recycling Market Share (%), By Source, 2017-2031F
- Figure 14. North America Battery Recycling Market Share (%), By Country, 2017-2031F
- Figure 15. United States Battery Recycling Market, By Value, In USD Billion, 2017-2031F
- Figure 16. United States Battery Recycling Market, By Volume, In Million Units, 2017-2031F
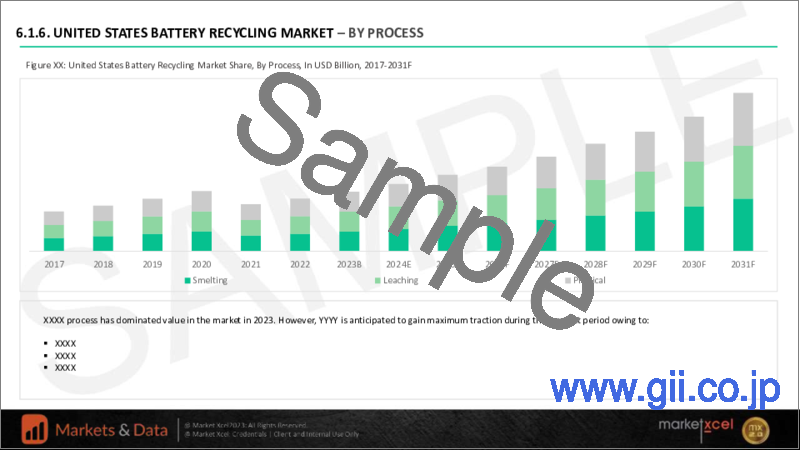
- Figure 17. United States Battery Recycling Market Share (%), By Process, 2017-2031F
- Figure 18. United States Battery Recycling Market Share (%), By Material, 2017-2031F
- Figure 19. United States Battery Recycling Market Share (%), By Battery Type, 2017-2031F
- Figure 20. United States Battery Recycling Market Share (%), By Source, 2017-2031F
- Figure 21. Canada Battery Recycling Market, By Value, In USD Billion, 2017-2031F
- Figure 22. Canada Battery Recycling Market, By Volume, In Million Units, 2017-2031F
- Figure 23. Canada Battery Recycling Market Share (%), By Process, 2017-2031F
- Figure 24. Canada Battery Recycling Market Share (%), By Material, 2017-2031F
- Figure 25. Canada Battery Recycling Market Share (%), By Battery Type, 2017-2031F
- Figure 26. Canada Battery Recycling Market Share (%), By Source, 2017-2031F
- Figure 27. Mexico Battery Recycling Market, By Value, In USD Billion, 2017-2031F
- Figure 28. Mexico Battery Recycling Market, By Volume, In Million Units, 2017-2031F
- Figure 29. Mexico Battery Recycling Market Share (%), By Process, 2017-2031F
- Figure 30. Mexico Battery Recycling Market Share (%), By Material, 2017-2031F
- Figure 31. Mexico Battery Recycling Market Share (%), By Battery Type, 2017-2031F
- Figure 32. Mexico Battery Recycling Market Share (%), By Source, 2017-2031F
- Figure 33. Europe Battery Recycling Market, By Value, In USD Billion, 2017-2031F
- Figure 34. Europe Battery Recycling Market, By Volume, In Million Units, 2017-2031F
- Figure 35. Europe Battery Recycling Market Share (%), By Process, 2017-2031F
- Figure 36. Europe Battery Recycling Market Share (%), By Material, 2017-2031F
- Figure 37. Europe Battery Recycling Market Share (%), By Battery Type, 2017-2031F
- Figure 38. Europe Battery Recycling Market Share (%), By Source, 2017-2031F
- Figure 39. Europe Battery Recycling Market Share (%), By Country, 2017-2031F
- Figure 40. Germany Battery Recycling Market, By Value, In USD Billion, 2017-2031F
- Figure 41. Germany Battery Recycling Market, By Volume, In Million Units, 2017-2031F
- Figure 42. Germany Battery Recycling Market Share (%), By Process, 2017-2031F
- Figure 43. Germany Battery Recycling Market Share (%), By Material, 2017-2031F
- Figure 44. Germany Battery Recycling Market Share (%), By Battery Type, 2017-2031F
- Figure 45. Germany Battery Recycling Market Share (%), By Source, 2017-2031F
- Figure 46. France Battery Recycling Market, By Value, In USD Billion, 2017-2031F
- Figure 47. France Battery Recycling Market, By Volume, In Million Units, 2017-2031F
- Figure 48. France Battery Recycling Market Share (%), By Process, 2017-2031F
- Figure 49. France Battery Recycling Market Share (%), By Material, 2017-2031F
- Figure 50. France Battery Recycling Market Share (%), By Battery Type, 2017-2031F
- Figure 51. France Battery Recycling Market Share (%), By Source, 2017-2031F
- Figure 52. Italy Battery Recycling Market, By Value, In USD Billion, 2017-2031F
- Figure 53. Italy Battery Recycling Market, By Volume, In Million Units, 2017-2031F
- Figure 54. Italy Battery Recycling Market Share (%), By Process, 2017-2031F
- Figure 55. Italy Battery Recycling Market Share (%), By Material, 2017-2031F
- Figure 56. Italy Battery Recycling Market Share (%), By Battery Type, 2017-2031F
- Figure 57. Italy Battery Recycling Market Share (%), By Source, 2017-2031F
- Figure 58. United Kingdom Battery Recycling Market, By Value, In USD Billion, 2017-2031F
- Figure 59. United Kingdom Battery Recycling Market, By Volume, In Million Units, 2017-2031F
- Figure 60. United Kingdom Battery Recycling Market Share (%), By Process, 2017-2031F
- Figure 61. United Kingdom Battery Recycling Market Share (%), By Material, 2017-2031F
- Figure 62. United Kingdom Battery Recycling Market Share (%), By Battery Type, 2017-2031F
- Figure 63. United Kingdom Battery Recycling Market Share (%), By Source, 2017-2031F
- Figure 64. Russia Battery Recycling Market, By Value, In USD Billion, 2017-2031F
- Figure 65. Russia Battery Recycling Market, By Volume, In Million Units, 2017-2031F
- Figure 66. Russia Battery Recycling Market Share (%), By Process, 2017-2031F
- Figure 67. Russia Battery Recycling Market Share (%), By Material, 2017-2031F
- Figure 68. Russia Battery Recycling Market Share (%), By Battery Type, 2017-2031F
- Figure 69. Russia Battery Recycling Market Share (%), By Source, 2017-2031F
- Figure 70. Netherlands Battery Recycling Market, By Value, In USD Billion, 2017-2031F
- Figure 71. Netherlands Battery Recycling Market, By Volume, In Million Units, 2017-2031F
- Figure 72. Netherlands Battery Recycling Market Share (%), By Process, 2017-2031F
- Figure 73. Netherlands Battery Recycling Market Share (%), By Material, 2017-2031F
- Figure 74. Netherlands Battery Recycling Market Share (%), By Battery Type, 2017-2031F
- Figure 75. Netherlands Battery Recycling Market Share (%), By Source, 2017-2031F
- Figure 76. Spain Battery Recycling Market, By Value, In USD Billion, 2017-2031F
- Figure 77. Spain Battery Recycling Market, By Volume, In Million Units, 2017-2031F
- Figure 78. Spain Battery Recycling Market Share (%), By Process, 2017-2031F
- Figure 79. Spain Battery Recycling Market Share (%), By Material, 2017-2031F
- Figure 80. Spain Battery Recycling Market Share (%), By Battery Type, 2017-2031F
- Figure 81. Spain Battery Recycling Market Share (%), By Source, 2017-2031F
- Figure 82. Turkey Battery Recycling Market, By Value, In USD Billion, 2017-2031F
- Figure 83. Turkey Battery Recycling Market, By Volume, In Million Units, 2017-2031F
- Figure 84. Turkey Battery Recycling Market Share (%), By Process, 2017-2031F
- Figure 85. Turkey Battery Recycling Market Share (%), By Material, 2017-2031F
- Figure 86. Turkey Battery Recycling Market Share (%), By Battery Type, 2017-2031F
- Figure 87. Turkey Battery Recycling Market Share (%), By Source, 2017-2031F
- Figure 88. Poland Battery Recycling Market, By Value, In USD Billion, 2017-2031F
- Figure 89. Poland Battery Recycling Market, By Volume, In Million Units, 2017-2031F
- Figure 90. Poland Battery Recycling Market Share (%), By Process, 2017-2031F
- Figure 91. Poland Battery Recycling Market Share (%), By Material, 2017-2031F
- Figure 92. Poland Battery Recycling Market Share (%), By Battery Type, 2017-2031F
- Figure 93. Poland Battery Recycling Market Share (%), By Source, 2017-2031F
- Figure 94. South America Battery Recycling Market, By Value, In USD Billion, 2017-2031F
- Figure 95. South America Battery Recycling Market, By Volume, In Million Units, 2017-2031F
- Figure 96. South America Battery Recycling Market Share (%), By Process, 2017-2031F
- Figure 97. South America Battery Recycling Market Share (%), By Material, 2017-2031F
- Figure 98. South America Battery Recycling Market Share (%), By Battery Type, 2017-2031F
- Figure 99. South America Battery Recycling Market Share (%), By Source, 2017-2031F
- Figure 100. South America Battery Recycling Market Share (%), By Country, 2017-2031F
- Figure 101. Brazil Battery Recycling Market, By Value, In USD Billion, 2017-2031F
- Figure 102. Brazil Battery Recycling Market, By Volume, In Million Units, 2017-2031F
- Figure 103. Brazil Battery Recycling Market Share (%), By Process, 2017-2031F
- Figure 104. Brazil Battery Recycling Market Share (%), By Material, 2017-2031F
- Figure 105. Brazil Battery Recycling Market Share (%), By Battery Type, 2017-2031F
- Figure 106. Brazil Battery Recycling Market Share (%), By Source, 2017-2031F
- Figure 107. Argentina Battery Recycling Market, By Value, In USD Billion, 2017-2031F
- Figure 108. Argentina Battery Recycling Market, By Volume, In Million Units, 2017-2031F
- Figure 109. Argentina Battery Recycling Market Share (%), By Process, 2017-2031F
- Figure 110. Argentina Battery Recycling Market Share (%), By Material, 2017-2031F
- Figure 111. Argentina Battery Recycling Market Share (%), By Battery Type, 2017-2031F
- Figure 112. Argentina Battery Recycling Market Share (%), By Source, 2017-2031F
- Figure 113. Asia-Pacific Battery Recycling Market, By Value, In USD Billion, 2017-2031F
- Figure 114. Asia-Pacific Battery Recycling Market, By Volume, In Million Units, 2017-2031F
- Figure 115. Asia-Pacific Battery Recycling Market Share (%), By Process, 2017-2031F
- Figure 116. Asia-Pacific Battery Recycling Market Share (%), By Material, 2017-2031F
- Figure 117. Asia-Pacific Battery Recycling Market Share (%), By Battery Type, 2017-2031F
- Figure 118. Asia-Pacific Battery Recycling Market Share (%), By Source, 2017-2031F
- Figure 119. Asia-Pacific Battery Recycling Market Share (%), By Country, 2017-2031F
- Figure 120. India Battery Recycling Market, By Value, In USD Billion, 2017-2031F
- Figure 121. India Battery Recycling Market, By Volume, In Million Units, 2017-2031F
- Figure 122. India Battery Recycling Market Share (%), By Process, 2017-2031F
- Figure 123. India Battery Recycling Market Share (%), By Material, 2017-2031F
- Figure 124. India Battery Recycling Market Share (%), By Battery Type, 2017-2031F
- Figure 125. India Battery Recycling Market Share (%), By Source, 2017-2031F
- Figure 126. China Battery Recycling Market, By Value, In USD Billion, 2017-2031F
- Figure 127. China Battery Recycling Market, By Volume, In Million Units, 2017-2031F
- Figure 128. China Battery Recycling Market Share (%), By Process, 2017-2031F
- Figure 129. China Battery Recycling Market Share (%), By Material, 2017-2031F
- Figure 130. China Battery Recycling Market Share (%), By Battery Type, 2017-2031F
- Figure 131. China Battery Recycling Market Share (%), By Source, 2017-2031F
- Figure 132. Japan Battery Recycling Market, By Value, In USD Billion, 2017-2031F
- Figure 133. Japan Battery Recycling Market, By Volume, In Million Units, 2017-2031F
- Figure 134. Japan Battery Recycling Market Share (%), By Process, 2017-2031F
- Figure 135. Japan Battery Recycling Market Share (%), By Material, 2017-2031F
- Figure 136. Japan Battery Recycling Market Share (%), By Battery Type, 2017-2031F
- Figure 137. Japan Battery Recycling Market Share (%), By Source, 2017-2031F
- Figure 138. Australia Battery Recycling Market, By Value, In USD Billion, 2017-2031F
- Figure 139. Australia Battery Recycling Market, By Volume, In Million Units, 2017-2031F
- Figure 140. Australia Battery Recycling Market Share (%), By Process, 2017-2031F
- Figure 141. Australia Battery Recycling Market Share (%), By Material, 2017-2031F
- Figure 142. Australia Battery Recycling Market Share (%), By Battery Type, 2017-2031F
- Figure 143. Australia Battery Recycling Market Share (%), By Source, 2017-2031F
- Figure 144. Vietnam Battery Recycling Market, By Value, In USD Billion, 2017-2031F
- Figure 145. Vietnam Battery Recycling Market, By Volume, In Million Units, 2017-2031F
- Figure 146. Vietnam Battery Recycling Market Share (%), By Process, 2017-2031F
- Figure 147. Vietnam Battery Recycling Market Share (%), By Material, 2017-2031F
- Figure 148. Vietnam Battery Recycling Market Share (%), By Battery Type, 2017-2031F
- Figure 149. Vietnam Battery Recycling Market Share (%), By Source, 2017-2031F
- Figure 150. South Korea Battery Recycling Market, By Value, In USD Billion, 2017-2031F
- Figure 151. South Korea Battery Recycling Market, By Volume, In Million Units, 2017-2031F
- Figure 152. South Korea Battery Recycling Market Share (%), By Process, 2017-2031F
- Figure 153. South Korea Battery Recycling Market Share (%), By Material, 2017-2031F
- Figure 154. South Korea Battery Recycling Market Share (%), By Battery Type, 2017-2031F
- Figure 155. South Korea Battery Recycling Market Share (%), By Source, 2017-2031F
- Figure 156. Indonesia Battery Recycling Market, By Value, In USD Billion, 2017-2031F
- Figure 157. Indonesia Battery Recycling Market, By Volume, In Million Units, 2017-2031F
- Figure 158. Indonesia Battery Recycling Market Share (%), By Process, 2017-2031F
- Figure 159. Indonesia Battery Recycling Market Share (%), By Material, 2017-2031F
- Figure 160. Indonesia Battery Recycling Market Share (%), By Battery Type, 2017-2031F
- Figure 161. Indonesia Battery Recycling Market Share (%), By Source, 2017-2031F
- Figure 162. Philippines Battery Recycling Market, By Value, In USD Billion, 2017-2031F
- Figure 163. Philippines Battery Recycling Market, By Volume, In Million Units, 2017-2031F
- Figure 164. Philippines Battery Recycling Market Share (%), By Process, 2017-2031F
- Figure 165. Philippines Battery Recycling Market Share (%), By Material, 2017-2031F
- Figure 166. Philippines Battery Recycling Market Share (%), By Battery Type, 2017-2031F
- Figure 167. Philippines Battery Recycling Market Share (%), By Source, 2017-2031F
- Figure 168. Middle East & Africa Battery Recycling Market, By Value, In USD Billion, 2017-2031F
- Figure 169. Middle East & Africa Battery Recycling Market, By Volume, In Million Units, 2017-2031F
- Figure 170. Middle East & Africa Battery Recycling Market Share (%), By Process, 2017-2031F
- Figure 171. Middle East & Africa Battery Recycling Market Share (%), By Material, 2017-2031F
- Figure 172. Middle East & Africa Battery Recycling Market Share (%), By Battery Type, 2017-2031F
- Figure 173. Middle East & Africa Battery Recycling Market Share (%), By Source, 2017-2031F
- Figure 174. Middle East & Africa Battery Recycling Market Share (%), By Country, 2017-2031F
- Figure 175. Saudi Arabia Battery Recycling Market, By Value, In USD Billion, 2017-2031F
- Figure 176. Saudi Arabia Battery Recycling Market, By Volume, In Million Units, 2017-2031F
- Figure 177. Saudi Arabia Battery Recycling Market Share (%), By Process, 2017-2031F
- Figure 178. Saudi Arabia Battery Recycling Market Share (%), By Material, 2017-2031F
- Figure 179. Saudi Arabia Battery Recycling Market Share (%), By Battery Type, 2017-2031F
- Figure 180. Saudi Arabia Battery Recycling Market Share (%), By Source, 2017-2031F
- Figure 181. UAE Battery Recycling Market, By Value, In USD Billion, 2017-2031F
- Figure 182. UAE Battery Recycling Market, By Volume, In Million Units, 2017-2031F
- Figure 183. UAE Battery Recycling Market Share (%), By Process, 2017-2031F
- Figure 184. UAE Battery Recycling Market Share (%), By Material, 2017-2031F
- Figure 185. UAE Battery Recycling Market Share (%), By Battery Type, 2017-2031F
- Figure 186. UAE Battery Recycling Market Share (%), By Source, 2017-2031F
- Figure 187. South Africa Battery Recycling Market, By Value, In USD Billion, 2017-2031F
- Figure 188. South Africa Battery Recycling Market, By Volume, In Million Units, 2017-2031F
- Figure 189. South Africa Battery Recycling Market Share (%), By Process, 2017-2031F
- Figure 190. South Africa Battery Recycling Market Share (%), By Material, 2017-2031F
- Figure 191. South Africa Battery Recycling Market Share (%), By Battery Type, 2017-2031F
- Figure 192. South Africa Battery Recycling Market Share (%), By Source, 2017-2031F
- Figure 193. By Process Map-Market Size (USD Billion) & Growth Rate (%), 2023
- Figure 194. By Material Map-Market Size (USD Billion) & Growth Rate (%), 2023
- Figure 195. By Battery Type Map-Market Size (USD Billion) & Growth Rate (%), 2023
- Figure 196. By Source Map-Market Size (USD Billion) & Growth Rate (%), 2023
- Figure 197. By Region Map-Market Size (USD Billion) & Growth Rate (%), 2023
Battery recycling market is projected to witness a CAGR of 11.11% during the forecast period 2024-2031, growing from USD 28.2 billion in 2023 to USD 65.5 billion in 2031. Battery recycling offers several benefits, which include reducing energy consumption and manufacturing costs, conserving natural resources, and minimizing environmental impact. The market is expected to grow significantly over the upcoming years, primarily driven by the growing demand for battery recycling in various industries such as transportation, consumer electronics, etc. Other factors proliferating the market growth include technological progress, research, and innovation project grants from governments, along with rising demand for recyclable electronic products with longer lifespans.
All the market players are currently focusing on establishing battery recycling units in various parts across the world to meet the customers' demands adequately and increase their revenue growth. This, in turn, will boost their prominence in this highly competitive market.
In Feb 2023, Ecobat, the world's leading battery recycling company, constructed its third lithium-ion battery recycling facility, and the first in North America. The new factory in Casa Grande, Arizona, would initially generate 10,000 tonnes of recovered material per year, with plans to expand the capacity even further to meet the ever-growing demand for lithium-ion battery recycling over the upcoming years.
Utilization of Reused Lithium-Ion Batteries in EVs
The rise in usage of reused Li-ion batteries in EVs proliferates market growth significantly. This frequent implementation of recycled lithium-ion batteries in EVs can reduce costs as well as address the pivotal concerns about battery disposals.
In December 2023, Lohum Cleantech, a sustainable energy transition materials producer, partnered with the UAE Ministry of Energy & Infrastructure and BEEAH to establish the UAE's first-ever EV battery recycling plant. The 80,000 sq ft facility, aligned with the UAE's Net Zero by 2050 Strategic Initiative and Circular Economy Policy, would recycle 3,000 tons of lithium-ion batteries annually, repurposing 15MWh battery capacity into energy storage systems. The joint venture would involve the creation of an 80,000 square feet facility dedicated to refurbishing and recycling lithium batteries, thereby contributing to the UAE's sustainability goals and circular economy policies.
Recycling of Lead Acid Batteries is Expediting the Market Growth
The lead acid battery recycling process is largely amplifying the market growth. This is due to the ever-increasing demand for higher energy efficiency in consumer electronics and its diverse range of applications in small-scale power storage like UPS systems, lighting & ignition power sources for automobiles, and large, grid-scale power systems.
In November 2023, Battery Council International stated that the United States recycles more than 160 million lead batteries annually, thereby preventing them from ending up in landfills and ensuring domestic reuse of materials. With a 99% recycling rate, lead batteries have demonstrated their potential for infinite recycling without performance degradation. Moreover, these batteries can be repeatedly recycled without any loss in performance, contributing to a more sustainable and circular economy.
The Consumer Electronics Appliance Industry is Positively Leading the Market
The consumer electronics appliances industry is leading to ample opportunities in the battery recycling market due to the increasing demand for electronic devices and the need for sustainable waste management. As electronic devices become more advanced and prevalent, the demand for their batteries also rises, resulting in a growing need for efficient and environmentally friendly battery recycling solutions.
In October 2023, American Battery Technology Co. (ABTC), a Nevada-based integrated critical battery materials firm, announced the operational launch of its lithium-ion battery recycling plant in McCarran, Nevada's Tahoe-Reno Industrial Centre. ABTC's integrated battery recycling system adopted advanced remanufacturing and targeted chemical extraction technology, which differs from traditional battery recycling technologies that employ high-temperature furnaces or shredding and grinding equipment.
Asia-Pacific Emerges as Dominant Force in Market Growth
Asia-Pacific comprehensively led the market growth in all aspects and is expected to continue its dominance over the years to come. The rise in demand for EVs and the continuous surge in the number of energy storage projects are some of the crucial factors augmenting the market growth in this region.
For example, in June 2023, Green Eco-Manufacture (GEM), a major Chinese cobalt refiner and lithium cathode precursor maker, announced the construction of a manufacturing facility in Yibin, southwest China's Sichuan province, to recycle decommissioned power and energy storage batteries as well as used battery components. The complex will have a capacity of 100,000 t/yr for decommissioned power batteries and scrap, 50,000 t/yr for used lithium iron phosphate (LFP) material, and 3GWh/yr for used energy storage battery packs, with a total expenditure of whooping USD 239 million. Moreover, GEM's subsidiary, Wuhan Power Battery Renewable Technology, will build the project in collaboration with local chemical manufacturer Yibin Tianyuan Group.
Government Initiatives to Augment the Market Growth
Government initiatives play a crucial role in the market, as they help ensure a sustainable future while addressing environmental challenges associated with battery waste. Moreover, these policies provide funding or tax incentives to support battery recycling facilities, making it more economically viable for businesses to invest in recycling infrastructure. These initiatives foster a circular economy and reduce the adverse environmental effects of battery waste. By embracing battery recycling, governments can drive substantial change, thereby protecting the environment, preserving resources, and paving the way for a greener and more sustainable future.
For example, in August 2022, recognizing the importance of battery recycling, the Indian government imposed critical rules and regulations to prioritize battery recycling and guarantee responsible handling of battery waste. On this basis, the proposed Battery Waste Management Rules, introduced in 2023, aimed to create a legislative framework for the safe disposal and recycling of all sorts of batteries. These projects highlight India's dedication to resource conservation and the establishment of a circular battery ecosystem that is highly sustainable.
Key Players Landscape and Outlook
Businesses are making significant investments in battery recycling procedures, which is fueling the expansion of the sector extensively. The market is also quite competitive, with major companies fighting for market dominance and spending capital on joint ventures, R&D projects, and partnerships to expand their product lines and obtain an advantage over rivals. The market for battery recycling appears to have a bright future, with significant growth anticipated in the upcoming years due to improvements in lead acid battery recycling processes.
In December 2023, to address environmental concerns related to safe disposal of EV batteries, Mahindra Last Mile Mobility Limited (MLMML), a subsidiary of Mahindra & Mahindra, joined hands with Attero, one of the global leaders in lithium-ion battery recycling and e-waste management. The aim of this collaboration is to advance sustainability and guarantee the appropriate recycling and repurposing of lithium-ion batteries.
In October 2023, American Battery Technology Company (ABTC) commercialized its technologies for primary battery minerals manufacturing and secondary minerals battery recycling. The company advanced operations and implemented its internally developed lithium-ion battery recycling technologies at its commercial-scale facility located in Nevada, which has been designated as a regional "innovation and technology hub" by the Biden Administration. ABTC's commercial lithium-ion battery recycling facility has the capacity to process over 20,000 metric tonnes per year of battery feedstock materials when fully ramped. The company announced several strategic partnerships for the sourcing of feed material and the offtake of recycled products with companies such as BASF, Nanotech, and FedEx.
Table of Contents
1. Research Methodology
2. Project Scope & Definitions
3. Executive Summary
4. Voice of Customer
- 4.1. Regulatory Compliance
- 4.2. Environmental Practices
- 4.3. Technology and Processes
- 4.4. Battery Types Accepted
- 4.5. Collection and Transportation
- 4.6. Certifications
- 4.7. Data Security
- 4.8. Sustainability Initiatives
5. Global Battery Recycling Market Outlook, 2017-2031F
- 5.1. Market Size & Forecast
- 5.1.1. By Value
- 5.1.2. By Volume
- 5.2. By Process
- 5.2.1. Smelting
- 5.2.2. Leaching
- 5.2.3. Physical
- 5.3. By Material
- 5.3.1. Metals
- 5.3.2. Plastic
- 5.3.3. Others
- 5.4. By Battery Type
- 5.4.1. Lithium-Ion Batteries
- 5.4.2. Lead Acid Batteries
- 5.4.3. Nickel Batteries
- 5.4.4. Others
- 5.5. By Source
- 5.5.1. Automotive Batteries
- 5.5.2. Consumer Electronics Appliance Batteries
- 5.5.3. Others
- 5.6. By Region
- 5.6.1. North America
- 5.6.2. Asia-Pacific
- 5.6.3. Europe
- 5.6.4. South America
- 5.6.5. Middle East and Africa
- 5.7. By Company Market Share (%), 2023
6. Global Battery Recycling Market Outlook, By Region, 2017-2031F
- 6.1. North America*
- 6.1.1. Market Size & Forecast
- 6.1.1.1. By Value
- 6.1.1.2. By Volume
- 6.1.2. By Process
- 6.1.2.1. Smelting
- 6.1.2.2. Leaching
- 6.1.2.3. Physical
- 6.1.3. By Material
- 6.1.3.1. Metals
- 6.1.3.2. Plastic
- 6.1.3.3. Others
- 6.1.4. By Battery Type
- 6.1.4.1. Lithium-Ion Batteries
- 6.1.4.2. Lead Acid Batteries
- 6.1.4.3. Nickel Batteries
- 6.1.4.4. Others
- 6.1.5. By Source
- 6.1.5.1. Automotive Batteries
- 6.1.5.2. Consumer Electronics Appliance Batteries
- 6.1.5.3. Others
- 6.1.6. United States*
- 6.1.6.1. Market Size & Forecast
- 6.1.6.1.1. By Value
- 6.1.6.1.2. By Volume
- 6.1.6.2. By Process
- 6.1.6.2.1. Smelting
- 6.1.6.2.2. Leaching
- 6.1.6.2.3. Physical
- 6.1.6.3. By Material
- 6.1.6.3.1. Metals
- 6.1.6.3.2. Plastic
- 6.1.6.3.3. Others
- 6.1.6.4. By Battery Type
- 6.1.6.4.1. Lithium-Ion Batteries
- 6.1.6.4.2. Lead Acid Batteries
- 6.1.6.4.3. Nickel Batteries
- 6.1.6.4.4. Others
- 6.1.6.5. By Source
- 6.1.6.5.1. Automotive Batteries
- 6.1.6.5.2. Consumer Electronics Appliance Batteries
- 6.1.6.5.3. Others
- 6.1.7. Canada
- 6.1.8. Mexico
- 6.1.1. Market Size & Forecast
All segments will be provided for all regions and countries covered:
- 6.2. Europe
- 6.2.1. Germany
- 6.2.2. France
- 6.2.3. Italy
- 6.2.4. United Kingdom
- 6.2.5. Russia
- 6.2.6. Netherlands
- 6.2.7. Spain
- 6.2.8. Turkey
- 6.2.9. Poland
- 6.3. South America
- 6.3.1. Brazil
- 6.3.2. Argentina
- 6.4. Asia-Pacific
- 6.4.1. India
- 6.4.2. China
- 6.4.3. Japan
- 6.4.4. Australia
- 6.4.5. Vietnam
- 6.4.6. South Korea
- 6.4.7. Indonesia
- 6.4.8. Philippines
- 6.5. Middle East & Africa
- 6.5.1. Saudi Arabia
- 6.5.2. UAE
- 6.5.3. South Africa
7. Market Mapping, 2023
- 7.1. By Process
- 7.2. By Material
- 7.3. By Battery Type
- 7.4. By Source
- 7.5. By Region
8. Macro Environment and Industry Structure
- 8.1. Supply Demand Analysis
- 8.2. Import Export Analysis
- 8.3. Value Chain Analysis
- 8.4. PESTEL Analysis
- 8.4.1. Political Factors
- 8.4.2. Economic System
- 8.4.3. Social Implications
- 8.4.4. Technological Advancements
- 8.4.5. Environmental Impacts
- 8.4.6. Legal Compliances and Regulatory Policies (Statutory Bodies Included)
- 8.5. Porter's Five Forces Analysis
- 8.5.1. Supplier Power
- 8.5.2. Buyer Power
- 8.5.3. Substitution Threat
- 8.5.4. Threat from New Entrant
- 8.5.5. Competitive Rivalry
9. Market Dynamics
- 9.1. Growth Drivers
- 9.2. Growth Inhibitors (Challenges and Restraints)
10. Key Players Landscape
- 10.1. Competition Matrix of Top Five Market Leaders
- 10.2. Market Revenue Analysis of Top Five Market Leaders (in %, 2023)
- 10.3. Mergers and Acquisitions/Joint Ventures (If Applicable)
- 10.4. SWOT Analysis (For Five Market Players)
- 10.5. Patent Analysis (If Applicable)
11. Pricing Analysis
12. Case Studies
13. Key Players Outlook
- 13.1. Ecobat Battery Technologies
- 13.1.1. Company Details
- 13.1.2. Key Management Personnel
- 13.1.3. Products & Services
- 13.1.4. Financials (As reported)
- 13.1.5. Key Market Focus & Geographical Presence
- 13.1.6. Recent Developments
- 13.2. American Battery Technology Company
- 13.3. Contemporary Amperex Technology Co., Limited (CATL)
- 13.4. Umicore
- 13.5. Lithion Technologies
- 13.6. Enersys
- 13.7. Aqua Metals, Inc.
- 13.8. Accurec-Recycling GmbH
- 13.9. Attero Recycling Pvt Ltd
- 13.10. AkkuSer Oy
Companies mentioned above DO NOT hold any order as per market share and can be changed as per information available during research work.